
Abstract
Estimation of glycemic variability requires frequent measures of glucose and is greatly aided by continuous glucose monitoring (CGM); however, under real-world conditions, missing data or “gaps” of ≥ 10 minutes can occur in CGM data, affecting the reliability of certain estimates. Thus, we determined the magnitude of the gap problem as observed in a cohort of patients with type 2 diabetes and demonstrated an approach to fill the gaps. The approach takes the difference between readings before and after a gap and distributes the difference equally across the number of missing readings, as determined by the sensor's setting for reading frequency. The approach is easy to implement, conservative, and improves estimation of variability measures that reference time, namely, mean of daily differences and continuous overlapping net glycemic action.
Introduction
There are numerous methods to quantify glycemic variability [e.g., standard deviation (SD), coefficient of variation, mean amplitude of glycemic excursion (MAGE), and continuous overlapping net glycemic action (CONGA)], and there is a growing interest in which of these methods are the best metrics for understanding the relationship between glycemic variability and clinical outcomes.1–8 The ability to obtain the quantity of data necessary for optimal calculation of such measures of glycemic variability has become easier with the development of continuous glucose monitoring (CGM) systems, which generally display a glucose value every 1–5 min. However, although an improvement over finger stick measures of glucose in terms of quantity, CGM data have problems; specifically, there may be missing data or gaps in measurement that exceed what is expected given the frequency at which the sensor is set to sample the wearer's interstitial fluid. The bigger the gap, the more unreliable certain measures become; i.e., gaps of 2–4 h affect estimates of SD and CONGA, and gaps greater than 1 h affect estimates of MAGE. 9 This article documents the magnitude of the gap problem as observed in a cohort of patients with type 2 diabetes and demonstrates a method for filling the data gaps.
Methods
Data Source
The data for this report were generated from a two-arm, 12-month, prospective clinical study of CGM in people with type 2 diabetes and not taking prandial insulin (n = 50), as compared with self-monitoring of blood glucose (n = 50).10,11 Participants randomized to the CGM group were asked to wear the Dexcom™ SEVEN® CGM System (Dexcom, Inc., San Diego, CA) for up to 8 weeks over 3 months. The Dexcom SEVEN reports interstitial sugar levels every 5 min for 7 days.
For this demonstration, we extracted glucose readings from the Dexcom SEVEN from 47 of the 50 study participants (3 never wore the device), and we selected the middle 3 days of each week of use for this analysis to allow participants ample time for start-up calibration and to standardize the amount of CGM data available for analysis because some participants wore the monitor for less than the full 7 days. Additionally, we used the first available 3-day period of CGM use (from as many as eight possible periods of use) to calculate the difference before and after estimation of the missing data.
Gap Fill — Step 1
We calculated the time between readings in the data to identify the number and size of gaps exceeding 5 min and flagged them. For gaps exceeding 5 min, we calculated the difference between the glucose values before and after the gap (called “glucose difference” in the formula below). These actions were performed using the Statistical Analysis System® (SAS) version 9.2 (SAS Institute, Inc., Cary, NC).
Gap Fill — Step 2
The data were then exported to Oracle® Database 11g (Oracle, Redwood Shores, CA), and we used the Oracle PL/SQL (Procedural Language/Structured Query Language) procedure to add rows to the data for each missing 5 min increment and to insert an estimated glucose value. The formula for the estimated glucose values was:

Analysis of the Gap-Fill Process
The analysis compared various measures of glycemic quality before and after filling the gaps in the data. The measures were mean glucose, SD, MAGE, CONGA, mean of daily difference (MODD) proportion of readings < 70 mg/dl and proportion of readings > 240 mg/dl. The measures were calculated using EasyGV© Version 8.6 (N. R. Hill, University of Oxford, Oxford, UK) 12 or SAS version 9.2.
Results
In the 3-day periods examined, the total number of gaps exceeding 5 min in duration was 2321 for all 47 study participants, representing 7.5% of the data. Mean duration of the gaps was 20.7 min (+ SD of 64.0 min), and median duration was 10 min. All participants had gaps in their CGM data, and the frequency of the gaps varied. The lowest number of gaps per participant was 12, and the highest number was 139.
The gaps occurred throughout the 3 days of CGM use. For example, the graphical display of one study participant's CGM data showed gaps at the beginning of the 3 days selected, a few hours past the 24-h mark, at the 48-h mark, and several hours after the 48-h mark (
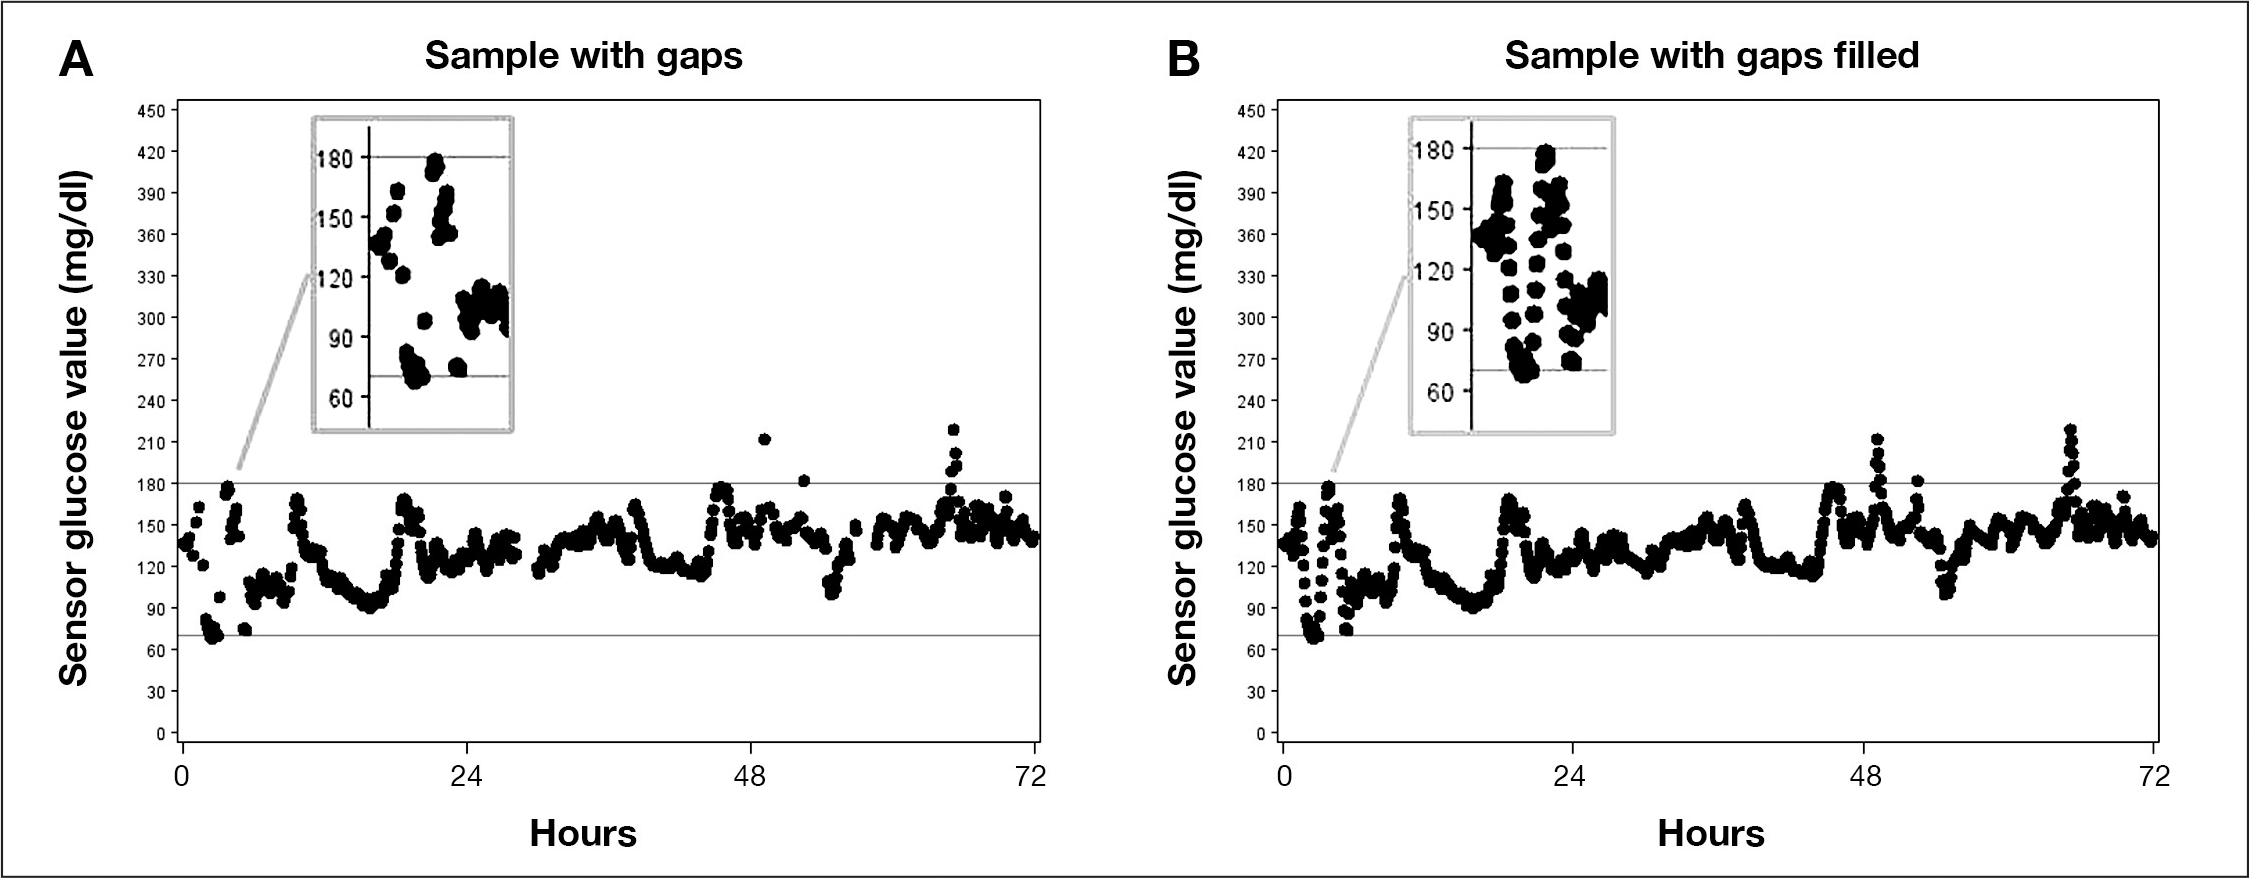
Graphical Example of CGM Data for One Participant With Gaps
The mean difference (+ SD) before and after filling the gaps was 2.1 (+ 3.7; p = .0003) mg/dl for the CONGA. It was not possible to calculate the MODD in EasyGV until after the gaps in data were filled and, therefore, mean difference could not be calculated.
The mean difference (+ SD) for other measures before and after filling the gaps was 0.9 (+ 4.5; p = .20) mg/dl for mean glucose; 0.3 (+ 1.7; p = .21) mg/dl for the SD of the glucose readings; 0.2 (+ 14.3; p = .91) mg/dl for the MAGE; and 0.10 (+ 1.47; p = .63) for proportion < 70 mg/dl and 0.30 (+ 1.58; p = .20) for proportion > 240 mg/dl.
Discussion
Gaps in CGM data are common and can occur for a variety of reasons, such as intermittent sensor errors (as opposed to outright sensor failure, which results in unusable data altogether), sensor compression, and user errors. Whatever the reason, gaps can affect the measures used to calculate glycemic variability. Thus, we devised a linear interpolation approach to fill the gaps. The approach distributed the pregap and postgap glucose difference evenly across the expected time points or missed readings.
Application of the linear interpolation process that we devised improved calculation of time-dependent measures while having no effect on measures that disregarded time of day. Specifically, the process made it possible to obtain an estimate of the MODD, which is a measure of the difference between glucose values at the same time of day on consecutive days, or interday variation, and led to a significantly different estimate of the CONGA, which is a measure that captures the SD of the difference in glucose levels using different time periods, or intraday variation. The approach used here did not significantly change the estimates for mean glucose, SD, and MAGE. There are multiple measures of quality of glycemic control; each has merits and deficiencies,13,14 and none is considered a “gold standard.” 14 We believe that application of the linear interpolation approach described herein expands the number and type of measures available to investigators and clinicians for their respective objectives.
Although a separate issue, the accuracy of CGM readings per se cannot be overlooked. The mean percent relative difference of commercially available CGM systems is 16% for the Dexcom SEVEN PLUS 15 and 19.7% for the Medtronic Guardian® REAL-Time CGM System (Medtronic, Inc., Minneapolis, MN). 16 Factors contributing to accuracy include the calibration of the CGM device against self-monitoring of blood glucose by finger stick, which is prone to inaccuracy because of user technique, 17 the timing of calibration, and the calibration algorithms of the CGM device. 18
Despite these inaccuracies, the American Diabetes Association sees a role for CGM, which is to determine patterns in 24-h glucose monitoring and to identify previously unobserved hypoglycemia. 19 In addition, a comparative effectiveness review concluded that CGM is superior to finger stick glucose measurement in achieving lower hemoglobin A1c levels without a concomitant rise in the rate of severe hypoglycemia in nonpregnant adults with type 1 diabetes. 20 The approach used here to repair gaps makes it possible to observe complete blood glucose patterns and to do so with a more complete set of measures.
A limitation of this process is that if the duration of a gap is long enough for the user to experience a significant change in glucose and then begin to return to the mean before the sensor readings resume, the true size of the change will not be addressed by the linear estimation used here. Likewise, if the rate of change in the user's glucose is nonlinear, then measures of rate of change (e.g., average absolute rate of change and SD rate of change) 21 calculated using the data generated by the gap-fill process might be wrong. The extent of inaccuracy probably depends on the size of the gap. Whitelaw and coauthors 21 have shown that the optimal block of time for analyzing rate of change is 60 min. Examination of the data for this project identified 85 gaps ≥ 60 min in duration, which was 0.2% of the total number of readings in the original and corrected data sets or 3.7% of the total number of gaps in the original CGM data. Thus, we believe this limitation is minor and can be addressed by modifying the gap-fill process to flag gaps ≥ 60 min, giving the analyst the choice to exclude interpolated data for those gaps in subsequent calculations of glycemic variability and/or to exclude measures of rate of change.
Strengths of the gap repair process are that it is conservative, uses the known readings before and after the gaps, is easy to implement with several steps, and makes it possible to calculate time-dependent measures.
Footnotes
Abbreviations:
The project was sponsored by an investigator-initiated grant from Dexcom, Inc. (San Diego, CA) to Robert A. Vigersky, M.D., Walter Reed National Military Medical Center, Bethesda, MD.
Acknowledgments:
The opinions expressed herein reflect the personal views of the authors and do not represent the official views of the United States Army or the United States Department of Defense.