
Abstract
Importance
Adenoid enlargement in preschool children is commonly cited as a cause of nasal obstruction and sleep-disordered breathing, yet age-related lymphoid development complicates differentiation between physiological growth and clinically significant hypertrophy. Existing endoscopic grading schemes lack consensus on age-specific normative limits and clear management thresholds.
Objective
This study aimed to determine endoscopic adenoid-to-choanae (A/C) ratio cut-offs that discriminate symptomatic from asymptomatic preschool children and to propose a practical, management-oriented grading scale.
Design
STROBE.
Participants
We performed a retrospective analysis of 225 preschool children (age 3-7). Standardized history-taking, flexible nasopharyngoscopy, MASNA (Mucus on Adenoid Scale by Nasopharyngoscopy Assessment) mucus scoring, and tympanometry were performed.
Intervention
Children were classified as symptomatic (≥2 “yes” responses to core symptom items) or asymptomatic (no more than one “occasionally” response). Adenoid size was quantified from blinded video review as the A/C ratio.
Main Outcome Measures
Receiver operating characteristic (ROC) analysis identified an optimal A/C threshold for symptomatic status; multivariable logistic regression evaluated independent predictors.
Results
Median A/C ratio was greater in symptomatic versus asymptomatic children. Symptomatic children also had higher MASNA mucus scores, greater reported rhinorrhea frequency, and less favorable tympanometric profiles. ROC analysis identified an A/C ratio of 60% as the optimal cut-off to discriminate symptomatic from asymptomatic children. An A/C ratio >60% emerged as the sole independent predictor of symptomatic status.
Conclusion
In this cohort, the endoscopic A/C ratio strongly discriminated symptomatic from asymptomatic presentations. An A/C threshold of 60% reliably separated predominantly asymptomatic from symptomatic children.
Relevance
These findings, in conjunction with clinical experience and results from our previous studies, form the basis for a proposed three-tier, management-oriented endoscopic scale for preschool patients: Degree I (A/C ≤60%)—within age-appropriate norm; Degree II (A/C 65%-75%)—hypertrophy amenable to conservative management/observation; Degree III (A/C ≥80%)—hypertrophy for which we suggest that surgical intervention ought to be considered.

Keywords
Introduction
Background
Adenoid hypertrophy (AH) is frequently implicated in impaired health and functional status among preschool-aged children and often prompts parental requests for surgical intervention. However, adenoidectomy carries both anesthetic and surgical risks, including dislodgement of deciduous teeth, temporomandibular joint dislocation, accidental extubation or kinking of the endotracheal tube, hemorrhage (with severe bleeding occurring in up to 0.5% of cases), dehydration, pulmonary infection, and velopharyngeal insufficiency. Rare but serious complications, such as atlantoaxial subluxation (Grisel’s syndrome), cervicofacial emphysema, and cervical necrotizing fasciitis, have also been reported.1 -4
Although most of these complications are exceedingly rare, they invariably cause considerable stress for the patient, parents, and surgical team. It is estimated that approximately 1 in 10,000 patients may die as a result of hemorrhagic, anesthetic, or cervical complications related to adenoidectomy. 1 Therefore, both clinicians and parents should be fully convinced of the necessity of performing the procedure in each individual case.
Moreover, potential long-term immunological consequences of lymphoid tissue removal in childhood have been reported. Byars et al analyzed data from the Danish birth registry, including approximately 1.2 million individuals born between 1979 and 1999 whose health outcomes were tracked until 2009. Among nearly 50,000 children who underwent adenoidectomy, the authors observed an increased risk of chronic obstructive pulmonary disease and upper respiratory tract infections later in life, suggesting an association between early removal of upper airway immune components and subsequent infectious morbidity. 5 The impact of adenoidectomy on the immune system has also been supported by other studies summarized in the review by Liu et al. 6
Physiologically, the lymphoid structures of Waldeyer’s ring develop throughout early childhood, and immunologically mediated enlargement of the adenoid may therefore represent normal growth rather than pathological hypertrophy in preschool children. 7 It seems that this process should be treated similarly to the case of, for example, the thymus in children, when we did not talk about thymus hypertrophy, but about the process of its natural growth and involution. 8 Despite frequent clinical reference to “adenoid hypertrophy,” there is limited consensus in the literature regarding quantitative thresholds that distinguish normal age-related adenoid size from clinically significant hypertrophy that warrants pharmacological management, watchful waiting, or surgical intervention.
Nasopharyngoscopy (nasofiberoscopy) is considered the diagnostic gold standard for assessment of adenoid size and morphology. 9 Existing endoscopic grading systems describe adenoid enlargement either by proportional occupancy of the nasopharyngeal space (eg, scales with 25% or 33% increments) or by anatomical relationships to adjacent structures.10 -18 These systems, however, do not consistently define age-specific normative limits or specify thresholds at which conservative versus surgical management should be recommended.
Objectives
The aim of the present study was to address this gap by comparing endoscopic adenoid size in 2 groups of preschool children—those without parental reports of adenoid-related symptoms and those presenting with symptoms consistent with clinically significant adenoid hypertrophy—with the goal of identifying practical, clinically meaningful adenoid-to-choanae (A/C) ratio cut-offs to guide management.
Methods
Study Design
This was a retrospective, cross-sectional study conducted at a single outpatient clinic.
Setting
We analyzed the medical records of 396 preschool children (aged 3-7 years) who were evaluated at an Ear, Nose, and Throat (ENT) outpatient clinic between 2024 and 2025 for suspected otolaryngological problems, as referred by pediatricians or reported by parents. After applying exclusion criteria, a group of 225 patients (88 girls, 137 boys) was selected for further analysis. All children underwent standardized history-taking and ENT examination, including flexible nasopharyngoscopy and tympanometry. Analyzing the PubMed database, 3 symptoms most often associated in the literature with adenoid hypertrophy in children were selected. The standardized history included those three core parental-report items: impaired nasal patency, mouth breathing during sleep, and snoring. Responses were recorded using a three-level scale: “yes,” “occasionally,” or “no.” Parents also reported the frequency of rhinorrhea (expressed as weeks per month) during the period of highest symptom intensity. The thermal (seasonal) period at the time of examination was documented, given its potential influence on symptom reporting and endoscopic findings. 19
Participants
Eligibility criteria: From the initial cohort, 2 groups were defined. The asymptomatic group included children whose parents answered “no” to all three core questions, or “no” to two questions and “occasionally” to one. The symptomatic group included children with at least 2 “yes” responses to the 3 core questions.
Exclusion criteria: Exclusion criteria comprised recent or prolonged intranasal steroid therapy (lasting more than 5 weeks or administered within 3 months prior to examination) for adenoid disease; craniofacial anomalies; chromosomal or genetic syndromes (eg, Down syndrome); nasal septal deviation; nasal polyps; inferior turbinate hypertrophy; and active upper respiratory infection at the time of assessment. Patients who had previously undergone tonsillectomy or adenoidectomy were also excluded.
Children who failed to cooperate during the examination, making it impossible to perform the endoscopic assessment properly, were likewise excluded. However, such instances occurred only very rarely.
Variables and Data Collection
Endoscopic and tympanometric assessment
Flexible nasopharyngoscopy was performed with the child in a seated position by a pediatric ENT specialist (A.Z.), using a Karl Storz Tele Pack system with a 2.8 mm flexible nasopharyngoscope (300 mm length). To accurately visualize the actual conditions of the nose and nasopharynx in the examined children, topical decongestion or anesthesia was not used before endoscopy. Tympanometry was performed using a GSI 39 AutoTymp (Grason-Stadler, USA); tympanograms were classified according to the Liden and Jerger system.20,21 For analysis, each subject’s worst tympanogram from either ear was used and grouped into 3 categories: type B (worst), type C (intermediate), and type A (normal).
Image analysis and scoring
Video recordings of the nasopharynx were coded and independently and blindly assessed. Adenoid size was quantified as the A/C ratio, with measurements estimated to the nearest 5%. Mucus coverage of the adenoid was graded using the Mucus of Adenoid Scale by Nasopharyngoscopy Assessment (MASNA), a four-point scale: 0, no mucus; 1, residue of clear watery mucus; 2, some dense mucus; 3, copious thick dense mucus. 19 Adenoid size determined during blinded video review was compared with the size recorded during the clinical visit. Patient demographic and clinical characteristics are summarized in Table 1.
Demographic and Clinical Characteristics of the Study Population According to the Presence of AH Symptoms.

Abbreviations: A/C, adenoid-to-choanae; AH, adenoid hypertrophy; MASNA, Mucus on Adenoid Scale by Nasopharyngoscopy Assessment.
The bold values indicate statistically significant values.
Bias
To mitigate observer bias, video recordings of the nasopharynx were coded and assessed independently and blindly by a second ENT physician (K.M.). Discrepancies in A/C ratio or MASNA scoring were resolved by adjudication with a third ENT physician (P.B.). Inter-rater agreement between the 2 primary raters was evaluated using the intraclass correlation coefficient (ICC, 2-way mixed effects, single measure, absolute agreement) for the continuous A/C ratio and weighted Cohen’s κ (quadratic weights) for the MASNA categorical score. Inter-rater reliability between the 2 primary ENT physicians for the A/C ratio was high, with an ICC = 0.994 (95% CI: 0.992-0.995, P < .001) and a percentage agreement of 90.2%. For the MASNA score, inter-rater reliability was assessed using weighted Cohen’s κ (quadratic weights), which was κ = 0.981 (95% CI: 0.968-0.994, P < .001), with 96% exact agreement between categories. These data confirm that the A/C ratio and MASNA score assessments performed by the 2 primary ENT physicians were highly consistent.
Study Size and Missing Data
In this retrospective study, the sample size was determined by the number of eligible patients with available data during the study period. After applying inclusion criteria based on the reported or not adenoid hypertrophy symptoms (impaired nasal patency, mouth breathing during sleep, and snoring) and the above-mentioned exclusion criteria, 225 preschool children (88 girls, 137 boys) were eligible for analysis. No missing data were present in the final dataset used for statistical analyses.
Statistical Analysis
Group comparisons were performed for demographic variables, A/C ratio, MASNA score, reported rhinorrhea frequency, and tympanometric category. Quantitative variables are summarized as medians with interquartile ranges (Q25-Q75), whereas categorical variables are reported as absolute numbers (n) and percentages (%). Differences in the distribution of categorical variables were evaluated using Pearson’s χ2 or Fisher’s exact test, as appropriate. The Mann–Whitney U test was used for comparison of quantitative variables between 2 groups. Receiver operating characteristic (ROC) curve analysis was used to assess the diagnostic performance of the A/C ratio for discriminating symptomatic from asymptomatic children and to identify an optimal cut-off value. Variables significant in univariable analyses were entered into multivariable logistic regression to evaluate independent associations with symptomatic status. Odds ratios (OR) and 95% confidence intervals (95% CIs) were also calculated for the considered clinical variables in the regression model. The continuous relationship between the A/C ratio and the probability of adenoid hypertrophy–related symptoms was demonstrated using penalized logistic regression. For all analyses, 2-tailed P values were calculated, and a P value <.05 was considered statistically significant. All statistical analyses were performed with SPSS software (Statistical Package for the Social Sciences version 29, Armonk, NY, USA).
Ethics
Ethical approval for this study was obtained from the Ethics Committee of Nicolaus Copernicus University (KEWL21/2025).
Results
Patient Characteristics Associated With Symptomatic Adenoid Hypertrophy
Of the 225 analyzed subjects, 123 met the symptom-based criteria for adenoid hypertrophy and 102 comprised the asymptomatic control group. The 2 groups were comparable with respect to age, sex distribution, and season of examination (Table 1). Median A/C ratio was significantly greater in the symptomatic group than in the asymptomatic group (80% vs 60%, P < .001). Significant between-group differences were also observed for MASNA mucus scores (P = .013), reported weeks of rhinorrhea per month (median 2 weeks vs 1 week, P = .033), and tympanometric category (P = .018).
Association of A/C Ratio With Symptomatic Adenoid Hypertrophy
Based on the diagnostic evaluation of the A/C ratio, its ability to discriminate between asymptomatic and symptomatic adenoid hypertrophy was assessed. ROC analysis demonstrated a significant discriminative capacity of the A/C ratio (AUC (area under the curve) = 0.853, 95% CI: 0.804-0.902; P < .001) and identified an A/C ratio threshold of 60% as the optimal cut-off for symptomatic status (Figure 1, Table 2). In the analyzed cohort, the A/C ratio showed satisfactory diagnostic performance at the proposed cut-off point of 60% (<60% vs ≥60%), with higher A/C values being associated with an increased likelihood of symptomatic adenoid hypertrophy. For the cut-off value of 60%, the sensitivity reached 84.6%, while the specificity was 64.7%. The corresponding predictive values were also acceptable (PPV (positive predictive value) = 74.3%, NPV (negative predictive value) = 78.6%), indicating a clinically meaningful probability of correctly identifying both symptomatic and asymptomatic patients using this parameter. To evaluate the internal stability of the predefined 60% A/C ratio cut-off, a nonparametric bootstrap (2000 resamples) was performed to assess the variability of sensitivity and specificity. The bootstrap-derived median sensitivity was 82.1% (95% CI: 74.9%-88.5%) and median specificity was 66.3% (95% CI: 56.8%-75.1%), closely aligning with the original dataset (sensitivity 84.6%; specificity 64.7%), indicating that the cut-off is internally consistent and does not appear to be overfit to the study sample. Taken together, these findings show that the A/C ratio at the 60% cut-off provides useful discriminatory value, particularly due to its relatively high sensitivity and solid predictive values. This threshold appears appropriate for clinical decision-making in the assessment of symptomatic adenoid hypertrophy.

Receiver operating characteristic curve of the adenoid-to-choanae (A/C) ratio for differentiating AH asymptomatic and AH symptomatic children. AH, adenoid hypertrophy.
Diagnostic Value of A/C Ratio for Diagnosis of Symptomatic Adenoid Hypertrophy.
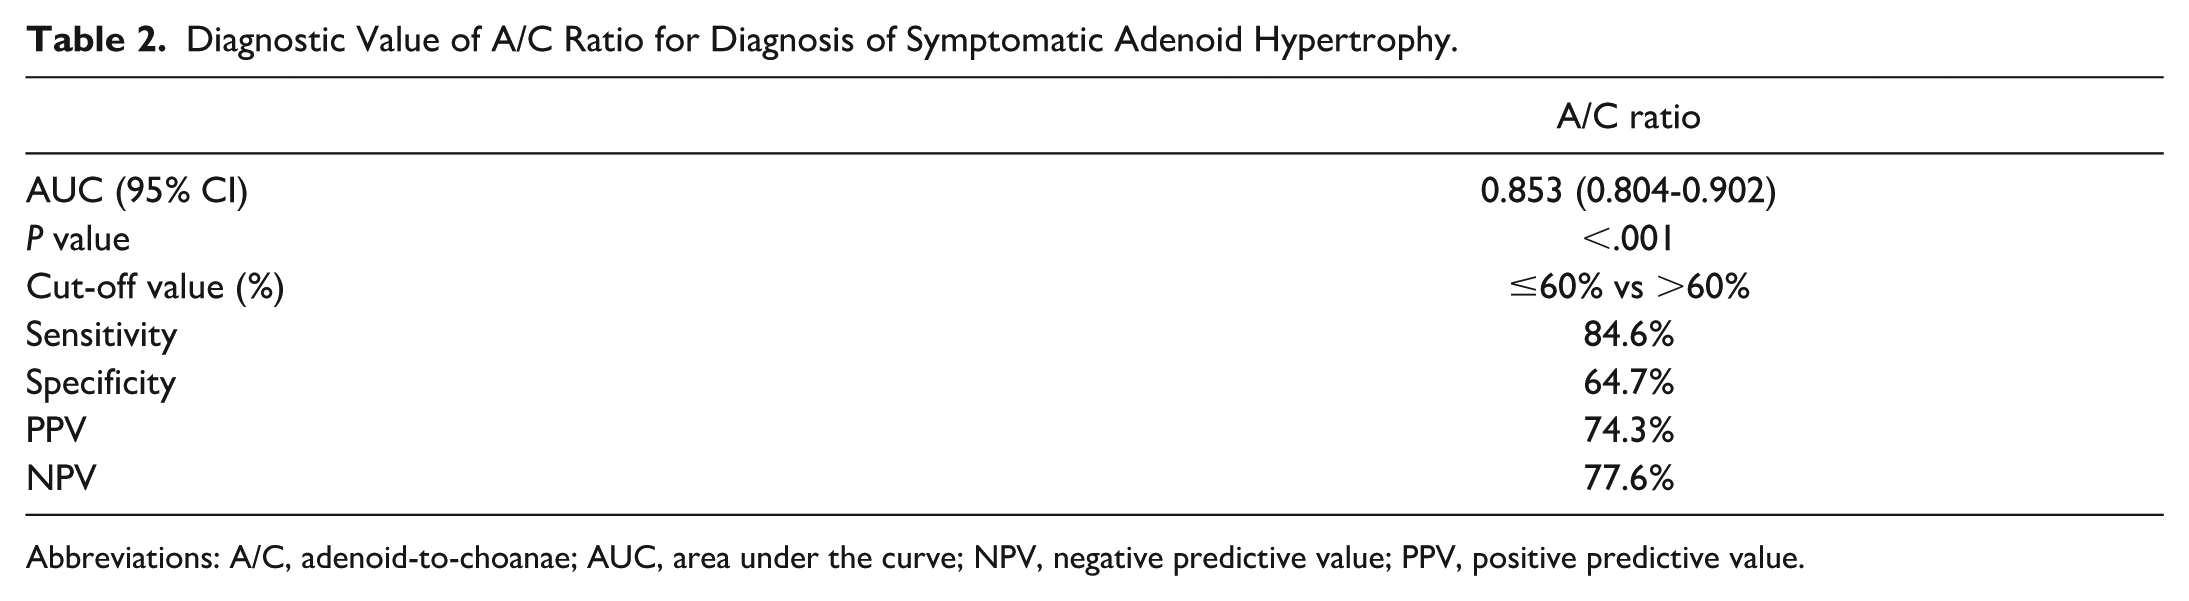
Abbreviations: A/C, adenoid-to-choanae; AUC, area under the curve; NPV, negative predictive value; PPV, positive predictive value.
Adenoid size (A/C ratio) provided the greatest discrimination between symptomatic and asymptomatic children. Therefore, both analyzed groups of patients—without adenoid symptoms and symptomatic—were divided into subgroups taking into account A/C ≤60% or above. A strong statistically significant difference was observed between the groups differing in the presence of adenoid hypertrophy symptoms (Table 3). Accordingly, A/C ratios ≤60% were predominantly observed in asymptomatic children, whereas ratios >60% were associated with symptomatology. Dichotomizing the A/C ratio at this threshold and including significant univariable predictors in a multivariable logistic regression model demonstrated that an A/C ratio >60% was the only independent predictor of symptomatic adenoid hypertrophy (Table 4).
A/C Ratio Distribution Stratified by 60% Cut-Off in the Study Groups.
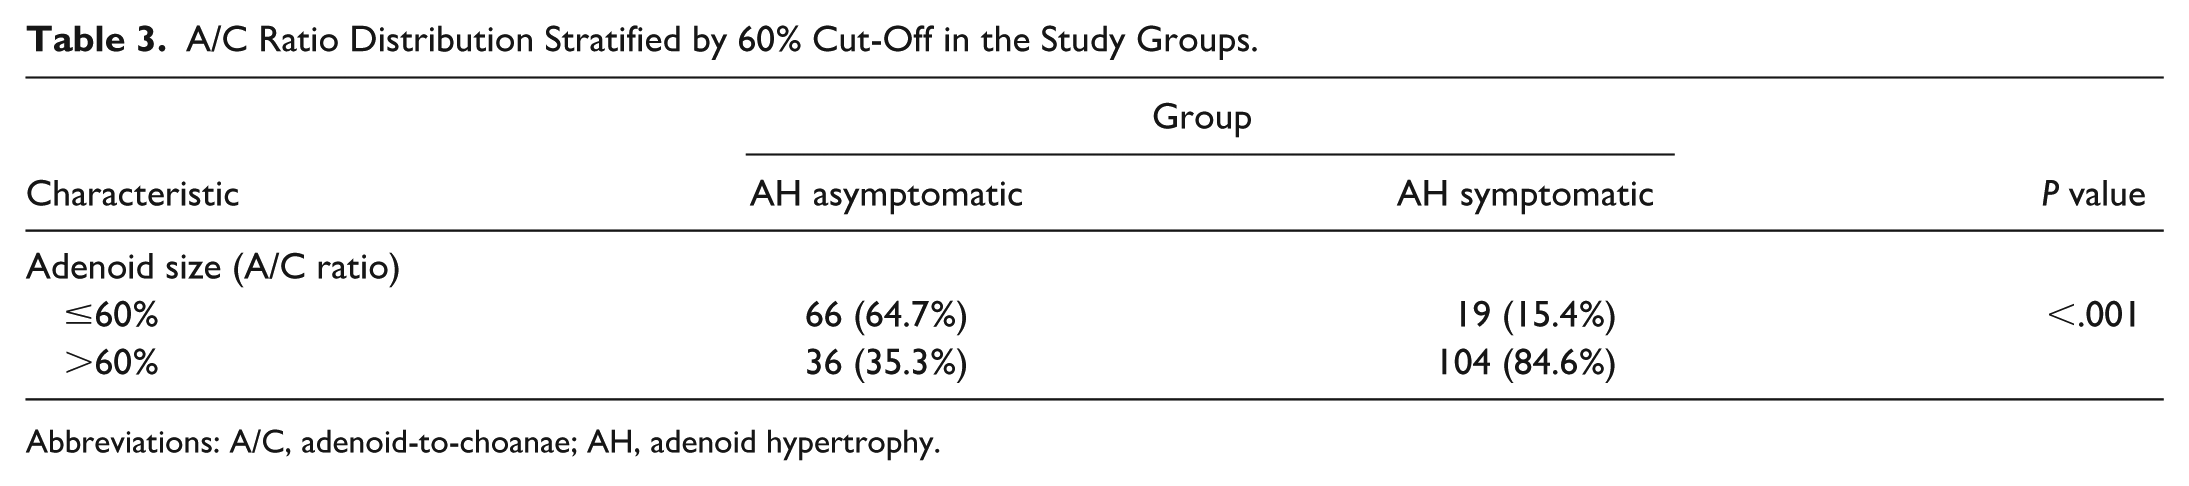
Abbreviations: A/C, adenoid-to-choanae; AH, adenoid hypertrophy.
Logistic Regression Analysis of Factors Predicting Adenoid-Related Symptoms (Symptomatic Adenoid Hypertrophy) in Children Aged 3 to 7 years.

Abbreviations: A/C, adenoid-to-choanae; MASNA, Mucus on Adenoid Scale by Nasopharyngoscopy Assessment.
Following the logistic regression analysis, which identified the A/C ratio as the only variable significantly associated with the presence of adenoid hypertrophy–related symptoms, we further examined this association using a continuous modeling approach. Penalized logistic regression confirmed a strong positive association between the A/C ratio and symptom occurrence (OR = 1.105 per unit increase in A/C ratio; 95% CI: 1.074-1.137; P < .001).
Figure 2 illustrates the continuous relationship between the A/C ratio and the probability of adenoid hypertrophy–related symptoms (Figure 2). The model demonstrates a monotonic and nonlinear increase in symptom probability with increasing A/C values, characterized by a low probability at lower A/C ratios, a steep rise in the mid-range, and a plateau at higher values.

Association between the A/C ratio and the probability of adenoid hypertrophy symptoms. A/C, adenoid-to-choanae.
In particular, the probability of symptoms rises most rapidly between approximately A/C ratio = 50% and 75%, indicating a transition zone where small increases in A/C ratio are associated with a substantial increase in symptom risk. As shown in Figure 2, an A/C ratio of approximately 60% corresponds to a predicted symptom probability of about 40%, indicating that this commonly used cut-off lies within the transition zone of rapidly increasing risk rather than at a high-risk threshold.
Finally, the entire cohort of analyzed patients was divided into 2 groups based on the A/C ratio (≤60% vs >60%). This analysis confirmed significant differences between the groups in terms of the occurrence of adenoid-related symptoms, as well as adenoid mucosal coverage on the MASNA scale and tympanogram findings. However, no significant difference was observed in the duration of rhinitis between the 2 groups (Table 5).
Relationship Between A/C Ratio Categories (≤60% and >60%) and Clinical/Demographic Characteristics.
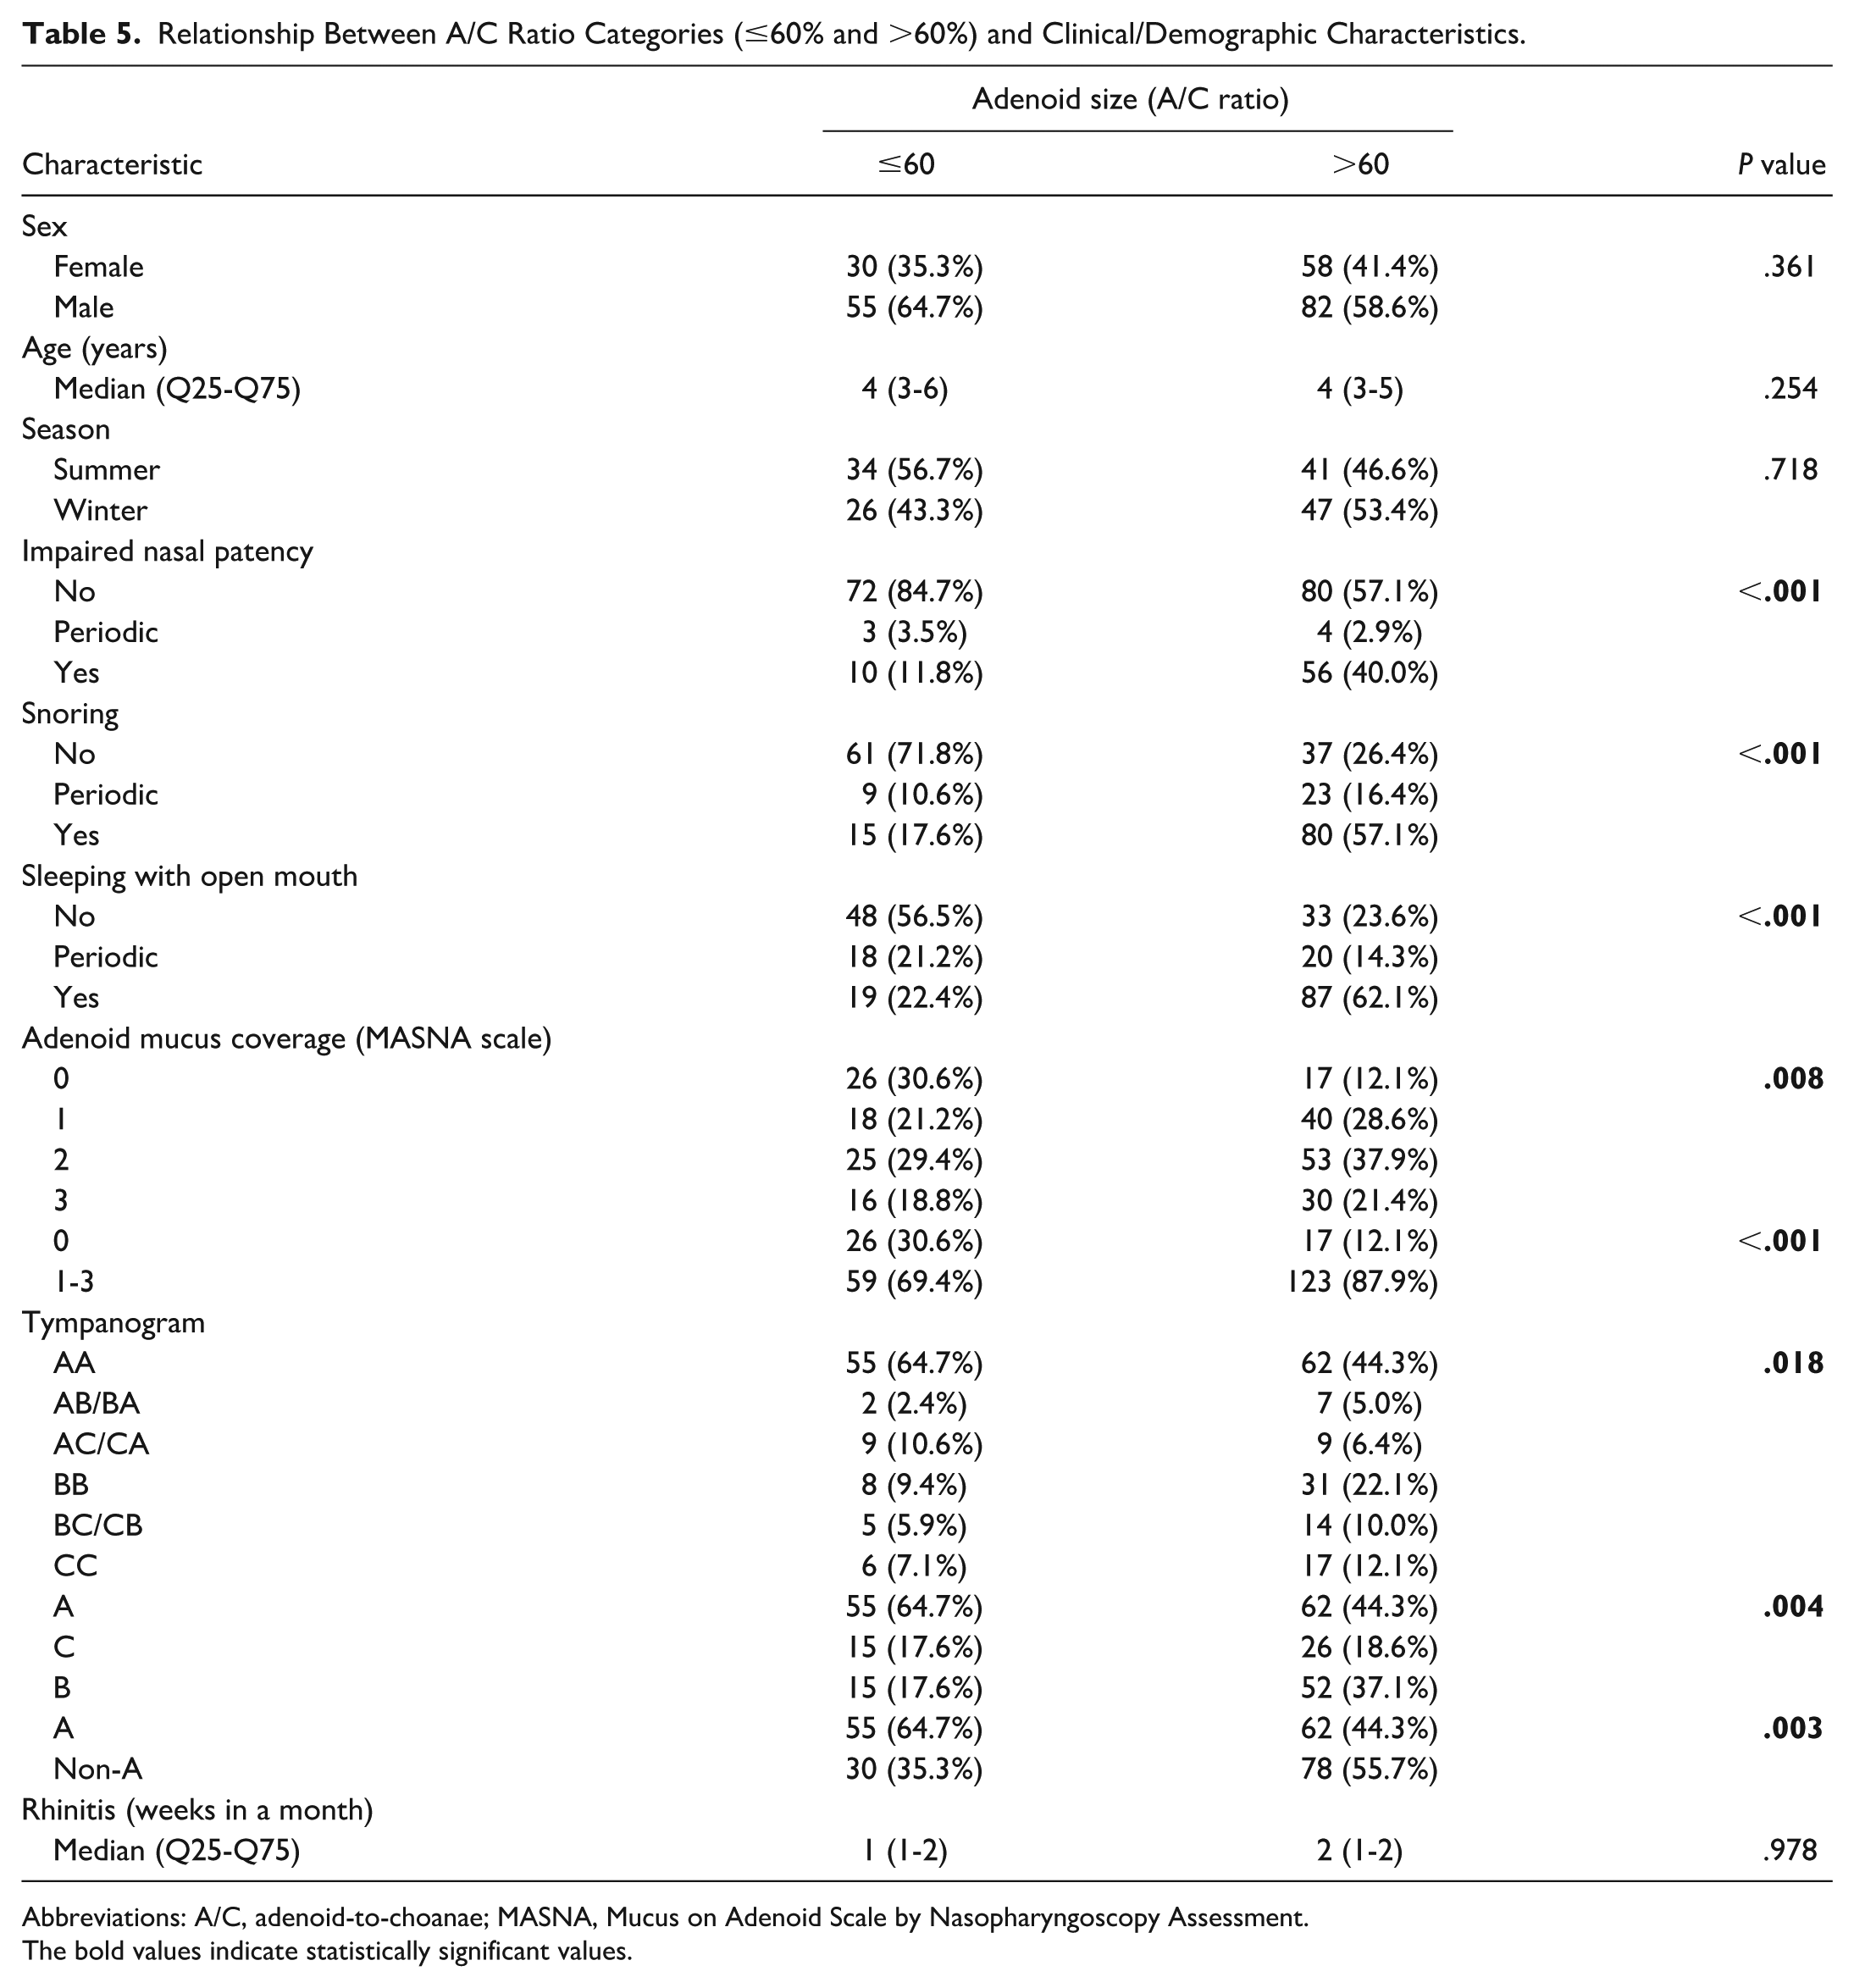
Abbreviations: A/C, adenoid-to-choanae; MASNA, Mucus on Adenoid Scale by Nasopharyngoscopy Assessment.
The bold values indicate statistically significant values.
Discussion
Flexible nasopharyngoscopy is the diagnostic standard for visual assessment of the adenoid in children, enabling evaluation of size, anatomical relationships, mucosal state, and signs of inflammation. 9 Nevertheless, endoscopic assessment is operator-dependent and requires experience, appropriate endoscope handling, and minimal patient cooperation to achieve relaxation of the soft palate; video recording and blinded review can improve reproducibility and interobserver consistency.
Although multiple endoscopic grading systems are available, evidence defining the A/C ratio considered normal for preschool children remains limited, as does consensus on thresholds distinguishing conservative from surgical management. Clinicians often regard postoperative adenoid remnants occupying up to approximately 30% of the choanal space as clinically insignificant, yet the definition of clinically significant adenoid regrowth varies widely across studies.
For example, Kim et al defined adenoid regrowth radiographically as an increase of more than one grade on a categorical scale 1 year after adenoidectomy compared with 1 month postoperatively, with each grade representing 25% increments. This implies clinically appreciable regrowth when adenoid tissue occupies approximately 55% or more of the nasopharyngeal space. 22 Hua et al used an adenoid-to-nasopharynx (A/N) ratio greater than 0.6 to define regrowth and corroborated radiological findings with endoscopic evaluation to exclude hypertrophy of the torus tubarius. 23 Buchinsky et al reported that a 50% nasopharyngeal obstruction observed via flexible endoscopy was the minimal proportion associated with obstructive symptoms. 24 This cut-off has been supported by other studies demonstrating that symptoms typically occur only when obstruction reaches or exceeds 50%.25 -27
Demain et al observed significant reductions in adenoid-related symptoms following a decrease in the adenoid-to-choanae ratio from 0.9 to 0.6 after intranasal steroid therapy. 28 In experimental modeling, Di Martino et al determined that a critical threshold for nasopharyngeal obstruction occurred when the A/C ratio exceeded 60%, whereas values up to 50% had no significant effect on nasal resistance. 29 Similarly, Havas and Lowinger defined “significant obstruction” as an A/C ratio of 60% or greater. 30 These findings are consistent with our observation that an A/C ratio of up to 60% is generally not associated with clinical symptoms of adenoid hypertrophy in preschool children and may therefore be considered within the normal range for this age group.
Accordingly, we believe that the proportional classification of adenoid size in increments of 25% or 33%, as proposed in earlier grading systems, does not accurately reflect the clinical condition.11,16 Endoscopic assessments that consider the anatomical orientation of the adenoid relative to adjacent structures, such as the pharyngeal orifice of the Eustachian tube, may be useful primarily for evaluating the adenoid’s influence on recurrent acute otitis media, chronic otitis media with effusion (COME), or hearing loss. However, even in such cases, assessment of the mucosal coverage of the adenoid appears more informative than its precise anatomical localization. For this reason, we developed a four-point MASNA, described in our previous publications.12,17,19
Based on both our findings and those reported in the literature, the degree of nasopharyngeal obstruction caused by the adenoid appears to be the most clinically relevant parameter for evaluating symptoms of adenoid hypertrophy, such as impaired nasal breathing, snoring, or mouth breathing during sleep.22 -30
In previous works, we reported that children with adenoid symptoms and suspected adenoid hypertrophy had a baseline mean A/C ratio of 71.6%, and when they received the proposed maximal medical treatment schema, they demonstrated a mean reduction in adenoid size of 8.4%, whereas children who did not respond had a higher baseline mean A/C ratio (79.4%). 31 We have also observed in another study that an endoscopic A/C ratio of ≥75% correlates with substantial intraoperative adenoid size. 9
Diksha et al conducted an analysis of adenoid size in children using lateral radiographs of the nasopharynx and compared the findings to results from flexible nasopharyngoscopy. Although they could not establish a correlation between these 2 methods in assessing adenoid size, their study indicated that the number of tympanograms classified as type B and C was significantly higher in children with an adenoid-nasopharyngeal ratio (ANR) greater than 0.835 compared to those with a ratio below 0.835. Similarly, the results of pure-tone audiometry (PTA) revealed that the number of patients with an abnormal hearing profile was significantly greater when the ANR exceeded 0.835. 32 According to Major et al, the size of the adenoid is often overestimated in lateral cephalometry; thus, it should be assumed that the true baseline is slightly lower, corresponding to an A/C ratio of 80%. 33
Based on our data and prior experience, we propose a practical, three-tier endoscopic adenoid size scale for preschool children using the A/C ratio: (I) up to 60%—considered within the age-appropriate norm; (II) 65%-75%—adenoid hypertrophy for which conservative management (including intranasal corticosteroids and watchful waiting) may be appropriate; and (III) ≥80%—adenoid hypertrophy for which we suggest that surgical intervention ought to be considered (Figure 3). The MASNA mucus coverage score may provide adjunctive information in clinical decision-making and in the assessment of response to medical therapy.

Proposed classification of adenoid size. (A) Normal size up to 60% of A/C ratio. (B) Adenoid hypertrophy: pharmacological treatment recommended, size up to 75% of A/C ratio. (C) Adenoid hypertrophy: the size equal or more 80% of A/C ratio, surgery suggested. A/C, adenoid-to-choanae.
Comorbid conditions such as COME or recurrent acute otitis media (rAOM) must be considered when planning surgical management. In cases where tympanostomy tube insertion is indicated, concomitant adenoidectomy should be considered if the A/C ratio exceeds 60%; conversely, when the A/C ratio is ≤60%, isolated tympanostomy may be reasonable, and in the case of adenoid hypertrophy A/C ratio 80%, adenoidectomy should be strongly recommended. In this study, children with A/C ratios ≤60% were significantly less likely to have exhibited lower MASNA mucus scores, and more often had normal tympanograms—findings that suggest a lower risk of recurrent effusion after ventilation tube extrusion or removal. However, no clear agreement was observed between the analyzed groups—symptomatic versus asymptomatic and ≤60% versus >60%—regarding the duration of rhinitis. On one hand, asymptomatic patients experienced rhinitis less frequently, while on the other hand, when considering a different grouping based solely on adenoid size (≤60% vs >60%), the frequency of rhinitis was similar (see Tables 1 and 5). Therefore, it appears that the occurrence of rhinitis is not dependent on adenoid size. In addition, its presence may contribute to an increased frequency of parents reporting adenoid-related symptoms.
Limitations
Limitations of the study include its retrospective design and reliance on parental report for symptom classification, which may be subject to recall or reporting bias. Although blinded video assessment mitigates some interobserver variability, endoscopic grading nevertheless retains an element of subjectivity. Prospective validation of the proposed A/C thresholds in independent cohorts and across multiple centers would strengthen generalizability and inform guideline development. A further limitation is the simplified categorization of tympanometric findings, which may obscure potential left–right asymmetries. Bilateral modeling was not feasible in the present study because several tympanometric combinations occurred infrequently, leading to statistically unstable estimates. Future studies with larger samples should address bilateral tympanometric patterns in greater detail.
Conclusion
We propose a three-tier clinically practical adenoid size scale (C-PASS) for preschool children based on the A/C ratio: Degree I (norm), A/C ≤60%; Degree II (hypertrophy amenable to conservative management or observation), A/C 65%-75%; and Degree III (hypertrophy generally indicating surgical consideration), A/C ≥80%. In the presence of comorbid COME or rAOM requiring surgical management, concomitant adenoidectomy should be considered when the A/C ratio exceeds 60% and strongly recommended when A/C ≥80%. The MASNA mucus coverage scale may serve as a useful adjunct in clinical assessment and in monitoring response to medical therapy.
Footnotes
Author Contributions
Conceptualization, A.Z. and K.D.; methodology, A.Z., K.D.; software, K.D.; validation, A.Z., K.D.; formal analysis, A.Z., K.D.; investigation, A.Z., K.M.; resources, A.Z.; data curation, A.Z., K.M.; writing—original draft preparation, A.Z., K.D., K.M.; writing—review and editing, A.Z., K.D.; visualization, A.Z.; supervision, P.B.; project administration, A.Z.; All authors have read and agreed to the published version of the manuscript.
Declaration of Conflicting Interests
The authors declared no potential conflicts of interest with respect to the research, authorship, and/or publication of this article.
Funding
The authors received no financial support for the research, authorship, and/or publication of this article.
Institutional Review Board Statement
Ethical approval for this study was obtained from the ethics committee of Nicolaus Copernicus University (KEWL21/2025).
Informed Consent Statement
Informed consent was obtained from all subjects involved in the study.
Data Availability Statement
Additional data supporting reported results may be available upon request.