
Abstract
Objective
To study whether the ability to detect frequency changes or temporal gaps at the early phase postactivation can predict speech perception performance at the late phase postactivation in postlingually deafened cochlear implant (CI) users.
Method
Psychophysical tests and event-related potential (ERP) tests were conducted at the third-month postactivation (early phase postactivation, T1) and after 1-year postactivation (late phase postactivation, T2) in 27 postlingually deafened CI users. CI hearing thresholds and speech perception performance were measured at T1 and T2. The frequency change detection threshold (FCDT) and gap detection threshold (GDT) were obtained through psychophysical tests. The evoked threshold, amplitude, and latency of auditory change complex response, evoked by frequency change or temporal gap stimuli, were investigated using ERP tests.
Results
Compared with T1, speech perception performance was significantly better at T2, but there was no significant difference in the psychophysical or ERP test results. Speech perception performance at T2 could be predicted by GDT at T1, but not by FCDT or ERP indicators at T1. Receiver-operating characteristic curve analysis suggested that the GDT at T1 may be moderately accurate in discriminating between good and poor speech perception groups at T2.
Conclusion
Compared to early phase postactivation, CI users’ ability to detect frequency changes or temporal gaps did not change significantly at the late phase postactivation, but speech perception performance improved significantly. The early GDT can predict later speech perception performance of CI users.
Level of Evidence
III.

Introduction
Despite improvements in speech recognition, significant variability in performance among cochlear implant (CI) recipients persists. This variability underscores the need for predictive indicators of CI outcomes.
Many studies have investigated the correlation between CI performance and other factors, such as auditory discrimination,1-4 visual and auditory cortex reorganization or cross-modal plasticity,5-7 cerebral blood flow and vessel conditions, 8 and cognition or working memory.4,9 However, most of these studies are cross-sectional and cannot predict the long-term CI outcomes before or early after CI use. If long-term speech perception performance after cochlear implantation can be predicted before surgery or at early stage postactivation, CI users who are likely to benefit less from CI can be identified as early as possible, based on which, realistic clinical expectations and rehabilitation strategies can be established.
Some studies have attempted to predict postoperative speech perception using some indicators before or after surgery. These factors included the duration of deafness prior to implantation, 10 functional near-infrared spectroscopy (fNIRS) measures of cross-modal activation obtained preoperatively, 11 promontory electrocochleography total response (ECochG-TR) measured during CI operation, 12 angular insertion depth and array design, 13 and noncoding ribose nucleic acid expression profiles. 14 However, these studies did not achieve sufficient predictive efficacy, indicating that it is still necessary to integrate other data to improve prediction ability.
Considering that understanding daily conversation depends on the auditory system’s ability to detect ongoing changes in the spectral and temporal patterns of the incoming signals, 15 it is possible to predict late speech perception by auditory frequency resolution or time resolution acquired early postactivation. Although cross-sectional studies have examined the correlation between CI speech perception and frequency resolution16,17 or time resolution,4,18-20 a gap remains in understanding whether early auditory discrimination abilities can predict late speech perception in CI users. This study aims to fill this gap by examining the predictive value of early auditory frequency resolution or time resolution for later speech perception performance in CI users.
This study investigated the perceptual sensitivity to and cortical encoding of frequency change and temporal gap at early and late phases postactivation, respectively. The frequency change detection threshold (FCDT) and gap detection threshold (GDT) were measured by psychophysical tests. The FCDT examines the detection of minimal frequency change within stimuli that have embedded frequency changes. 16 The GDT is determined as the shortest silent interval (“gap”) between a pair of stimuli that the individual can detect (ie, the smallest gap that the participant consistently hears as 2 stimuli). 18 The acoustic change complexes (ACC), one type of cortical auditory evoked potentials (CAEPs), induced by frequency changes or temporal gaps, were collected in electroencephalogram (EEG) measures. The CAEPs can be elicited by stimulus onset (onset CAEP), stimulus offset (offset CAEP), and an acoustic change embedded in an ongoing stimulus (ACC), with similar waveform morphologies. 17 The ACC is elicited by stimulus change(s) that occur within an ongoing, long-duration stimulation. 21 The ACC provides evidence of discrimination capacity across various stimulus dimensions at the level of the auditory cortex. 21 By focusing on the ability to detect frequency changes or temporal gaps at the early phase postactivation, we seek to identify key indicators that could guide clinical interventions and enhance CI outcomes.
This study addresses the following questions: (1) Are there significant differences in auditory frequency resolution, auditory time resolution, and speech perception between the early and late phases postactivation? (2) Can late speech perception be predicted by early auditory resolution measured by either behavioral discrimination or CAEP responses?
Materials and Methods
Participants
Twenty-seven CI users (15 females and 12 males; 17-51 years old; 24 unilateral and 3 bilateral CI users) were recruited for this study. All 27 CI users had severe to profound deafness in both ears prior to cochlear implantation. They were tested 3 times, that is, at the third-month postactivation, at the sixth or ninth-month postactivation, and after 1-year postactivation. Data from 20 of these 27 subjects, collected at the sixth or ninth-month postactivation, have been used in our previous cross-sectional study. 20 The data of these 27 subjects at the third-month postactivation (early phase post-activation, T1) and after 1-year postactivation (late phase postactivation, T2) were used in this study. The side with better speech recognition was tested in bilateral CI users, whereas the other side was taken off, and the same side was tested at all test time points. For unilateral CI users with partial residual hearing (mainly below 250 Hz) in the nonimplanted ear, the nonimplanted ear was masked with an earplug to ensure it could not hear experimental stimuli. All participants were postlingually deafened and native Mandarin Chinese speakers with no history of neurological or psychological disorders. The demographic data of the participants are presented in Table 1.
Demographics of Cochlear Implant (CI) Users.

Abbreviation: LVAS, large vestibular aqueduct syndrome.
Note: Nurotron and Listent were 2 Chinese domestic cochlear implant brands.
This study was conducted in full compliance with the ethical standards of the Declaration of Helsinki. It was approved by the Medical Ethics Committee of Shandong Provincial ENT Hospital (No. XYK20210714), Shandong, China. Consent was obtained before participating in the study.
Stimuli
Stimuli were generated using Audacity software at a sample rate of 44.1 kHz and presented by the E-Prime program (Psychology Software Tools, Pittsburgh, PA, USA). Examples of the stimuli in this study are shown in Figure 1.
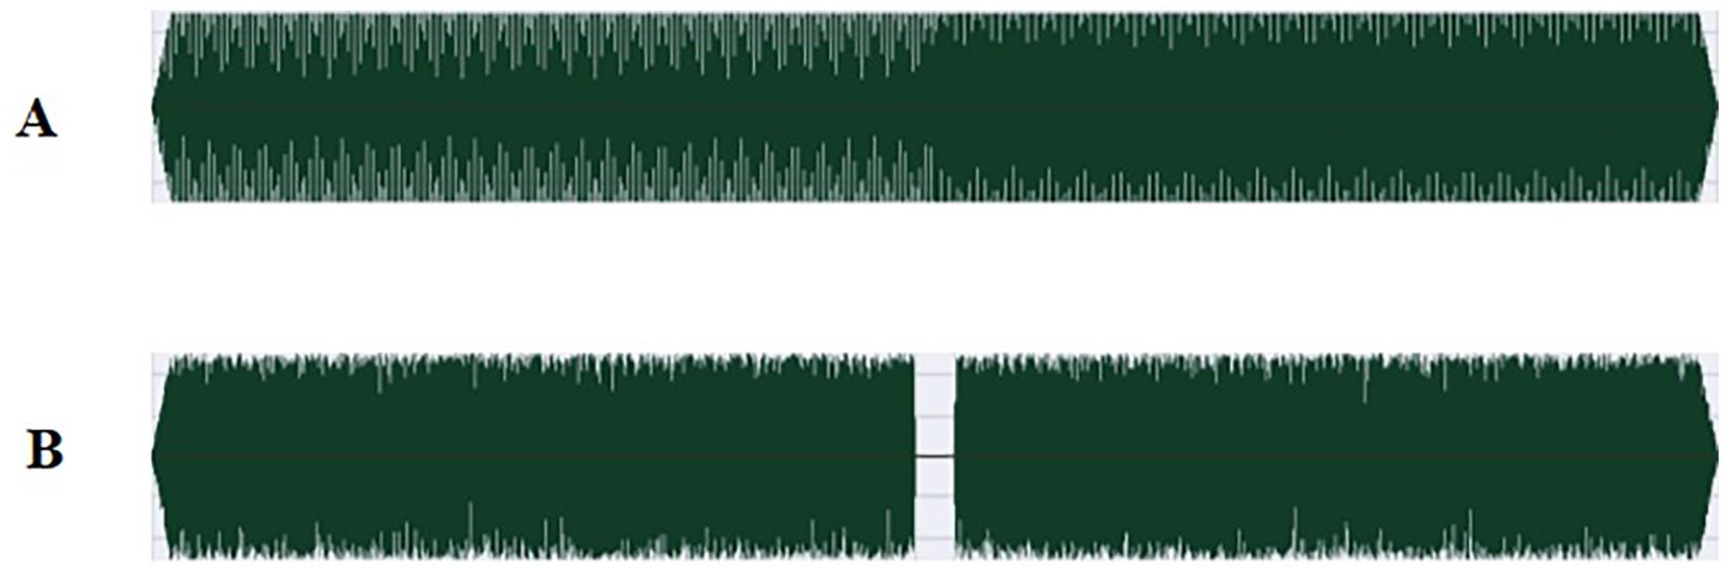
Examples of stimuli used in psychophysical tests and CAEPs tests. (A) There is a 20% increase in frequency in the middle of the pure tone. (B) There is a 20 ms silence gap in the middle of the white noise.
Details of the stimuli used in this study have been reported in our previous study. 20 Briefly, a series of tones of 800 ms duration (including 10-ms raised-cosine onset and offset ramps) at a base frequency (fbase) of 1 kHz that contained different magnitudes of upward F-changes at 400 ms after the tone onset were used in FCDT test and frequency change CAEPs test. White noise with different durations of silent gaps added in the middle position was used in GDT test and temporal gap CAEP tests. In the FCDT test, the range of frequency changes was 0.05% to 100%, and in the GDT test, the gap duration ranged from 1 to 100 ms. In event-related potential (ERP) tests, the stimuli used to induce the F-change CAEPs were tones at fbase of 1 kHz containing 6 different percentages of frequency increase (0%, 2%, 5%, 10%, 20%, and 50%), and the stimuli used to induce the temporal gap CAEPs were white noise with 6 different gap durations (0, 5, 10, 20, 50, and 100 ms). In the GDT test, the stimulus duration was fixed at 800 ms with the gap in the middle. In the temporal gap CAEPs test, the stimulus duration ranged from 800 to 900 ms, with the gap at 400 ms after noise onset.
Procedures
CI hearing threshold tests, speech perception tests, psychophysical tests, and ERP tests were conducted at T1 and T2, respectively. In the CI hearing threshold tests, warble tone thresholds at 0.25, 0.5, 1, 2, and 4 kHz were measured, and their mean was taken as the average hearing threshold. During psychophysical and ERP tests, sound stimuli were presented in a sound booth via a single loudspeaker placed at ear level, 1.5 m in front of the participant, and were presented at an intensity corresponding to loudness level 7 (most comfortable level) on a 0- to 10-point (inaudible to too loud) numerical scale to the tested CI ear. 17 In ERP tests, the participants were invited to watch a silent film with subtitles without paying attention to the sound stimuli, but were required to stay awake and quiet.
Speech Perception Tests
A computer-assisted Chinese speech audiometry platform was used to test speech perception. 22 During the speech perception tests, the subject was asked to repeat the speech sounds presented by a loudspeaker placed 45° in front of the side of CI, after which the tester needed to determine and mark whether the subject’s repetition was correct or not in the software. The intensity of speech sounds was set at 35 dB HL above the subjects’ CI average hearing threshold, but not higher than 75 dB HL. The recognition accuracy for disyllable words and sentences in a quiet environment was tested. The speech recognition threshold (SRT) in noise (the SNR required for 50% correct word-in-sentence recognition in multitalker, speech-babble noise) was only tested in 22 participants whose recognition accuracy of a sentence in quiet exceeded 50%.
Psychophysical Tests
The adaptive, 2-alternative forced-choice procedures, in which subjects needed to choose the sound that contained a frequency change or a temporal gap, were used to determine the FCDT and GDT. A 2-down, 1-up staircase technique was used to track the 70.7% correct point on the psychometric function. Each run generated 10 reversals, with the last 6 used to calculate the FCDT or GDT. The test was repeated thrice, and the average of the 3 results was considered the final FCDT or GDT. More detailed information can be found in our previous article. 20
Electroencephalographic Recordings and Data Processing
The Brain Vision Recorder (Version 1.22, Brain Products GmbH, Gilching, Germany) and a Brain Amp DC amplifier were used to collect EEG. As in our previous study, 20 in addition to the ground electrode, reference electrode, and EOG recording electrode, silver disk electrodes placed at FPz, Fz, Cz, C3, and C4 were used as recording electrodes according to the International 10-20 system. The electrode impedances were maintained at below 5 kΩ. The EEG was sampled at 5000 Hz.
EEG data were analyzed using Brain Vision Analyzer (v2.3, Brain Products GmbH). Filtering included a 35 Hz high cutoff and a 50 Hz notch filter, followed by ocular correction via independent component analysis. Data inspecting allowed a maximum voltage step of 50 μV/ms, a maximum difference of 200 μV, and a minimum activity of 0.5 μV from 200 ms pre- to postevent. After segmentation and baseline correction (100 ms pre-stimulus), artifact rejection was applied with amplitude limits of −120 to 120 μV. Artifact-free data were averaged according to different F-change or gap conditions. For each subject, at least 200 artifact-free sweeps were recorded for each stimulation condition.
According to the grand mean average, the time windows of ACC extended from 450 to 650 ms for F-change CAEPs and from 450 to 750 ms for temporal gap CAEPs, relative to the stimulus onset. Root mean squared (RMS) amplitudes within these time windows were calculated. The RMS amplitude of a baseline period (1800-1900 ms) was also computed to estimate the recording noise. The ACC was determined to be present only if (1) the RMS amplitude within the expected time windows was at least 50% larger than that of the recording noise; (2) there was a visually detectable ACC response based on the agreement between 2 judges.
Statistical Analysis
The frequency change ACC threshold and temporal gap ACC threshold were separately defined as the minimum frequency change and the shortest temporal gap in 6 change conditions described in the “Stimuli” section that could be reliably used to evoke ACC responses. Among the 6 stimulus conditions, the latency and amplitude of ACC evoked by 50% frequency change and 100 ms temporal gap at Fz were used for statistical analysis. The N1-P2 after a frequency change or a temporal gap was considered as an ACC response. The N1 potential was used to represent the ACC potential. The N1-P2 peak-to-peak amplitude was used to represent the amplitude of the ACC. Examples of a subject’s CAEPs at the third-month postactivation are shown in Figure 2.

CAEPs induced by frequency change (A) and temporal gap (B) of one subject (Sub 21) at the third-month postactivation. A distinct onset response (P1-N1-P2) induced by the presence of sound was seen in CAEP to all stimuli. The ACC appeared when the frequency changed above 2%, and the temporal gap was 20/50/100 ms. In this study, ACC was the response of concern, while onset response was not.
Paired sample T-tests or Wilcoxon signed-rank tests were used to examine whether there were differences between T1 and T2 in CI average hearing threshold, speech perception, psychophysical tests, and CAEP tests. Univariate analyses assessed the correlation between factors at T1 and speech perception at T2, where Pearson’s correlation was used for normally distributed variables and Spearman’s correlation for nonnormally distributed variables. Stepwise multiple regression was performed if multiple factors at T1 were significantly related to speech perception at T2. A P-value less than .05 was used to determine factor entry into the regression model. If a variable with a significant predictive effect was found, receiver-operating characteristic (ROC) curve analysis was performed to examine the clinical predictive potential of this variable.
Considering that the duration of deafness may play a significant role in predicting speech perception, 4 and the relationships between the aided hearing threshold and speech perception accuracy, 23 the duration of severe to profound deafness and the CI average hearing threshold were included in analyses in this study. The duration of severe to profound deafness was mainly based on patient reports.
Statistical analyses were performed using the SPSS version 23.0 software (IBM, Armonk, NY, USA).
Results
The Difference of Variables Between Early Phase Postactivation (T1) and Late Phase Postactivation (T2)
There was no significant difference in the CI average hearing threshold between T1 and T2 (P = .27). There was no significant difference in FCDT between T1 and T2 (P = .24), nor in GDT between T1 and T2 (P = .11). There was no significant difference in frequency change ACC thresholds between T1 and T2 (P = .62), nor in temporal gap ACC thresholds (P = .43), nor in latency or amplitude of ACC induced by frequency change or temporal gap. All 3 indices of speech perception at T2 were better than at T1 (P < .001). These results are shown in Table 2.
The Difference of Variables Between T1 and T2.

Abbreviations: CI, cochlear implant; SRT, speech recognition threshold; FCDT, frequency change detection threshold; GDT, gap detection threshold; ACC, acoustic change complexes.
Univariate Analysis
Univariate analyses were used to identify the associations between speech perception performance at T2 and the duration of severe to profound deafness or other variables at T1. The other variables at T1 included CI average hearing threshold, FCDT, GDT, frequency change ACC threshold, temporal gap ACC threshold, latency, and amplitude of ACC induced by frequency change or temporal gap. GDT and temporal gap ACC threshold at T1 had significant negative correlations with recognition rates of disyllable words in quiet at T2. GDT, temporal gap ACC threshold, and frequency change ACC amplitude at T1 significantly correlated with sentence recognition rate in quiet at T2. FCDT and GDT at T1 had significant positive correlations with SRT in noise at T2. The results are shown in Table 3.
The Associations Between Speech Perception Performance at T2 and Duration of Deafness or Variables at T1.

Abbreviations: CI, cochlear implant; SRT, speech recognition threshold; FCDT, frequency change detection threshold; GDT, gap detection threshold; ACC, acoustic change complexes.
P < .05. **P < .01. ***P < .001.
Stepwise Multiple Linear Regression Analysis
Based on univariate analysis, stepwise multiple linear regressions were performed to identify variables at T1 that had a significant and independent effect on predicting speech perception at T2. It should be noted that before regression analysis, only variables at T1 that were significantly associated with speech perception at T2 in univariate analysis were included as independent variables. In the model for disyllable word recognition in quiet at T2 as the dependent variable, only GDT at T1 was included in the model, excluding temporal gap ACC threshold. For sentence recognition rate in quiet at T2, only GDT at T1 was included, excluding temporal gap ACC threshold and frequency change ACC amplitude. For SRT in noise at T2, only GDT at T1 was included, excluding FCDT. The results are shown in Table 4.
Multiple Stepwise Regression Analysis.

Abbreviations: CI, cochlear implant; SRT, speech recognition threshold; FCDT, frequency change detection threshold; GDT, gap detection threshold.
Based on univariate and multiple regression analyses, it was generally found that GDT at T1 had an independent and significant predictive effect on speech perception at T2.
ROC Curve Analysis
To further investigate the clinical potential of GDT, ROC curve analysis was used to assess the quality of speech perception prediction by the GDT test. ROC analysis was performed 3 times, respectively, according to the recognition rates of disyllable words and sentences in quiet and SRT in noise, in which subjects were divided into a good or poor group according to the median of their speech perception results at T2. The medians of disyllable words in quiet, sentences in quiet, and SRT in noise were 56%, 74%, and 13.77 dB, respectively. The results of ROC curve analysis are shown in Figure 3 and Table 5. The results suggested that the GDT result may be moderately accurate when discriminating between the good and poor groups. Subjects with GDT values below the cutoff values in Table 5 are more likely to achieve better speech perception; those above these values are not.

ROC curves were plotted, respectively, for disyllable words in quiet prediction, sentences in quiet prediction, and SRT in noise prediction using GDT.
Results of ROC Curve Analysis.

Abbreviations: ROC, receiver-operating characteristic; SRT, speech recognition threshold; GDT, gap detection threshold.
Discussion
The Difference of Variables Between Early Phase Postactivation (T1) and Late Phase Postactivation (T2)
This study found no significant difference between T1 and T2 in the results of psychophysical tests or CAEP tests, whether in terms of frequency resolution or time resolution, suggesting that postlingually deaf CI users’ auditory discrimination can recover to a stable level within a short period postactivation. This finding is consistent with previous studies that reported rapid improvement in subjective auditory frequency discrimination, 24 in objective measures of auditory discrimination, 25 and in cortical activity measured by positron emission tomography during story listening. 26
Even though there was no significant difference in auditory discrimination between early and late phase postactivation, a notable improvement in speech perception was observed over time in this study. In a systematic review, speech recognition scores continued to increase from 3 to 12 months after CI activation. 27 This difference in the rate of improvement may be due to that auditory discrimination is the basic processing ability of the auditory system, which can be quickly restored in a short period, whereas speech recognition is a more complex process that involves higher-level cognitive functions, such as working memory,4,9 and therefore, takes longer to recover to a stable level.
Prediction of Late Speech Perception Using Early Auditory Discrimination Factors
Considering that some CI users may take longer to reach an acceptable CI hearing threshold, to ensure the audibility of auditory stimuli during the tests, auditory discrimination tests at too early postactivation may not be appropriate. On the other hand, the auditory resolution of CI users changes rapidly within 3 months after CI use.24,25 However, it is uncertain whether the development of different individuals during this period is same, and at which point, the data are most suitable for predictive studies. For these reasons, the relatively early and stable data at third-month postactivation were used to make predictions in this study.
This study confirmed the predictive effect of GDT on late speech perception. The auditory system uses temporal cues, such as the duration of speech segments and silent intervals between speech segments, to differentiate various speech sounds. 28 Current CIs mainly use an envelope-based speech-processing strategy to encode time-varying amplitudes in several frequency bands.29,30 The temporal resolution (ie, the ability to follow rapid changes in the time waveform) is critical for speech recognition in CI users. 31
Due to the limited number of electrodes, 17 channel interactions,32,33 frequency-to-place mismatch, 34 and signal processing (eg, signal compression, bandpass filtering, and temporal envelope extraction), 20 CI can only provide very limited spectral information. The degraded spectral information provided by CI may explain why early FCDT fails to predict late speech perception.
Although the temporal gap ACC threshold at T1 was significantly correlated with disyllable words and sentences in quiet at T2 in univariate analysis, it was removed in stepwise multiple regression analysis, leaving only GDT at T1. This suggests that the CAEP adds no predictive value for late speech perception of CI once psychophysical test results are available. However, for CI users whose psychophysical test results are unavailable, such as children, the CAEP indicator of time resolution may still have some predictive value, warranting further research.
In this study, the early time resolution obtained by the psychophysical test helps predict the late speech perception of CI users, which is of great significance in practice. If people with poor time resolution are screened out at the early phase postactivation, additional intervention or training can be performed, which may improve their speech perception at the late phase postactivation.
Limitations and Future Studies
The testing of ACC thresholds in this study was only an approximate estimate of the actual ACC threshold and may need to be more precise. Future research can use an adaptive program and real-time data analysis to calculate the exact threshold of ACC response. 35
Most of the subjects in this study, 20 out of 27 to be exact, used Chinese brands of CIs and may not be well representative of CI brands in other countries. Additionally, since Mandarin is a tonal language, it is uncertain whether these conclusions apply to nontonal native speakers.
The third month after activation may have missed a critical period for rapid adaptation in the auditory cortex. Future studies may consider testing CI users at different points within 3 months after CI use to determine whether earlier data are better predictors of late speech perception.
Future research can study different groups of subjects, collect data at different points within 3 months postactivation, and change experimental design or data analysis methods to explore the potential predictive ability of early CAEPs for late speech perception.
Conclusion
The ability to detect frequency change or temporal gap in CI users does not show significant alteration between the early phase postactivation and the late phase postactivation. However, a notable improvement in speech perception performance was observed over time. Crucially, early temporal discrimination ability, such as GDT, can predict later speech perception performance. For CI users, poor GDT at the early stage postactivation may suggest a higher risk of poor speech recognition at a later stage, so additional interventions or training may need to be provided to prevent this.
Footnotes
Acknowledgements
We want to thank all participants for their participation in this study.
Data Availability Statement
The raw data supporting the conclusions of this study will be made available by the authors upon reasonable request.
Declaration of Conflicting Interests
The author(s) declared no potential conflicts of interest with respect to the research, authorship, and/or publication of this article.
Funding
The author(s) disclosed receipt of the following financial support for the research, authorship, and/or publication of this article: The National Key Research and Development Project of China (2022YFC2703602), the National Natural Science Foundation of China (Nos. 82271172, 82071053), the Major Program of National Natural Science Foundation of China (No. 82192861), the Major Fundamental Research Program of Natural Science Foundation of Shandong Province, China (No. ZR2021ZD40), the Taishan Scholars Program of Shandong Province-Youth Scholar Program (No. tsqn202211357), the Horizontal Project of Shandong University (No. 6010420001), and the Medical Health Science and Technology Project of Shandong Province (No. 202307010345).