
Abstract
Introduction
Vestibular migraine (VM), particularly its chronic variant, poses a diagnostic challenge. Patients suffering from VM may not have the characteristic headaches associated with the dizziness. In these cases, a marker for migraine pathology in general could help appropriately diagnose certain types of dizziness as migrainous despite these patients not meeting current diagnostic criteria for VM. Migraine patients in general (headache and vestibular) are known to share a tendency toward intolerance of certain stimuli, including busy visual stimuli. True optokinetic stimulation, measured by the production of optokinetic after-nystagmus (OKAN) simulates these busy visual stimuli.
Methods
Prospective observational study comparing response to optokinetic stimulation between migraine patients and controls. Questionnaires regarding general sensitivities to busy visual stimuli were completed prior to beginning the study. Both subjective and objective markers of stress were measured before and after exposure to the stimulus. Initial slow-phase velocity, slow cumulative eye position, and adjusted time constant of OKAN were compared between the 2 groups.
Results
The groups differed only with regard to sensitivity to blinking lights and history of motion sickness on initial questionnaire. Regarding subjective symptoms of discomfort, migraine patients tended to report higher scores than controls both before and after testing, but there was no significant difference from before to after stimulus in each group’s scores. There were no statistically-significant differences between initial slow-phase velocity, slow cumulative eye position, and adjusted time constant of OKAN between groups.
Conclusions
In this study, OKAN measurements were not useful in differentiating migraine patients at large from control subjects. We hypothesize that there may be a distinct subgroup of migraine patients that are more sensitive to visually-disturbing situations that may differ from other migraine sufferers. Future studies will aim to identify such patients and compare them to controls.

Keywords
Introduction/Background
Migraine headaches are very common, affecting 1 out of every 7 Americans 1 and an estimated 8.3% of Canadians. 2 Despite its high prevalence, however, migraine pathophysiology remains poorly understood. In addition to the typical headache with or without aura, migraine sufferers tend to share other phenotypic features such as a propensity for motion sickness when compared to their non-migraine counterparts (50% vs 20%) 3 as well as a sensitivity to various visual stimuli. For example, migraine sufferers report more nausea from optokinetic-type stimuli in their day-to-day life (eg, movies on a large screen and looking at movement simulators) than do controls.4,5
Despite these subjective discomforts, no objective markers to validate this migrainous phenotype exists in the literature to date. Some attempts have been made to try and demonstrate migraine sufferers’ different reactions to certain visual stimuli, notably with optokinetic stimulation from the videonystagmography (VNG) battery, 6 with few significant results. Optokinetic after-nystagmus (OKAN), however, may be more sensitive for the detection of central and peripheral vestibular dysfunction than optokinetic stimulation itself. 7 In order to elicit OKAN, a full-field rotating visual stimulus is required, such as a rotating drum, but is not generally included as part of the standard VNG battery. OKAN, achieved only if a true optokinetic stimulation is achieved, is the nystagmus that follows optokinetic nystagmus (OKN). It is seen upon the rapid removal of all visual stimuli, by inducing total darkness, after optokinetic stimulation. The nystagmus in OKAN is expected to be in the same direction as the preceding OKN with a reduced slow-phase velocity. OKAN is thought to represent the functioning of the central velocity storage integrator in the brainstem, which may be part of the pathway mediating migraine sufferer’s subjective discomfort following visual motion stimuli. 8
Migraine sufferers are also more than 10 times as likely to suffer from vertigo than their non-migraine counterparts. 9 Migraine headache diagnostic criteria are clear and widely accepted. In 2012, the Barany and International Headache Society published diagnostic criteria for episodic vestibular migraine (VM). Consensus around the diagnosis of chronic migraine-related dizziness, or chronic VM, however is lacking. Despite this lack of consensus, more and more patients seen in neuro-otology vertigo clinics are being diagnosed with migraine-associated vertigo based on the coexistence of dizziness in a patient with other migraine phenotype symptoms, despite not meeting criteria for episodic VM. Vertigo symptoms in this population can be quite variable in quality and intensity, often resulting in significant morbidity in a patient population slipping between the cracks of our current accepted diagnostic criteria for different types of vertigo. 10
Thus, patients with VM, or migraine-related dizziness, are considered to be migrainers at baseline, although they may not meet the accepted diagnostic criteria for migraine headache and thus VM at the time of presentation for dizziness evaluation. One of the shared non-headache, non-dizzy symptoms among these patients, as elaborated above, is their subjective discomfort when exposed to moving visual stimuli. We thus hypothesized that if we could identify a quantifiable abnormal response of patients with classic migraine headache to busy visual stimuli, then this may service as a diagnostic marker to help identify patients suffering from migraine-related pathology, namely, dizziness, but who do not fall within the currently-accepted migraine-related dizziness diagnostic criteria.
Given that the visual scenes in everyday life that cause discomfort in these subjects (looking out the window on a moving train or seeing the environment move around them when they are motionless) can be reproduced with a full visual field optokinetic stimulus, we hypothesized that migraine sufferers would respond differently than control subjects to these stimuli.
The primary outcome of this study was to compare quantifiable OKAN values produced by a full visual field optokinetic drum between confirmed migraine sufferers and controls. The secondary outcomes were to compare the stress response to optokinetic stimulation between the 2 groups using both objective and subjective measures (salivary cortisol, pulse rate, blood pressure, and questionnaire, respectively).
Methods
A prospective observational study design was used. Migraine and control subjects were recruited and submitted to the same interventions, which were then compared between groups. Ethics approval form our institution’s ethics board was obtained for this study, and each subjective consented to participate in the study. Financial support for this study was obtained through a research grant provided by the Division of Surgery at the Université de Sherbrooke, Quebec, Canada.
Subject Recruitment
Migraine subjects
Migraine sufferers included in the study were either volunteers or patients recruited from our institution’s neurology clinic having a diagnosis of migraine headaches with or without aura according to the IHS criteria. 10 The diagnosis was verified by a neurologist at our institution.
Controls
Subjects with no prior history of migraine headaches were selected to make up the control group. These were voluntary participants recruited using advertisements displayed throughout our institution’s hospitals and affiliated university. Control subjects were also questioned by a neurologist to confirm that they truly did not suffer from migraine headaches that may have gone previously undiagnosed.
Exclusion factors for both groups were the following:
- History of neurological or otological disease, other than migraine
- History of significant head trauma (Glasgow coma scale <9)
- Functional blindness
No compensation was offered to participants in either group, and all subjects signed a consent form that was approved by the local ethics committee.
Testing
Each subject underwent 1 session of testing. The session consisted of the following elements, which are elaborated further below:
- Questionnaire
- Objective signs of stress
- Optokinetic testing
- Debriefing
Questionnaire
In order to measure subjective symptoms, each participant was asked to answer a questionnaire before and after testing, corresponding to T = 0 and T = 3 (Figure 1). The questionnaire was divided into 2 parts. The first part of the questionnaire was only completed once at baseline (T = 0) and was used to document the patients’ last alcoholic beverage, last meal, and subjective quality of sleep the night before testing, including whether or not the patient used any somniferous drugs in the preceding 24 hours. They were also asked to report whether they felt they suffered from motion sickness (either presently or in the past) and whether they felt discomfort in certain specified situations such as when watching 3D films, when standing still on a busy street corner, and watching traffic go by, when looking at flashing lights, and when walking down grocery store aisles in large stores.

Timeline of evaluation for each subject.
The second part of the questionnaire was filled at both T = 0 and T = 3 (after all testing complete). In this part of the questionnaire, subjects were asked to grade symptoms of nausea, dizziness, headache, flushing, sweating, and anxiety from 0 to 10, with 0 indicating none and 10 indicating severe.
Objective signs of stress
In an attempt to document physiologic signs of stress throughout the evaluation, subjects underwent serial blood pressure and pulse measurements as well as salivary cortisol measurements throughout the testing period (Figure 1).
Salivary cortisol levels were measured by having the subjects hold specifically-designed swabs (Salivette®; Starstedt, Inc, Montreal, Canada; Figure 2) in their mouth for 30 to 60 seconds. These swabs were then stored at 4°C until they were sent for analysis.
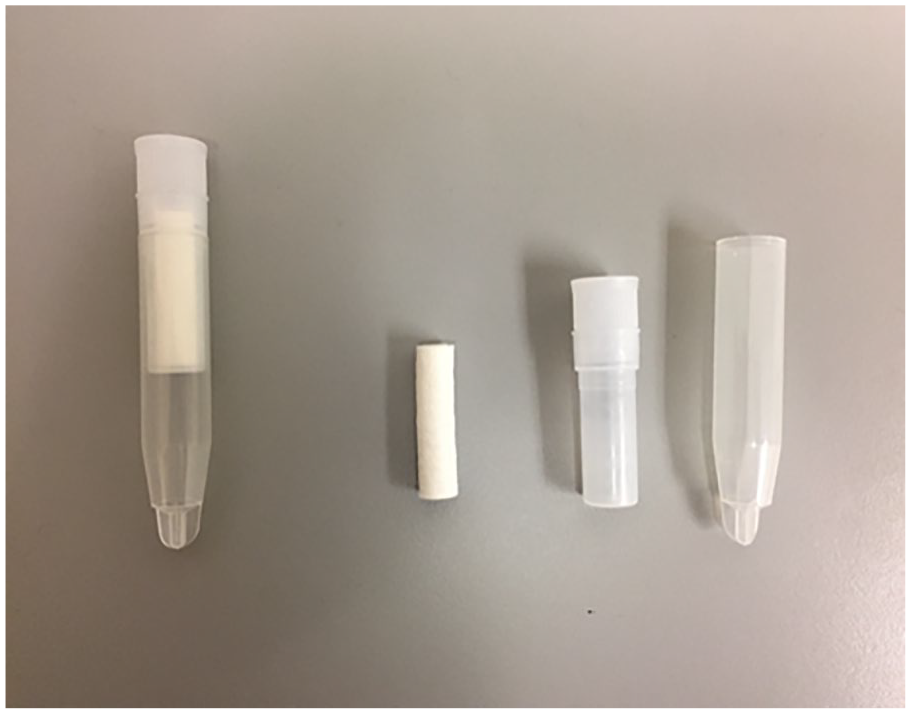
Salivette® from Starstedt, Inc, used to obtain saliva from subjects for salivary cortisol measurements.
Nystagmus monitoring and documentation
The Interacoustics™ V0425 VNG hardware and software normally used for VNG testing at our institution were used to monitor and document nystagmus throughout the testing period.
Optokinetic stimulation and OKAN data extraction
In preparation for this study, a rotating drum was designed by the researchers and manufactured by a local engineering firm (Lapalme Groupe Conception Mécanique, Varennes, Canada). The design was based off a similar model used by Tijssen et al. 11 The rotating drum had a diameter of 1.2 m with a pattern of vertical black and white lines printed on its inside. The drum hooks onto a steel stand on which the drum is rotated in either direction by an electrically-powered motor. Participants were seated inside of the drum and were asked to look at the lines as they passed in front of them. No further instructions were given during testing (Figure 3).

Apparatus designed and manufactured for OKN/OKAN stimulation for this study. (a) View of exterior setting with evaluator, VNG hardware, and rotating drum. (b) View inside of rotating drum with subject seated inside of drum. (c) Initial conception design. OKN, optokinetic nystagmus; OKAN, optokinetic after-nystagmus; VNG, videonystagmography.
OKAN testing and recording was conducted based on a sampling technique developed by Tijssen et al designed to limit the effect of intraindividual variability, which is known to be quite significant in OKAN.
Subjects were submitted to 2 sequences of optokinetic stimulation separated by a 5 minute pause (Figure 1). During each sequence, the drum was first rotated during 1 minute at a speed of 60°/second toward the left followed by an identical stimulus toward the right. During testing in each direction, lights were turned off for a few seconds at 12, 26, and 40 seconds to permit OKAN “sampling” and were then turned off for a full minute at the 60 second mark for additional OKAN measurements.
Three different measurements were extracted from the OKAN data for analysis4,5,11:
1. Initial slow-phase velocity for each direction was obtained by calculating the mean of nystagmus slow-phase velocity in the 2nd second of each “sampling” with the lights turned off, that is, at the 12, 26, 40, and 60 second mark. The slow-phase velocity of the first 2 seconds was omitted to avoid the effects of the transition from OKN to OKAN. A mean value for all initial velocities (16 values per subject) was calculated.
2. Slow cumulative eye position (SCEP) was obtained using numerical integration of the area under the curve of the slow-phase velocity for the first 30 seconds after the lights were turned off at the end of each OKAN sequence, that is, at the 60 second mark. Again, the 2 initial seconds of data was excluded to avoid sampling OKN. A mean value of the SCEPs for each direction was then calculated.
3. Adjusted time constant of nystagmus decay (Tc) was calculated using the following equation developed by Hain et al 12 :
Tc = −22.7 × ln[1.007−(Tc′/25.5)], where Tc = Time constant of decay and Tc′ = SCEP/initial slow-phase velocity
Statistical Analysis
All of the collected data were analyzed using SPSS 22 (BM, Armonk, NewYork, USA) with the help of our institution’s statistician. For the categorical data in the initial questionnaire, Fisher’s exact test was used. To compare continuous data between groups, both in the initial questionnaire and from OKAN testing, Mann-Whitney U test was used. The Wilcoxon test was used to compare continuous variables from the second part of the questionnaire between groups over time (pre- vs posttesting), but Friedman’s test was used to compare change in vital signs and salivary cortisol levels given that they were collected over more than 2 time points.
Results
Recruited Subjects
Ten subjects were recruited in the migraine group, 8 (80%) of whom were female, with an average age of 32.3 years (Table 1). For the control group, 14 subjects were recruited, 8 (57%) of whom were female, with an average age of 25.5 years. All subjects successfully completed the entire evaluation with a 0% dropout rate. Two posttest questionnaires in the control group, however, were incompletely filled out and were therefore excluded from further analysis, but only for the questionnaire portion of the study.
Initial Questionnaire Answers (T = 0).

Bold values represent results that are statistically significant (p < 0.05).
Questionnaire
Regarding specific triggers for discomfort in general, some subjects in each group reported discomfort with 3D films (20% for migraine subjects and 7.1% for controls), watching busy traffic go by (10% and 7.1%) and walking down a long grocery store aisle (0% and 7.1%); however, there was no statistically-significant difference found between groups for these factors. Exposure to blinking lights, however, was reported to cause discomfort statistically significantly more frequently in migraine subjects than controls (50% vs 7.1% respectively, P = .028). Additionally, migraine subjects were more likely than controls to have experienced motion sickness at some point in their lives (P = 0.010; Table 1).
In the migraine group, all symptoms evaluated in the second part of the questionnaire tended to be more intense (ie, given a higher score on 10) as compared to controls both before and after testing. Within the migraine group, only the intensity of subjective dizziness was significantly increased after testing as compared to before testing (an increase of 1.4 points, P = .026). All other symptoms remained relatively stable. The intensity of symptoms did not change before and after testing in the control group (Table 2).
Subjective Discomfort Scores.

P-value of before versus after values within the same group. All P-values for intergroup comparisons were not statistically significant (P > .05).
Bold values represent results that are statistically significant (p < 0.05).
Objective Signs of Stress
Results for pulse, blood pressure, and salivary cortisol measurements throughout the study for each group are summarized in Table 3. As noted, there were no significant variations in any measurement throughout testing for either group, nor were there any differences between groups.
Objective Stress Markers.

Optokinetic Stimulation
As expected, our full visual field optokinetic stimulus successfully induced nystagmus with slow phase in the direction of movement in each of our patients. When the lights were turned off, all subjects experienced OKAN in the same direction as the preceding OKN with a decelerating slow phase observed over the extended period of darkness at the end of each trial. OKAN measurement results detailed in Table 4, and, as indicated, there were no significant differences in these measurements between the migraine and control groups.
OKAN Measurements.

Abbreviations: OKAN, optokinetic after-nystagmus; Tc, adjusted time constant of nystagmus decay; Tc′, unadjusted time constant of nystagmus decay.
Of note, upon a detailed manual review of the 30 second OKAN data used for SCEP calculation, we observed that, although the OKAN did effectively decelerate progressively with time, it became less reliable toward the second half of the measurement period since the OKAN points became much more sparse and difficult to record, and there were significantly-more artifactual data points.
Discussion
By successfully eliciting OKAN in all tested subjects, we have demonstrated that the apparatus developed for this study can successfully produce a full visual field optokinetic stimulus that is adequate to induce measurable OKAN components, where an incomplete visual field normally fails. 13 Furthermore, our measurements are quite similar to the normal values obtained by Tijssen et al. For example, the unadjusted time constants of decay (Tc′) were comparable (14.5 ± 5.7 vs Tijssen’s 10.9 ± 3.9) and initial velocity values were almost exactly the same (10.8 ± 2.85 vs Tijssen’s 10.9 ± 3.9). The first challenge of this study was to successfully develop a model such as ours which, given its demonstrated ability to elicit OKAN in a controlled manner, could subsequently be used for further testing at our institution for both clinical and research purposes.
Migraine is a clinical disorder with no objective diagnostic test to date. Migraine-associated vertigo is becoming an increasingly-recognized and diagnosed phenomenon but is not yet fully understood. There is much overlap in the symptomatology of dizziness seen in the context of migraines when compared to other causes of dizziness, both otologic and non-otologic, frequently contributing to diagnostic challenges in the face of these presentations. An objective test capable of categorizing patients into a particular diagnostic group would be extremely helpful in the clinical setting. Based on the fact that migraine patients often feel subjective discomfort during the real-life situations that are mimicked by optokinetic stimulation, and with the knowledge that OKAN is considered particularly sensitive for central and peripheral vestibular dysfunction, the main hypothesis of this study was that there would be a difference in the measurements of OKAN between migraine patients and controls. However, in our study we did not find that any of the measured components of OKAN (initial velocity, SCEP, and Tc) varied between the 2 groups, suggesting that OKAN is not a useful tool for the identification of migraine patients, at least with the way we interpret its data at this time. Furthermore, with the small number of people included in this study, the possibility of a false-negative result should also be considered.
Interestingly, however, upon the review of the T = 0 questionnaire data in this study, we see that the migraine patients included in this study did not report significantly-more discomfort in the majority of real-life situations that have been reported to cause discomfort in such patients in the literature. This begs the question as to whether there may be subgroups of migraine patients with varying presentations of the visual intolerance phenotype often thought to coexist with the headaches. Perhaps selecting out those who have a more pronounced version of this phenotype would make for a better sampling population than our chosen one for this kind of study. Anecdotally, a large number of patients with non-otologic dizziness and a history of migraines also describe the phenomenon of discomfort in the visual situations questioned in this study in their everyday lives. Perhaps is this subset of migraine patients somewhat different from those who do not experience dizziness throughout their lifetime despite having a history of migraine headaches? Would repeating a similar study comparing migraine subjects who do describe suffering from this phenotype with controls (as opposed to any migraine patient overall) result in different outcomes?
With the above in mind, we performed a small pilot study, where this specific study methodology was applied to 3 patients with a diagnosis of migraine-associated vertigo (meeting diagnostic criteria) 10 and who had previously experienced discomfort in visual mismatch situations. Although the pilot subjects were not numerous (N = 3) enough to extract significant statistical data, a clear tendency was observed toward lower 10 second SCEP measurements in this group as compared to the group of controls in this study, with an average of 60 in this group as compared to 10 second SCEP of 80 in the migraine group and 84 in the control group. This suggests promising results for future projects studying migraine-associated vertigo subjects themselves.
As mentioned briefly above, upon the detailed review of our results, we encountered a particular challenge in interpreting our SCEP values. As described, the SCEP values were calculated as the area under the curve of the OKAN for the first 30 seconds of darkness after optokinetic stimulation (after excluding the first 2 seconds). A mathematical formula was developed in collaboration with a software expert at our institution to calculate this value. However, upon manual evaluation of the data we observed that the slow-phase measurements taken during the first 30 seconds of darkness after optokinetic stimulation seemed to be reliably present only during the first 10 seconds or so, after which the nystagmus would either stop completely or become so slow and sparse as to become undetectable with a standard VNG apparatus. This led to the production of artifacts on the VNG readouts after about 10 seconds or so of OKAN. Given that SCEP and Tc were both calculated using the 30 second model, the second half of the SCEP measurements may have contributed some uncertainty to the measurements by inferring data points that were not present (between more sparse and possibly artifactual data points) and calculating a corresponding area under that curve. Consequently, we also looked at SCEP values calculated for the first 10 seconds after the stimulus was removed. This demonstrated a greater difference between the migraine and control groups, although the results were still not statistically significant. In future analyses, we will analyze both values of SCEP between groups to verify whether the 10 second SCEP is a more reliable measurement than SCEP over 30 seconds.
In terms of subjective symptoms of discomfort in response to the optokinetic stimulation, the literature suggests that these are more frequent among migraine patients.4,5 In our study, migraine subjects did indeed experience a heightened impression of dizziness after testing (p = 0.026) when compared to controls. There were no statistically-significant differences in the other subjective symptoms of discomfort (nausea, headache, anxiety, etc) between groups in response to the testing, however.
In terms of objective signs of stress in response to OKAN stimulation, this is the first study that evaluated this. We did not, however, identify any significant changes in these signs throughout testing in the 2 groups. Of note, the salivary cortisol results were reported as integers (ie, results were either <1 or an integer between 1 and 3). Minor changes, therefore, could have been missed using this type of cortisol measurement, and perhaps serum cortisol would be a better choice in future studies. And, once again, perhaps the lack of a discomfort response to this visual-vestibular mismatch simulation may further support the hypothesis elaborated above that not all migraine patients are created equally. Further research may consider selecting a migraine subgroup with a strong visual-vestibular mismatch discomfort phenotype on whom this would be tested.
Conclusion
In this population of migraine patients at large, OKAN was not useful in differentiating them from control subjects. We hypothesize that there may be a distinct subgroup of migraine patients that are more sensitive to visually-disturbing situations that may differ from other migraine sufferers. Future studies will aim to identify such patients and compare them to controls.
Footnotes
Acknowledgements
The authors would like to acknowledge Silven Rehel, Scientific Coordinator at the Centre de Recherche du Centre Hospitalier de l’Université de Sherbrooke (CHUS) for his contribution to developing the mathematical formulas required to extract quantifiable results from the raw data obtained during OKAN measurements.
Author Contributions
M.K.D. and M.A. contributed significantly to the conception of the study and of the development of the optokinetic drum. M.K.D. and M.C.C.B. contributed significantly to the collection of data. M.K.D., M.C.C.B., and M.A. contributed significantly to the analysis and interpretation of data as well as the writing and editing of the manuscript.
Availability of Data and Materials
The datasets generated and/or analyzed during the current study are not publicly available due [REASON WHY DATA ARE NOT PUBLIC] but are available from the corresponding author on reasonable request.
Declaration of Conflicting Interests
The author(s) declared no potential conflicts of interest with respect to the research, authorship, and/or publication of this article.
Funding
The author(s) disclosed receipt of the following financial support for the research, authorship, and/or publication of this article: Financial support for this study was obtained through a research grant provided by the Division of Surgery at the Université de Sherbrooke, Quebec, Canada.
Ethics Approval and Consent to Participate
Ethics approval was obtained from the Comité d’éthique de la recherche du CIUSSS de l’Estrie – CHUS. Projet #2016-1278 – OKAN. All participants consented to participate in this study.