
Abstract
Background
Magnetic resonance imaging (MRI) findings for neural nuclei are an important reference for the diagnosis of Parkinson's disease (PD) and target localization in deep brain stimulation (DBS). The MRI characteristics of the subthalamic nucleus (STN) in PD patients are heterogeneous and may be indicative of differing levels of motor dysfunction in these individuals.
Objective
To investigate whether the radiological characteristics of the STN on preoperative T2-MRI can assist in predicting motor function improvement in PD patients following STN-DBS through radiomics.
Methods
137 patients with good improvement (Good) and 72 patients with poor improvement (Poor) were enrolled. T2-MRI images of the STN were used to extract radiomics features. Three machine learning models were used to classify the patients according to their radiomics features. Finally, the performance and clinical benefits of the models (radiomics model, clinical model, and clinical-radiomics model) were evaluated by calibration curve, receiver operating characteristic (ROC) curve, and decision curve analysis (DCA).
Results
The logistic regression and support vector machine models optimally distinguished Good and Poor, with areas under the curve (AUCs) of 0.844 and 0.853, respectively. The ROC curve, calibration curves, and DCA demonstrated that the integrated clinical-radiomics model had the highest clinical benefit among all models tested, in the test set (accuracy 0.876 and AUC 0.937).
Conclusions
The combined model incorporating the radiomics features of the STN and clinical features predicted motor function improvement following STN-DBS for PD well and may provide a noninvasive and effective approach for evaluating surgical indications.
Plain language summary
Parkinson's disease (PD) affects movement and significantly impacts patients’ quality of life. Deep brain stimulation (DBS) is a surgical treatment that can improve motor symptoms in PD, but not all patients benefit equally. This study explored whether brain MRI images, specifically of the subthalamic nucleus (STN), could help predict how well patients might respond to DBS. Using advanced machine learning techniques, researchers analyzed MRI features (radiomics) from 209 PD patients to identify patterns linked to better outcomes after surgery. The study found that combining MRI-based radiomics features with clinical factors (such as age and response to medication) created a model that could accurately predict motor improvement following DBS. This combined approach may assist doctors in identifying which patients are most likely to benefit from DBS, potentially improving treatment decisions. While promising, the researchers note that further studies with larger, diverse populations are needed to validate these findings.
Keywords
Introduction
Parkinson's disease (PD) is an age-related degenerative disease of the central nervous system characterized by motor symptoms such as bradykinesia, rigidity and tremor that seriously affects the quality of life of patients and their ability to live independently. 1 Drug therapy is the preferred treatment for PD at the beginning stages of the disease, but its efficacy declines, and adverse reactions to the drugs occur as the disease progresses. For the middle and late stages of PD, deep brain stimulation (DBS) remains the most effective treatment strategy, as it has demonstrated obvious improvements in motor function. The key to the successful application of DBS in the treatment of PD is the selection of patients who will reliably benefit from the procedure. 2
Responsiveness to dopaminergic medications is consistently used as an objective indicator for PD diagnosis and preoperative evaluation. Typically, patients with a 30% decrease in the Unified Parkinson's Disease Rating Scale (UPDRS) III score when in a medicated state with respect to an off-medication state may be considered for DBS.3,4 The ability to access certain PD patients with responsiveness to dopaminergic medications is limited, especially for those with tremor as a primary manifestation, for whom high doses of levodopa are needed for pharmacologic therapy to be effective. 5 Indeed, it would be of great clinical significance to explore new objective clinical indicators that can assist in predicting the curative effect of DBS for PD patients. However, the heterogeneous clinical and neuroimaging manifestations of PD patients make it difficult to objectively evaluate the postoperative efficacy of DBS.
Recently, the subthalamic nucleus (STN) has been well recognized as the key therapeutic target of DBS for PD, as treating this region not only improves clinical symptoms but also allows a significant reduction in the needed levodopa dosage.6,7 The STN is a neuronally dense and highly vascularized structure located between the cerebral peduncle and the zona incerta that can be visualized on preoperative T2-MRI, especially on coronal views.8,9 As a central hub of basal ganglia circuitry and a target of DBS, the heterogeneous MRI characteristics of STN may indicate the responsiveness of DBS for motor function improvement in these individuals.
MRI is the most widely used noninvasive diagnostic test and the most commonly used method for surgical target localization in preoperative imaging for DBSs. Developments in artificial intelligence have gradually helped grow the application of radiomics in medical imaging as a field of research, enabling efficient computational methods to capture tissue and pathological characteristics.10,11 Recently, several studies have shown that the initial response to STN-DBS treatment and postoperative motor efficacy in PD patients can be predicted by analyzing brain morphology and nigrostriatal radiomics features, providing a potentially individualized method of prediction.12–14 Due to the potential role of MRI-based radiomics in the prognosis and treatment evaluation of PD,15–21 there is a need to establish radiomics biomarkers to predict the prognosis of PD patients following DBS and to assess surgical candidates. On preoperative T2-MRI, the STN is heterogeneous among PD patients, but no study has yet to leverage the most conveniently available imaging data (T2-MR images of STNs) to predict postoperative improvement in PD patients.
In this research, we intended to develop an optimal radiomics signature based on preoperative STN-T2MRI for evaluating motor function following STN-DBS. In addition, we constructed an integrated clinical-radiomics model to explore more effective strategies for predicting postoperative motor function improvement following STN-DBS.
Methods
Patients
This retrospective study was approved by the ethics committees of Qilu Hospital, Shandong University (Ethics approval KYLL-2023(ZM)-677) and did not require patient consent or written informed consent for review of medical records or images. Data from 209 patients with PD who underwent DBS surgery from January 2017 to July 2021 at our hospital were included in the study. The inclusion criteria were as follows: (1) clinical diagnosis of PD combined with deep brain stimulation; and (2) preoperative MRI scan. The exclusion criteria were as follows: (1) Significant artifacts or noise on preoperative MRI; (2) global pallidus internus (GPI)-DBS surgery; and (3) incomplete UPDRS scores and no information on the Movement Disorder Society (MDS)-UPDRS score. These patients were randomly divided in a 1:1 ratio into training and test sets. (Figure 1(a)).
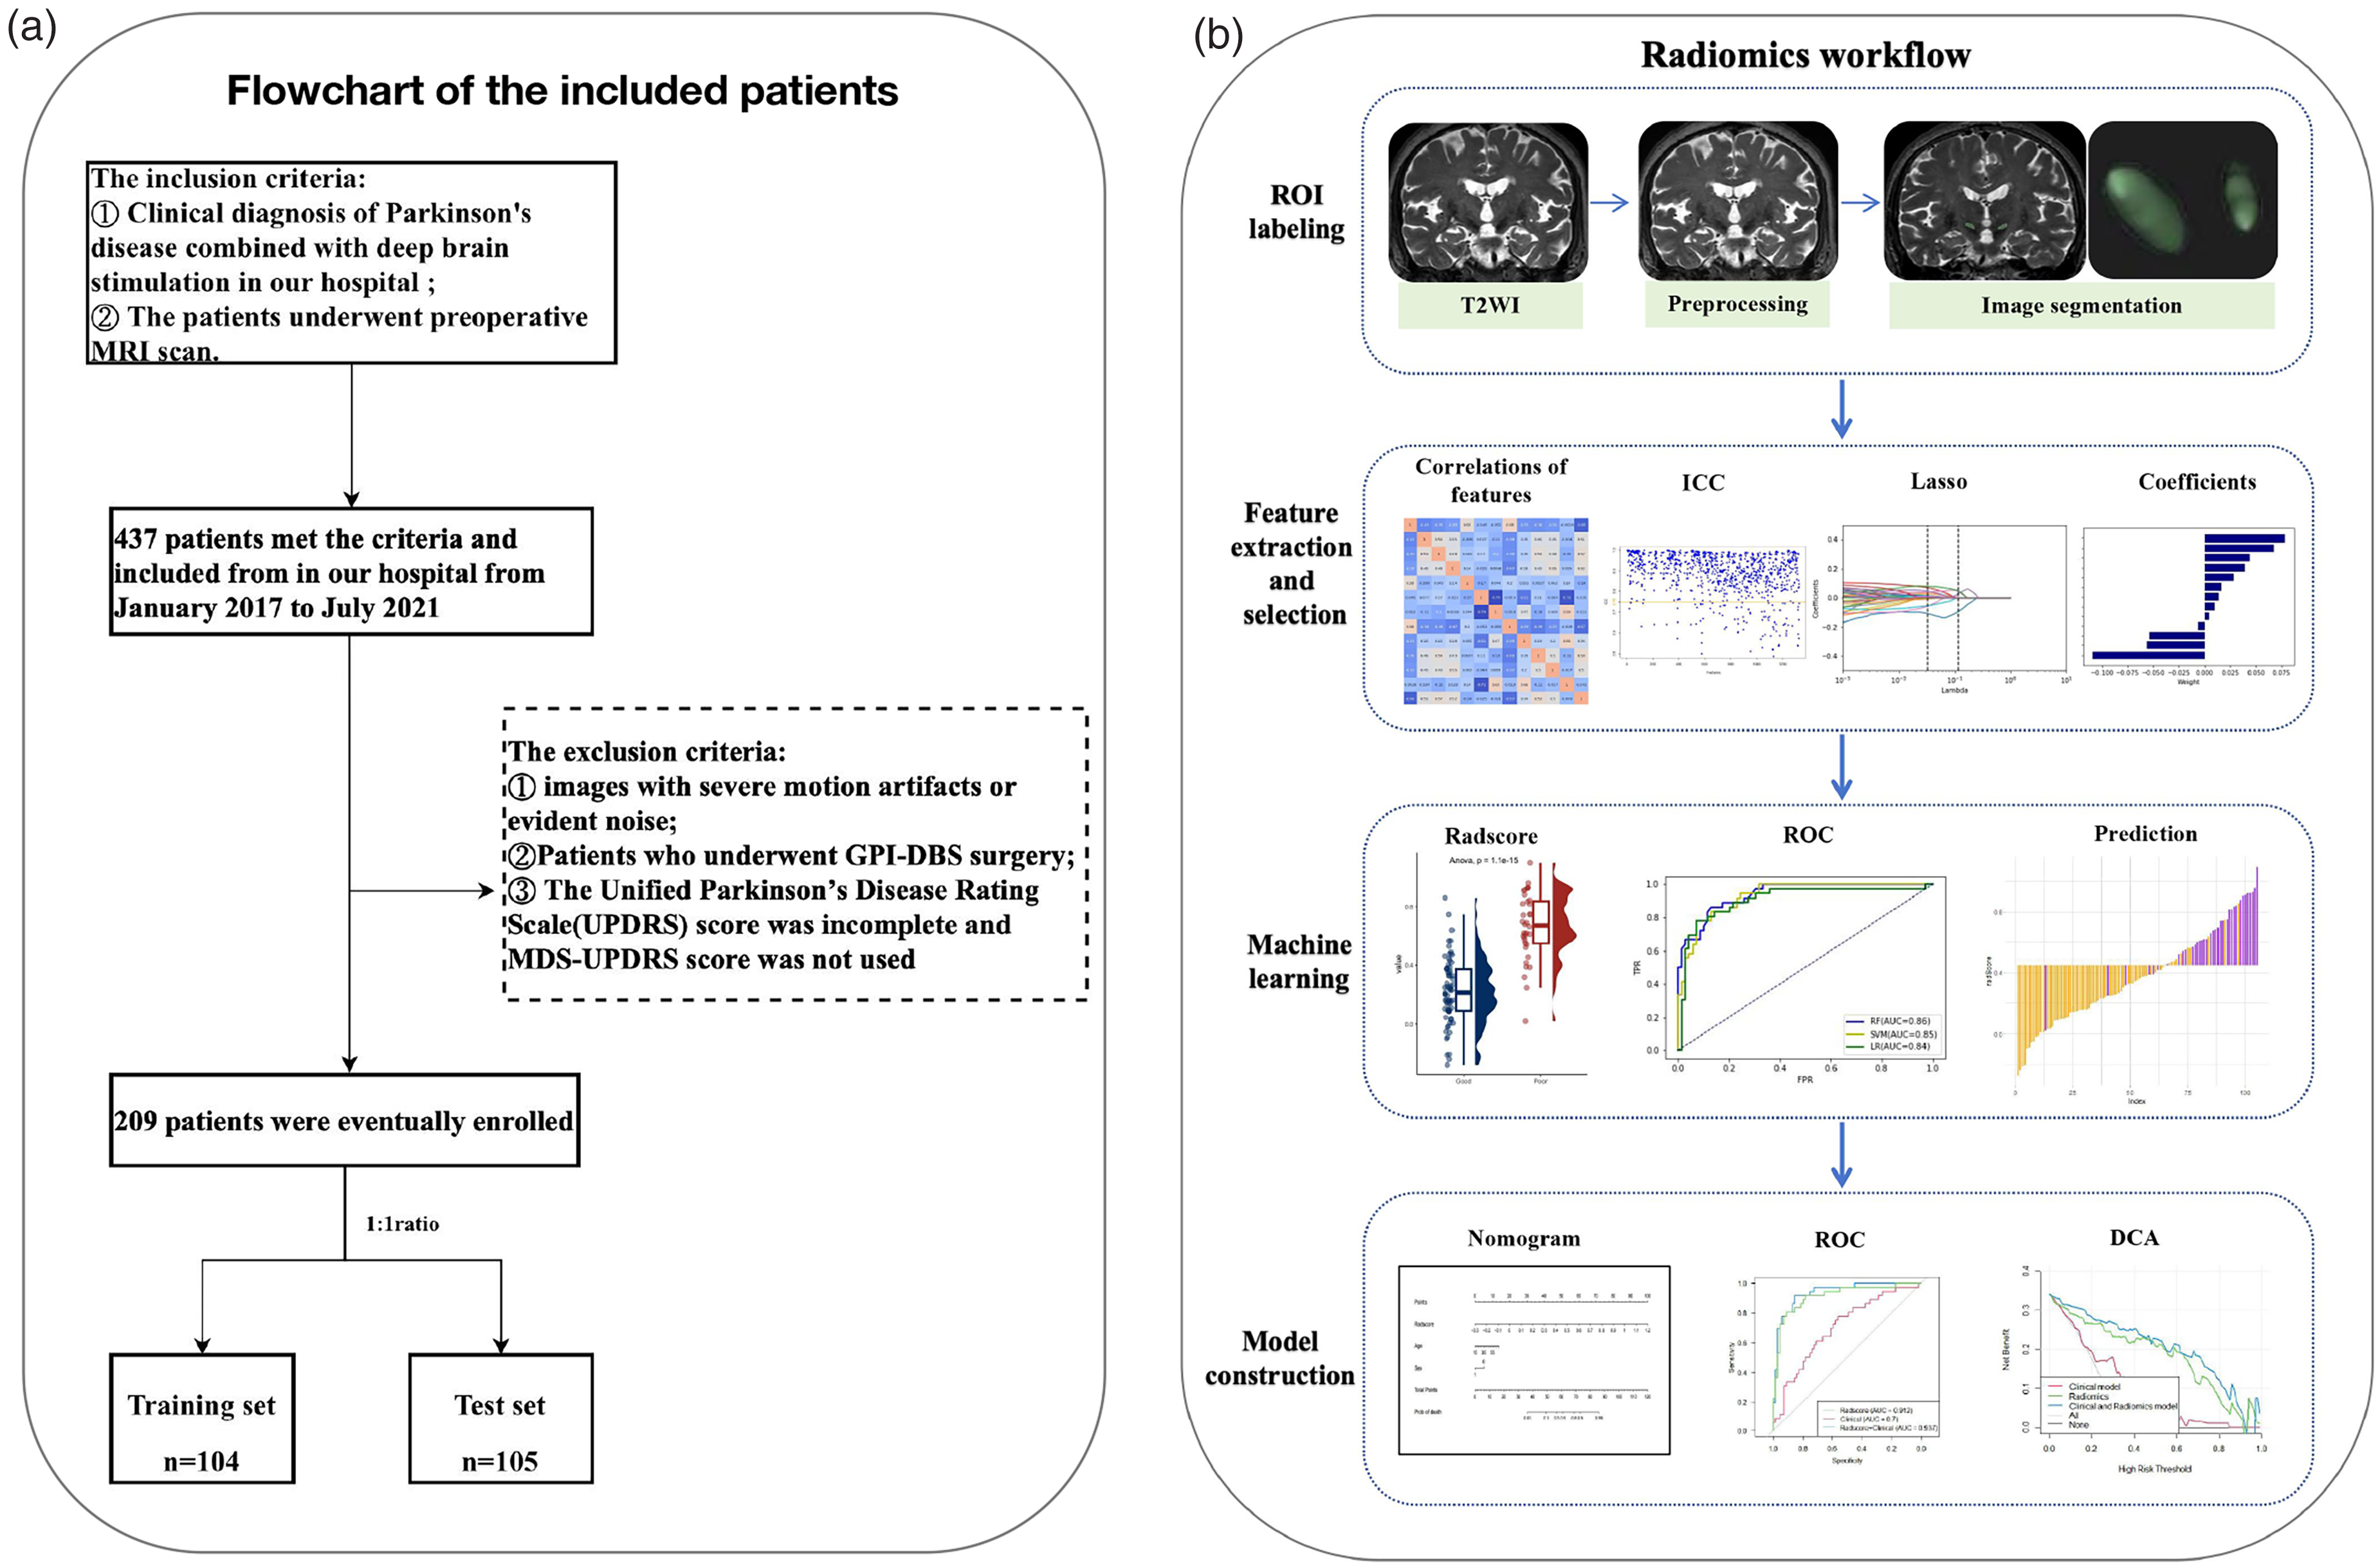
Flowchart of the included patients (a). Radiomics workflow (b).
Clinical data assessments
Prior to the STN-DBS technique, demographic and clinical information such as gender, age of onset (AOO), levodopa equivalent daily dosage (LEDD), LCT responsiveness, 39-item Parkinson's Disease Questionnaire (PDQ-39) score, and freezing of gait (FOG) were collected. Preoperative MDS-UPDRS III scores were collected in the off-medication (med-OFF, 12 h levodopa cessation) state. At the 3-month follow-up, postoperative MDS-UPDRS III and LEDD scores were acquired in the DBS-ON/med-OFF state. The following formula was used to calculate motor improvement: improvement (%) = [(preoperative MDS-UPDRS III score) - (postoperative MDS-UPDRS III score)]/(preoperative MDS-UPDRS III score)*100%. We artificially assigned patients with an improvement rate ≥50% to the good improvement group and those with an improvement rate < 50% to the poor improvement group.
Construction of the clinical model
In the training set, a one-way analysis of variance was utilized to compare clinical variables between patients with good and poor progress. To develop a clinical factor-based model, significant factors from the one-way analysis were included in univariate logistic regression analysis. For each independent factor, the odds ratio (OR) and 95% confidence interval (CI) were calculated.
MRI acquisition and preprocessing
MRI scans were acquired on a 3.0 T Philips Achieva scanner. T2 coronal scanning was performed using the turbo spin echo (TSE) sequence, layer thickness 2 mm, layer spacing 0, resolution: 256*256, number of acquisitions 2 times, field of view (FOV): 260*260, TR: 3800 TE: 103, and scanning baseline perpendicular to the anterior commissure-posterior commissure (AC-PC) line. Next, the acquired MRI scan was preprocessed according to the following steps. First, an “N4 ITK” bias field correction was applied to correct for intensity inhomogeneities caused by inhomogeneities in the scanner's magnetic field during image acquisition. 22 Then, resampling (voxel size = 1 × 1 × 1 mm3) was performed to ensure that the scale and orientation were maintained when exporting the 3D features. 23
ROI segmentation and features extraction
The radiomics workflow is shown in Figure 1(b). Without knowledge of the patient's clinical findings, two neurosurgeons used 3DSlicer software (version 4.10.2; https://www.slicer.org) to segment the bilateral STNs at the dorsolateral level as the regions of interest (ROIs) on coronal T2-weighted (T2 W) images. To standardize the criteria, the ROIs were delineated at the level of the anterior border of the red nucleus for all patients. Supplemental Figure 1 is an example of STN segmentation.
Imaging features were extracted according to the Image Biomarker Standardization Initiative (IBSI) feature guidelines in Anaconda Prompt software (version 3.7.0) using the PyRadiomics feature package (github.com/Radiomics/PyRadiomics) for image feature extraction. The extracted radiomics features included 18 first-order features, 14 shape features, 24 gray level co-occurrence matrix (GLCM) features, 16 gray level run length matrix (GLTLM) features, 16 gray level size zone matrix (GLSZM) features, 14 gray level dependence matrix (GLDM) features, 5 neighboring gray tone difference matrix (NGTDM) features, 5 gray level distance zone matrix (GLDZM) features, 5 neighboring gray level dependence matrix (NGLDM) features, 48 Gabor filter features, 9 Laws features, and 45 wavelet features, for a total of 1329 features.
To examine the reproducibility of radiomics feature extraction, fifty randomly selected MR images were chosen for interobserver agreement. During the same period, neurosurgeon 1 and neurosurgeon 2 independently segmented the ROIs on the T2 W images to assess interobserver agreement in the extracted radiomic features according to the intraclass correlation coefficient (ICC), where an ICC > 0.75 indicated good agreement. If strong agreement was demonstrated, neurosurgeon 1 then extracted the radiomics features from the remaining samples. Subsequent analysis was performed only on samples in which neurosurgeon 1 was circled.
Selection of radiomics features
The Pearson correlation coefficient matrix between the features was calculated, and one of a pair of features was removed if the absolute value of the correlation coefficient between the two was greater than 0.9 (Supplemental Figure 2). This was done to avoid the problem of multicollinearity in the model due to the incorporation of highly correlated features. Then, the dataset was divided into a training set and a test set, the former of which was further divided into two subsets based on the category labels. For each feature, Levene's variance chi-square test was used to determine whether the variances of the two subsets were equal; if they were, t tests were used to test whether there was a significant difference between the means of the two subsets; otherwise, Welch's t tests were used. If the features were significantly different at a significance level of 0.05, the feature was selected to form the final feature subset. Feature selection was then performed using a random forest classifier with 25 trees. Then, the SelectFromModel method was used to select features based on their significance by setting the threshold to 0.01, i.e., features with significance greater than 0.01 were selected. Finally, least absolute shrinkage and selection operator (LASSO) regression was used for feature selection: first, the features were normalized, and then a LassoCV object was created, which can make the coefficients of some of the become 0 by adding the L1 regularization term to achieve feature selection. In the code, a series of different alpha values (α) are used, and the best alpha value is selected by 10-fold cross-validation. The features whose coefficients are not 0 are selected as the final selection. The LASSO logistic regression model weighting coefficients were used to calculate the radiomics score (Radscore) for each patient.
Construction of machine learning models
Three classification models, support vector machine (SVM), logistic regression (LR) and random forest (RF), were constructed by using the final LASSO-screened data features in the training set to train the models, after which the features of the validation set were used to evaluate model performance. The classification performance of the different models was evaluated by plotting ROC curves and calculating AUC values, 95% CIs, accuracy, sensitivity and specificity.
Construction of a radiomics nomogram model and the performance of different models
Important clinical factors were integrated with the Rad-scores to create a radiomics nomogram. The radiomics nomogram score (Nomoscore) was then calculated for each patient. We plotted calibration curves to graphically study the performance of the nomogram with respect to actual probabilities. We evaluated the performance of each model in distinguishing between good and poor prognosis based on the AUC in the training and validation sets. The clinical utility of the nomograms was assessed using decision curve analysis (DCA), in which the decision curves for the clinical factors, radiomics features, and radiomic nomogram were plotted by calculating the net benefit of each model for a series of threshold probabilities.
Statistical analysis
Statistical analyses were performed using SPSS statistical software (version 24.0; SPSS), R statistical software (version 4.3.0; https://www.r-project.org), and Python (version 3.7.0; https://www.python.org/). Quantitative data are expressed as the mean ± standard deviation (SD). The level of significance was set at p < 0.05. Univariate analysis of variance (ANOVA) was used to compare clinical factors among groups, chi-square or Fisher's exact test was used for pairwise comparisons of qualitative data, and the independent samples t test was used for pairwise comparisons of quantitative data. Univariate ANOVA was also used to compare the value of each radiographic characteristic in differentiating between good and poor prognosis. LASSO regression based on multivariate binary logistic regression was performed using the “sklearn” software package for Python. ROC curves were plotted using “sklearn” for Python and “pROC” for the R package. Fitted plots and calibration curves were plotted using the “rms” package of R. Differences in AUC values between models were estimated using DeLong's test. DCA was performed using the “rmda” package of R. The software package used in this study can be downloaded from the following website (https://cran.r-project.org/web/packages/).
Results
Participants, baseline characteristics, and follow-up outcomes
A total of 209 patients (95 males and 114 females) were included in our study, of whom 104 patients were placed in the training cohort and 105 patients in the test cohort. Demographic and clinical information for all recruited patients is summarized in Table 1. In the training cohort, age, AOO and LCT improvement rate differed significantly between patients with good and poor prognoses. In the test cohort, age, AOO, ON-UPDRS-III and LCT improvement rate were significantly different. Univariate logistic regression analysis showed that age, AOO and LCT improvement were all associated with improved motor function after surgery for PD. A clinical model was constructed with these three features.
Baseline table of clinical characteristics of patients in the training set and test set.
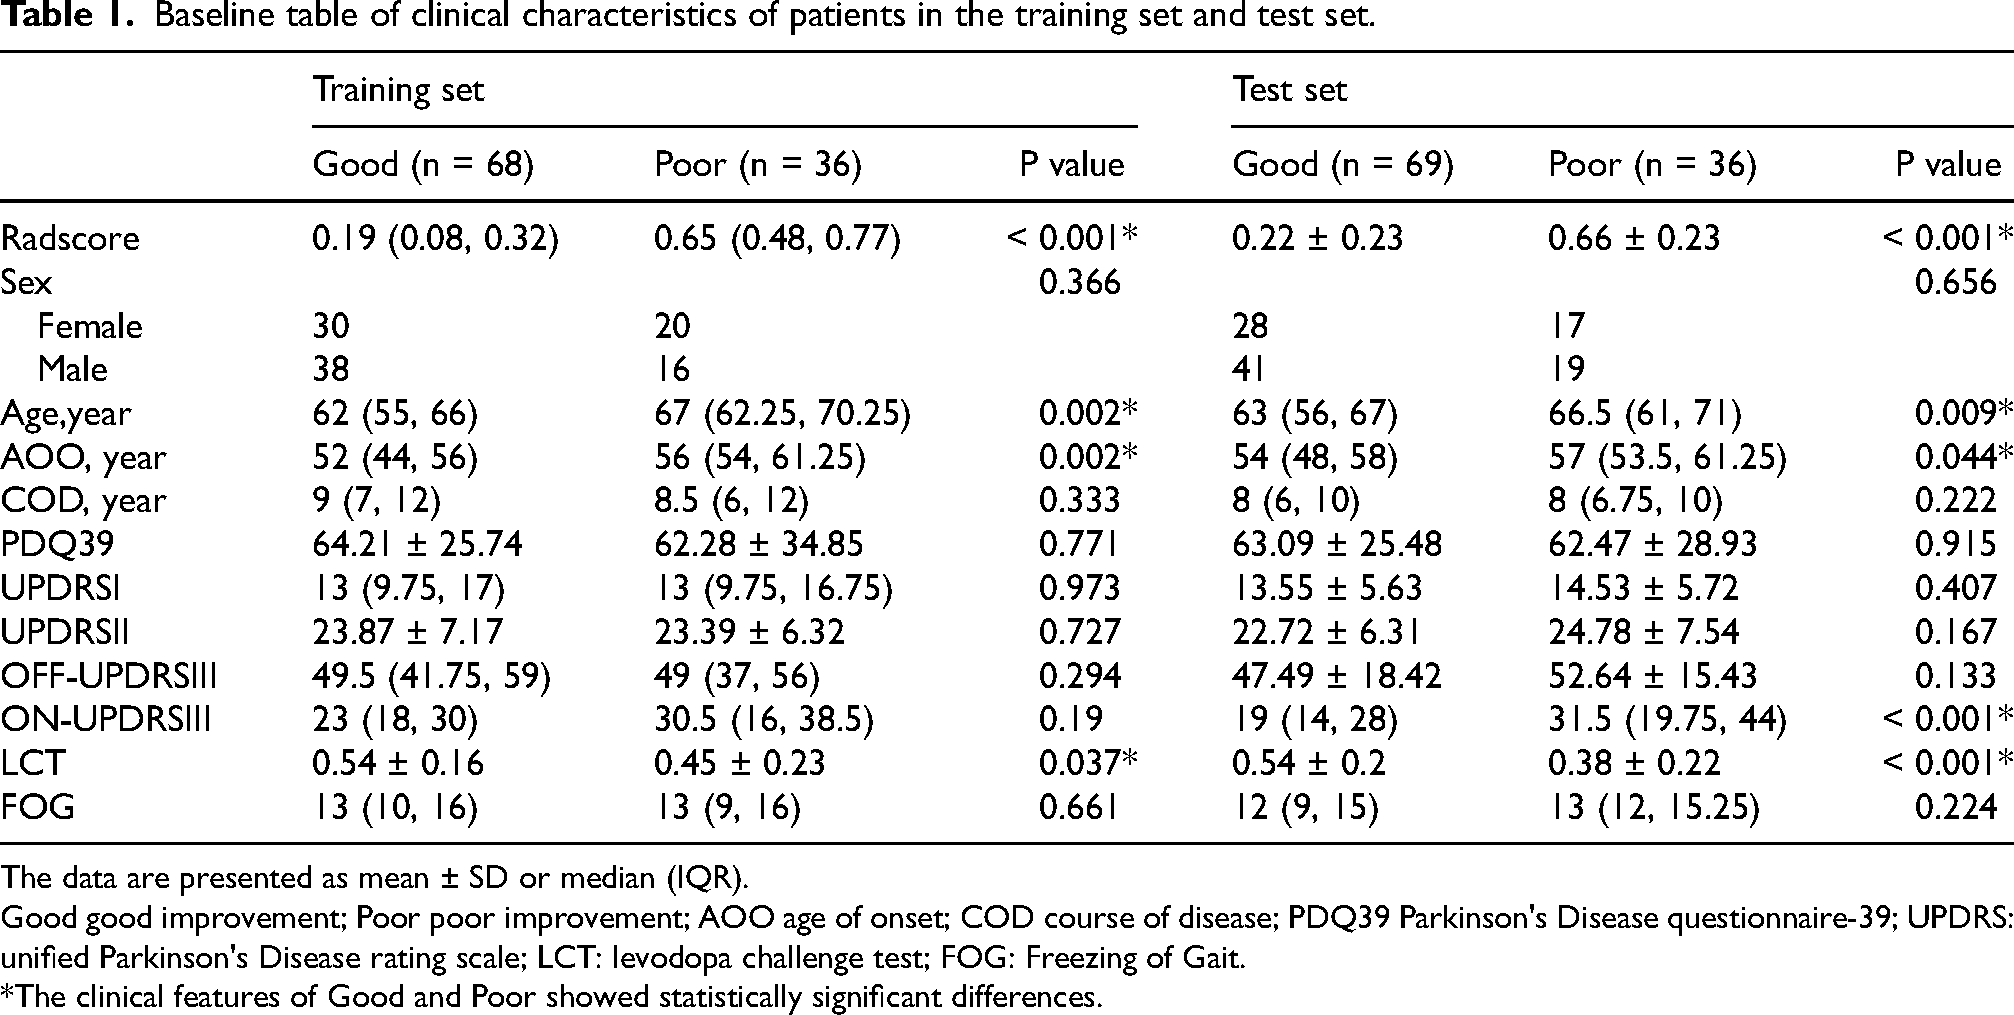
The data are presented as mean ± SD or median (IQR).
Good good improvement; Poor poor improvement; AOO age of onset; COD course of disease; PDQ39 Parkinson's Disease questionnaire-39; UPDRS: unified Parkinson's Disease rating scale; LCT: levodopa challenge test; FOG: Freezing of Gait.
*The clinical features of Good and Poor showed statistically significant differences.
Radiomics feature analysis
A total of 1329 radiomics features were extracted from the bilateral ROIs. We selected 1052 radiomics features with all ICC values >0.75, a reasonable selection strategy described in previous reports 24 and detailed in Supplemental Figure 3. Among these features, 13 with nonzero coefficients were retained after feature downscaling and dimensionality reduction, as shown in Figure 2(a) to (c). In both the training and validation cohorts, patients with a poor prognosis showed higher Radscores than patients with a good prognosis, and the difference between groups was significant (p < 0.001). Meanwhile, the screened image features were significantly different between the two groups (Figure 3(a) and (b)). Supplemental Figure 4 shows the confusion matrix of the prediction results for the training and test sets, indicating that the imaging histology model has good prediction efficacy. We show the logistic regression prediction of good prognosis versus poor prognosis between the two groups in a bar chart with the true results (Figure 3(c) and (d)). It shows good prediction accuracy in both the training and test sets. The ROC curves of the three radiomics models (including LR, SVM, and RF) in the training and test sets are shown in Figure 3(e) and (f). The prediction accuracy, AUC, sensitivity, testing degree, and 95% CIs are detailed in Table 2. The RF model tended to overfit both the training cohort and the test cohort. Both the LR and SVM algorithms yielded better radiomic models.
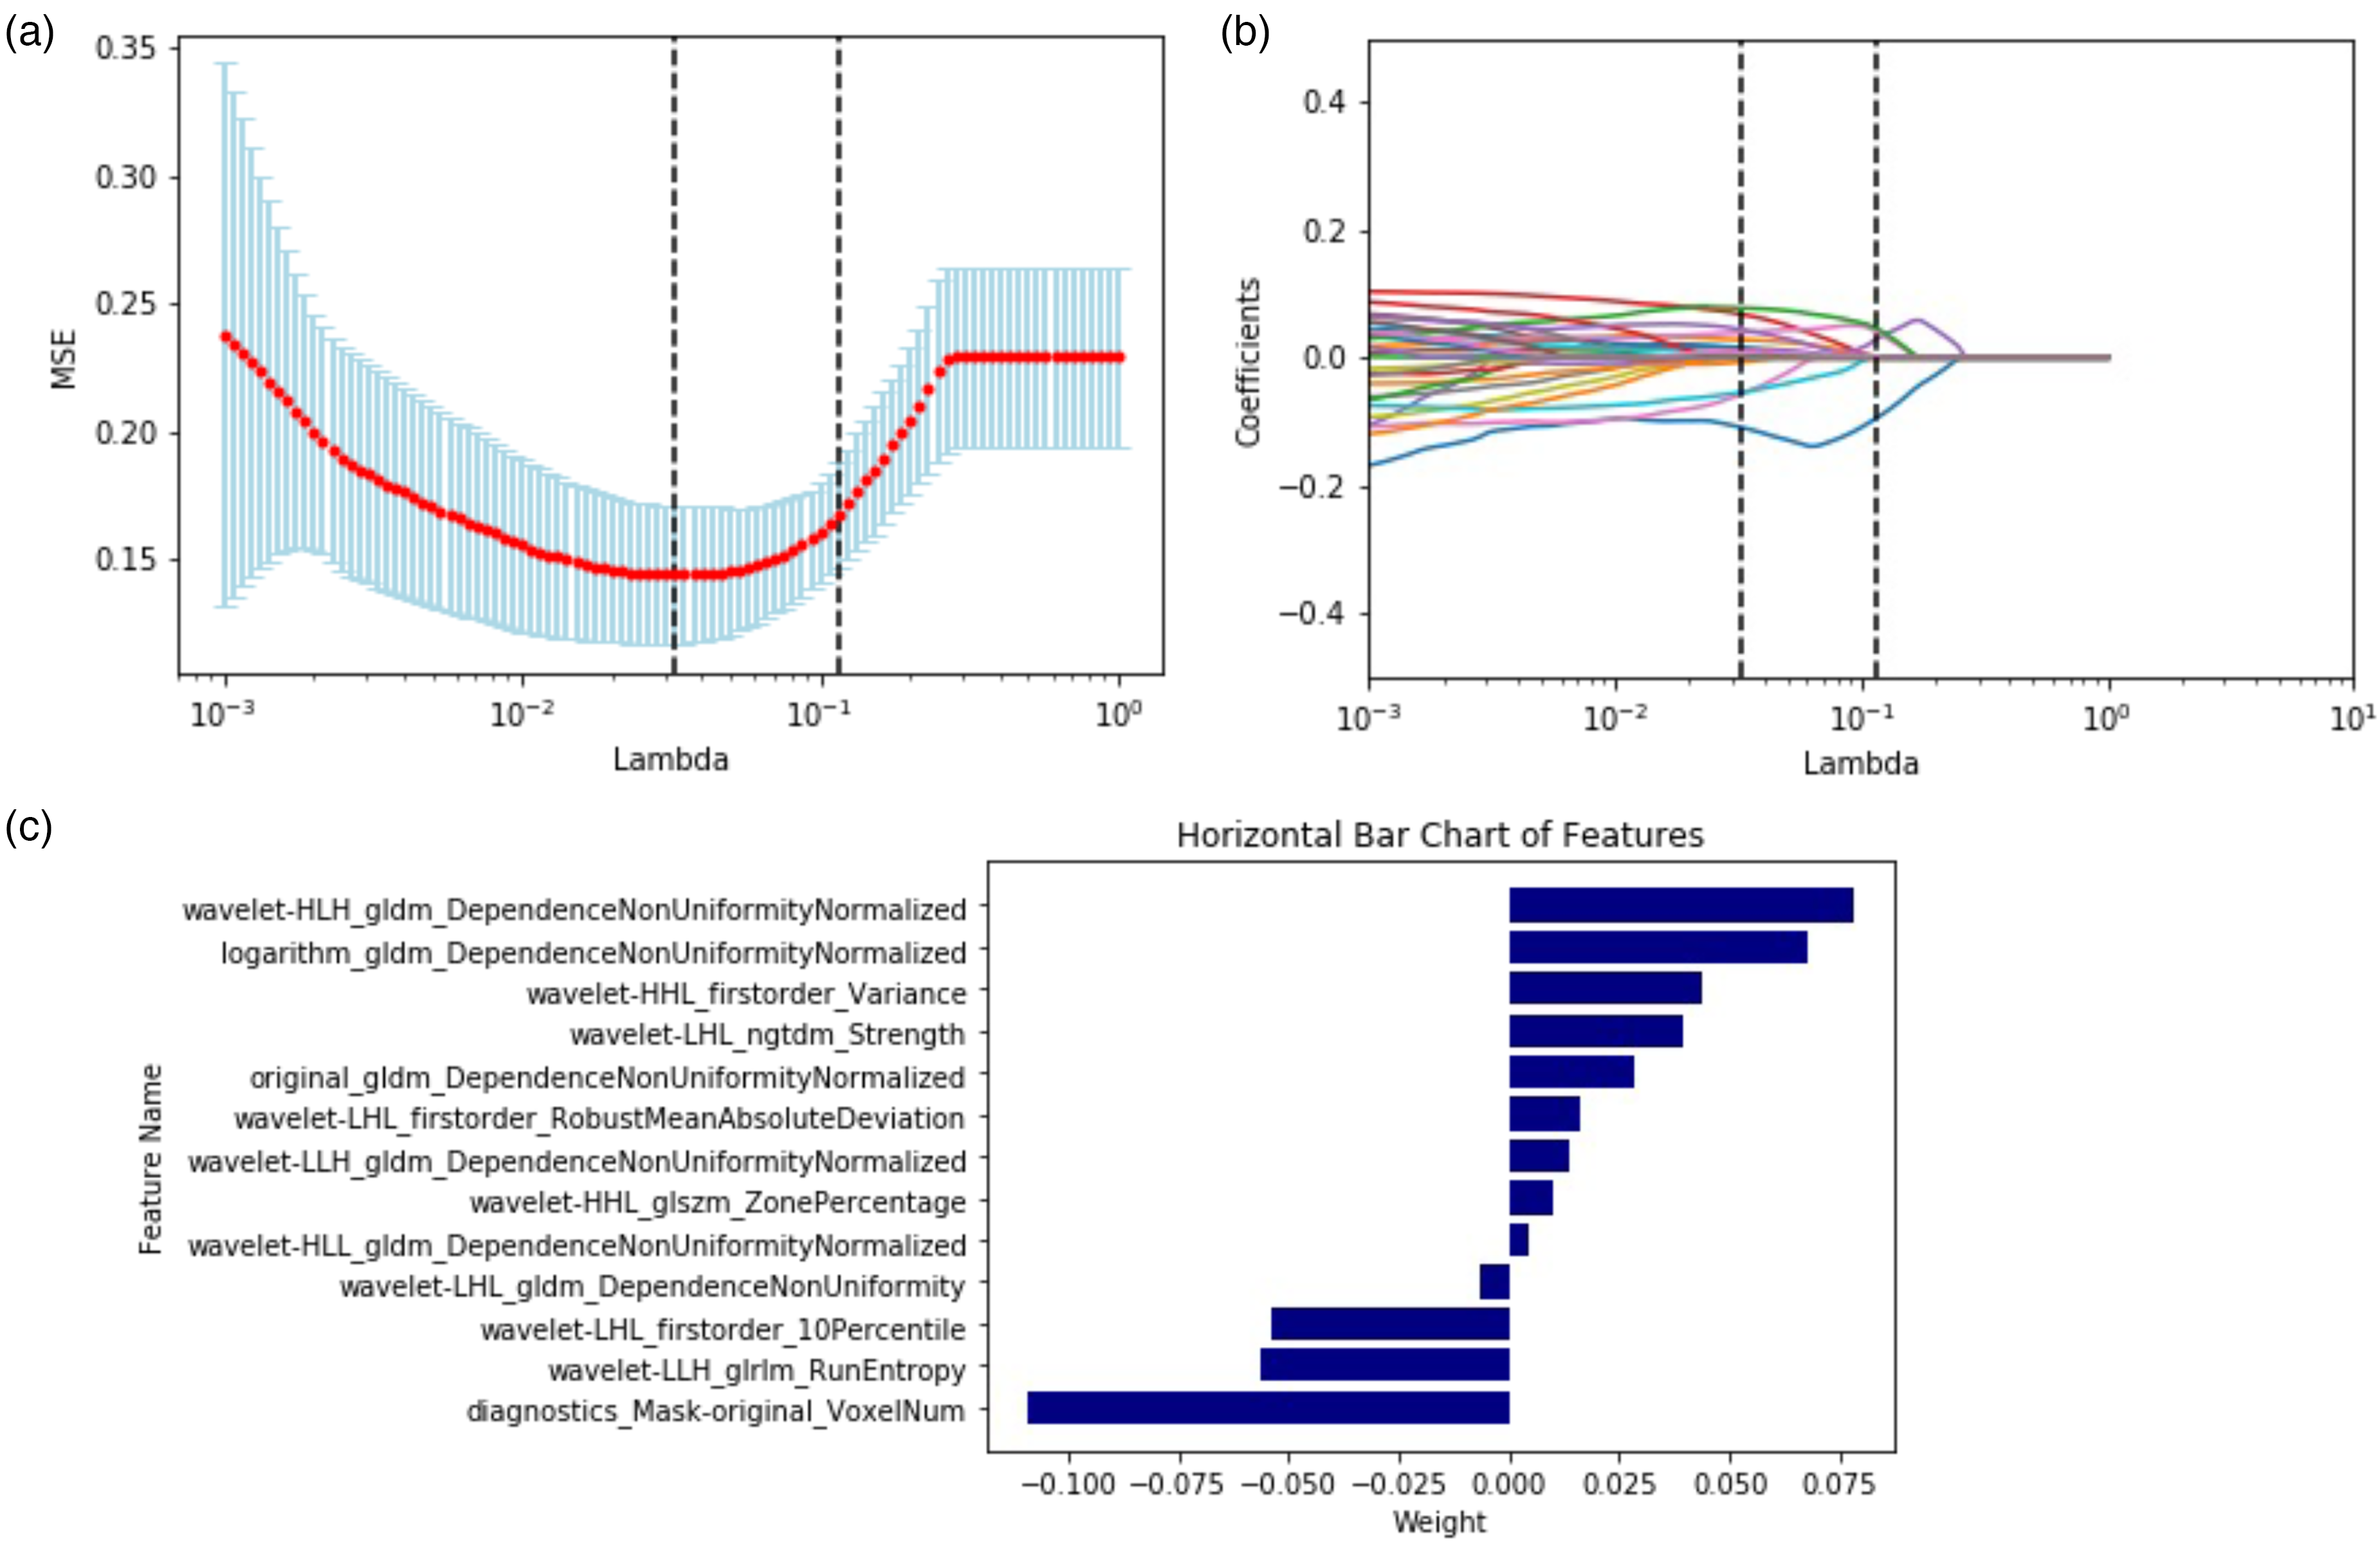
LASSO (a b). Coefficients of features in the Radscore (c).
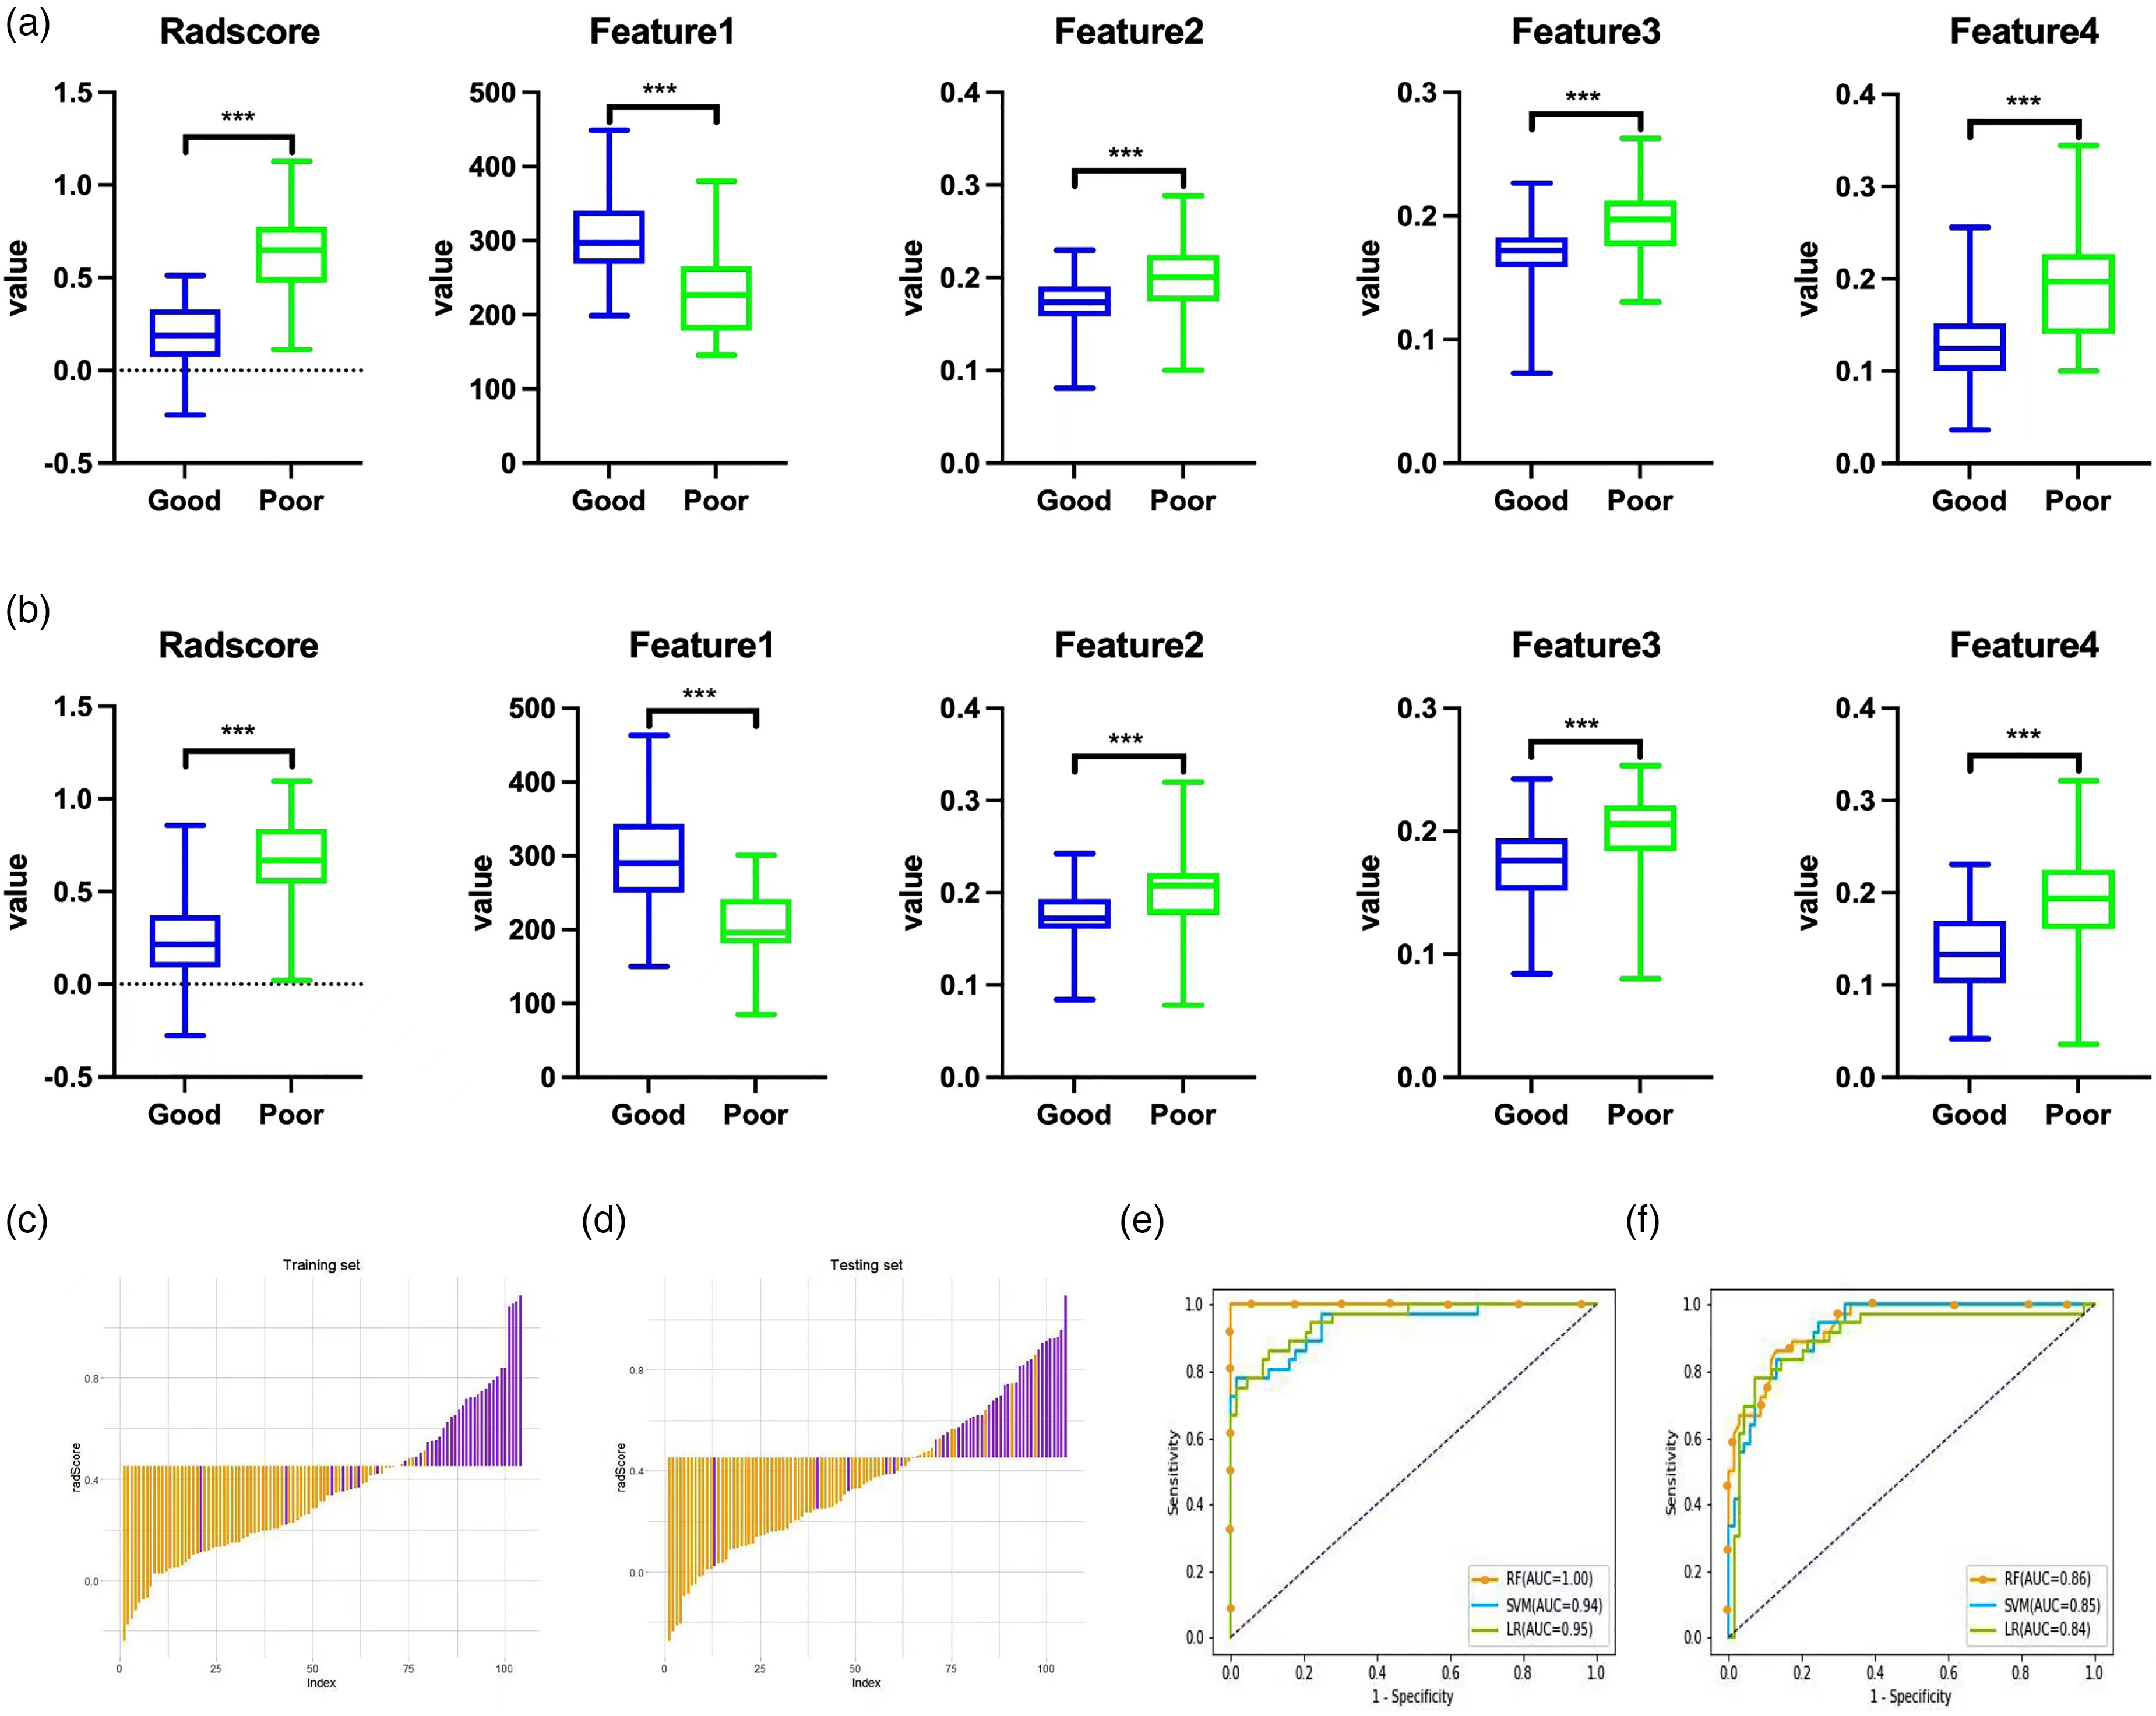
The radiomics signatures and four representative features showed significant differences between the good and poor improvement groups (p < 0.05) in the training set (a) and test set (b). Histogram of the Radscore for each patient in the training set (c) and test set (d). The yellow bars show the Radscore values for the good improvement group, and the purple bars show the values for the poor improvement group. ROC curves of the SVM, RF, and LR models in the training (e) and test sets (f). ROC: receiver operating characteristic; AUC: area under the curve; LASSO: least absolute shrinkage and selection operator; LR: logistic regression; SVM: support vector machine; RF: random forest.
Comparison of the three radiomics feature classifiers.
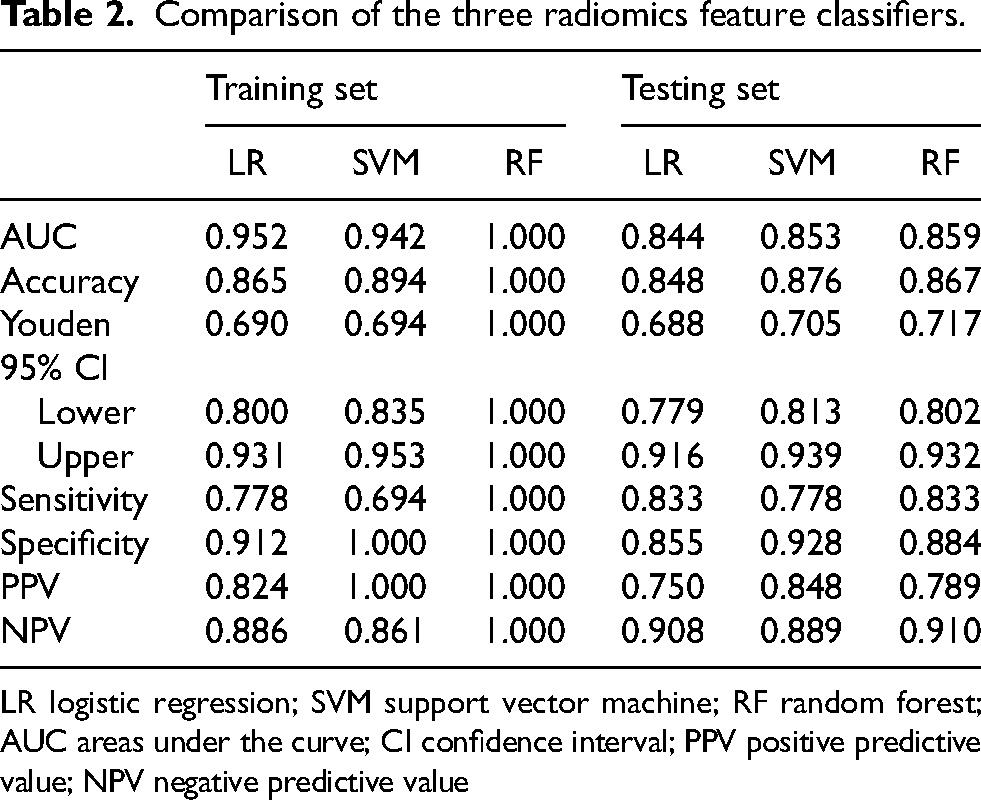
LR logistic regression; SVM support vector machine; RF random forest; AUC areas under the curve; CI confidence interval; PPV positive predictive value; NPV negative predictive value
Integrated clinical-radiomics model
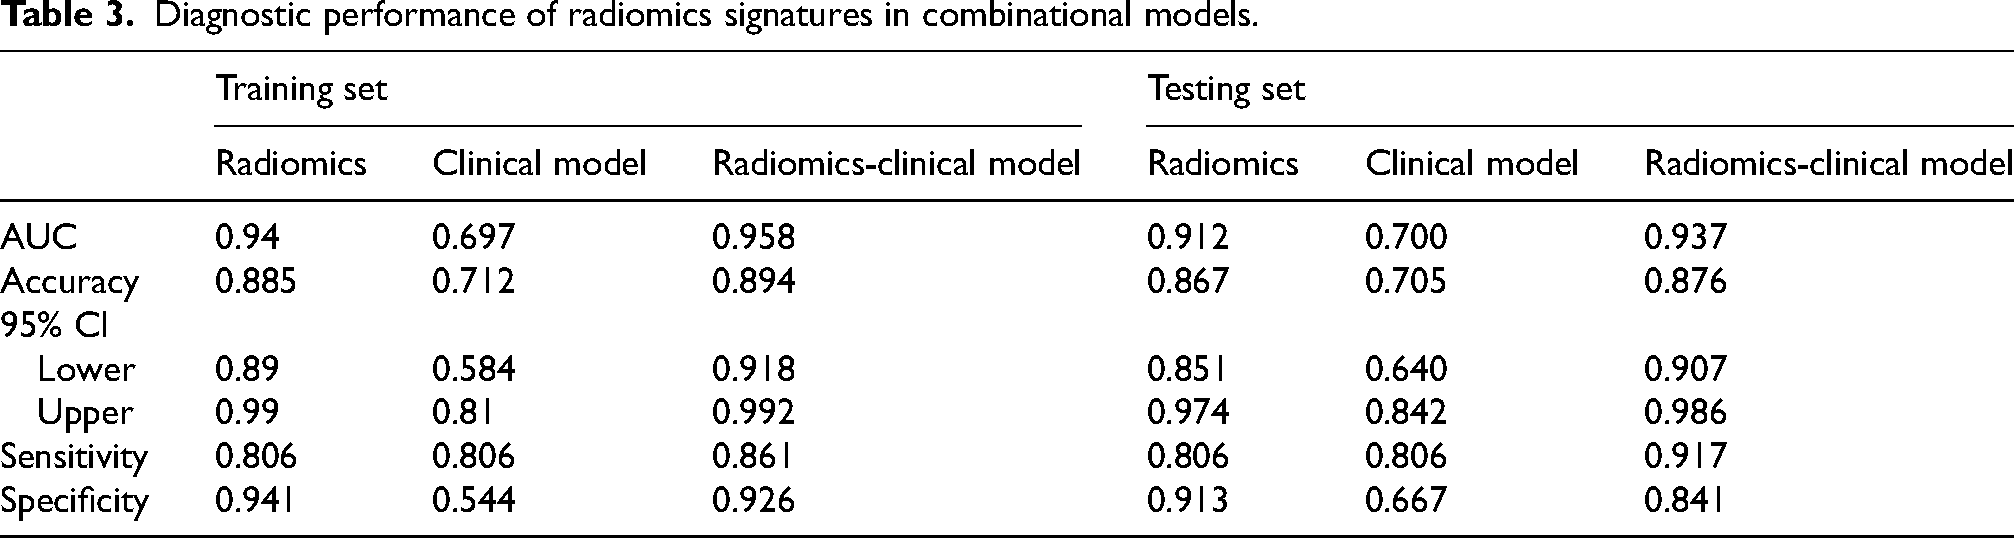
Combining the clinical variables, we further constructed a comprehensive diagnostic model by logistic regression. Age, AOO, and LCT were identified as independent factors in the clinical-radiomics integrated model by multivariate logistic regression. The nomogram based on these clinical factors and the Radscore is shown in Figure 4(a). The calibration curve showed good calibration in the training and validation sets (Figure 4(b) and (c)). In this study, the Nomoscore was obtained using the following equation: Nomoscore = (Radscore × 13.6315) – (Age ×0.0773) + (AOO × 0.0593) – (LCT × 5.0632) − 1.7571. ROC curve analysis showed that the integrated clinical-radiomics model had higher differential diagnostic efficacy, with AUCs of 0.958 and 0.937 in the training and validation sets, respectively. DeLong's test showed that the difference in diagnostic efficacy between the clinical-radiomics integrated model and the clinical feature-only model (AUCs of 0.697 and 0.700 for the training and test sets, respectively) was statistically significant (p < 0.001); however, the difference in diagnostic efficacy was not statistically significant with respect to the radiomics-only model (Radscore) (p = 0.228). The DCA results showed that the integrated clinical-radiomics model had the highest clinical benefit, followed by the radiomics model alone, and the clinical model alone had the lowest benefit (Figure 5(a) and (b)). DCA suggested that the integrated clinical-radiomics model showed greater net benefits over threshold probabilities in the range of 0 to 1.The ROC curve analyses of the Radscore, clinical model and integrated clinical-radiomics model are illustrated in Figure 5(c) and (d) and Table 3.
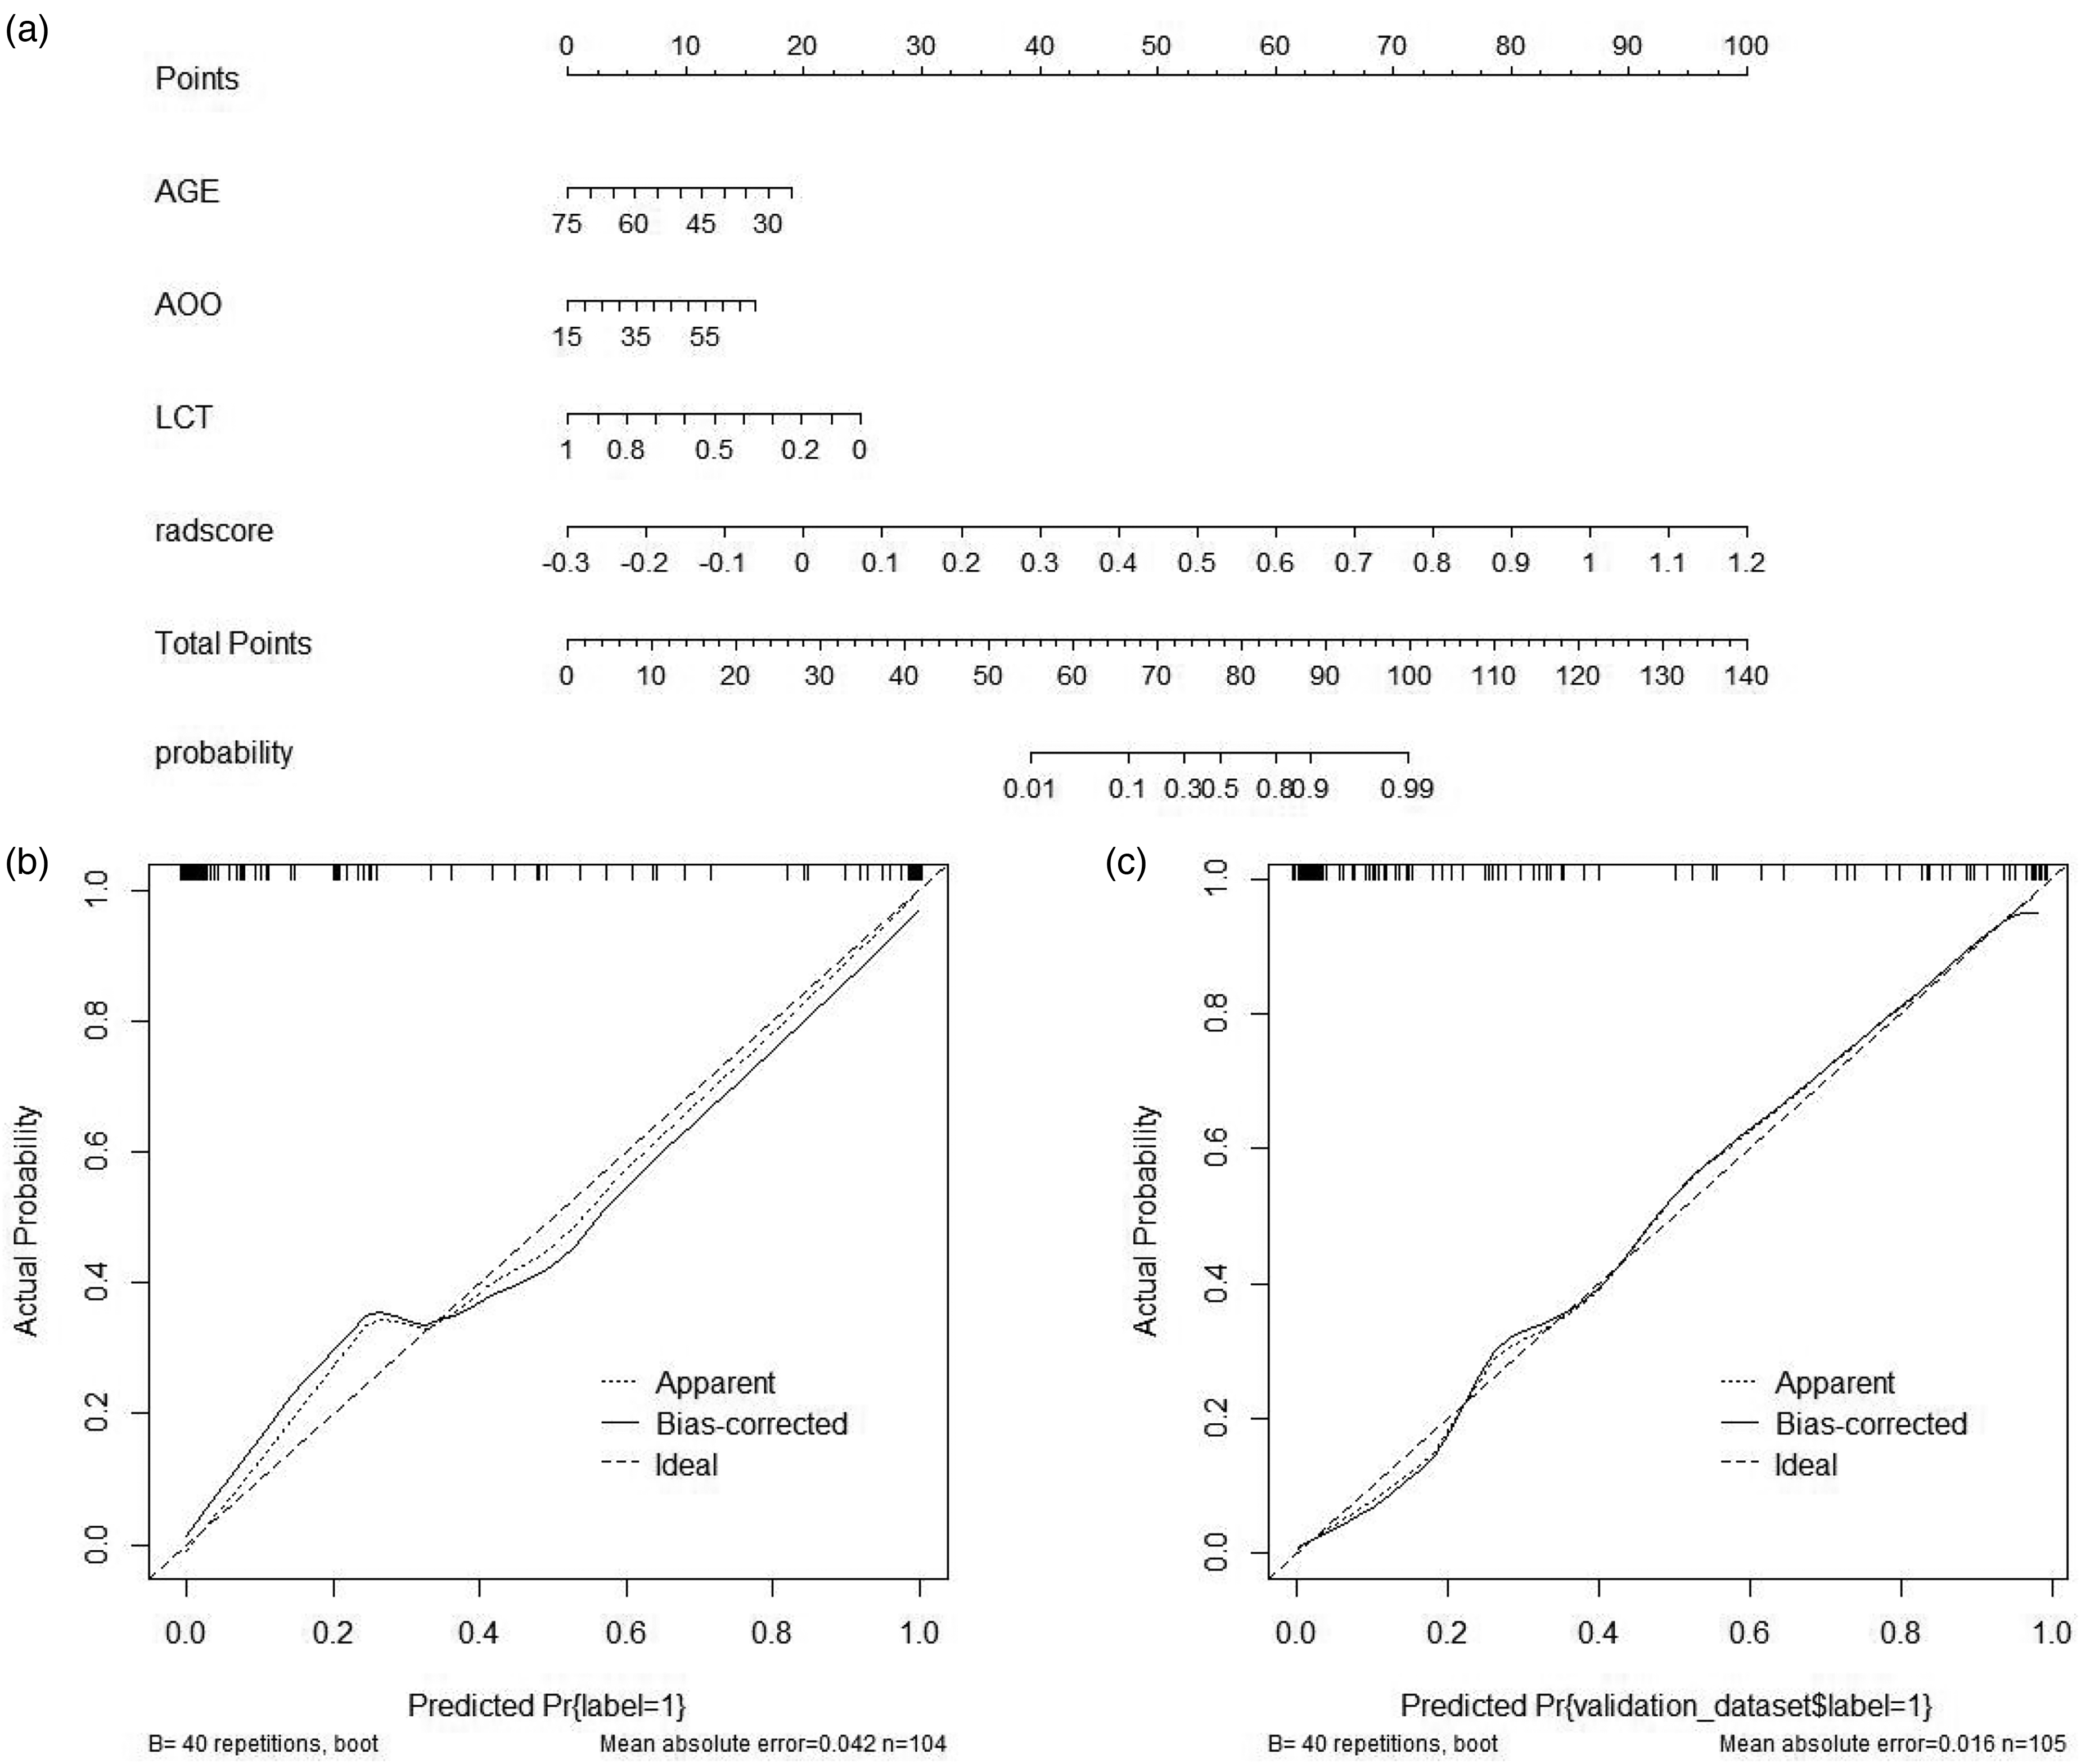
Nomogram based on clinical characteristics and radscores (a). Calibration curves for the integrated clinical-radiomics model in the training set (b) and test set (c).
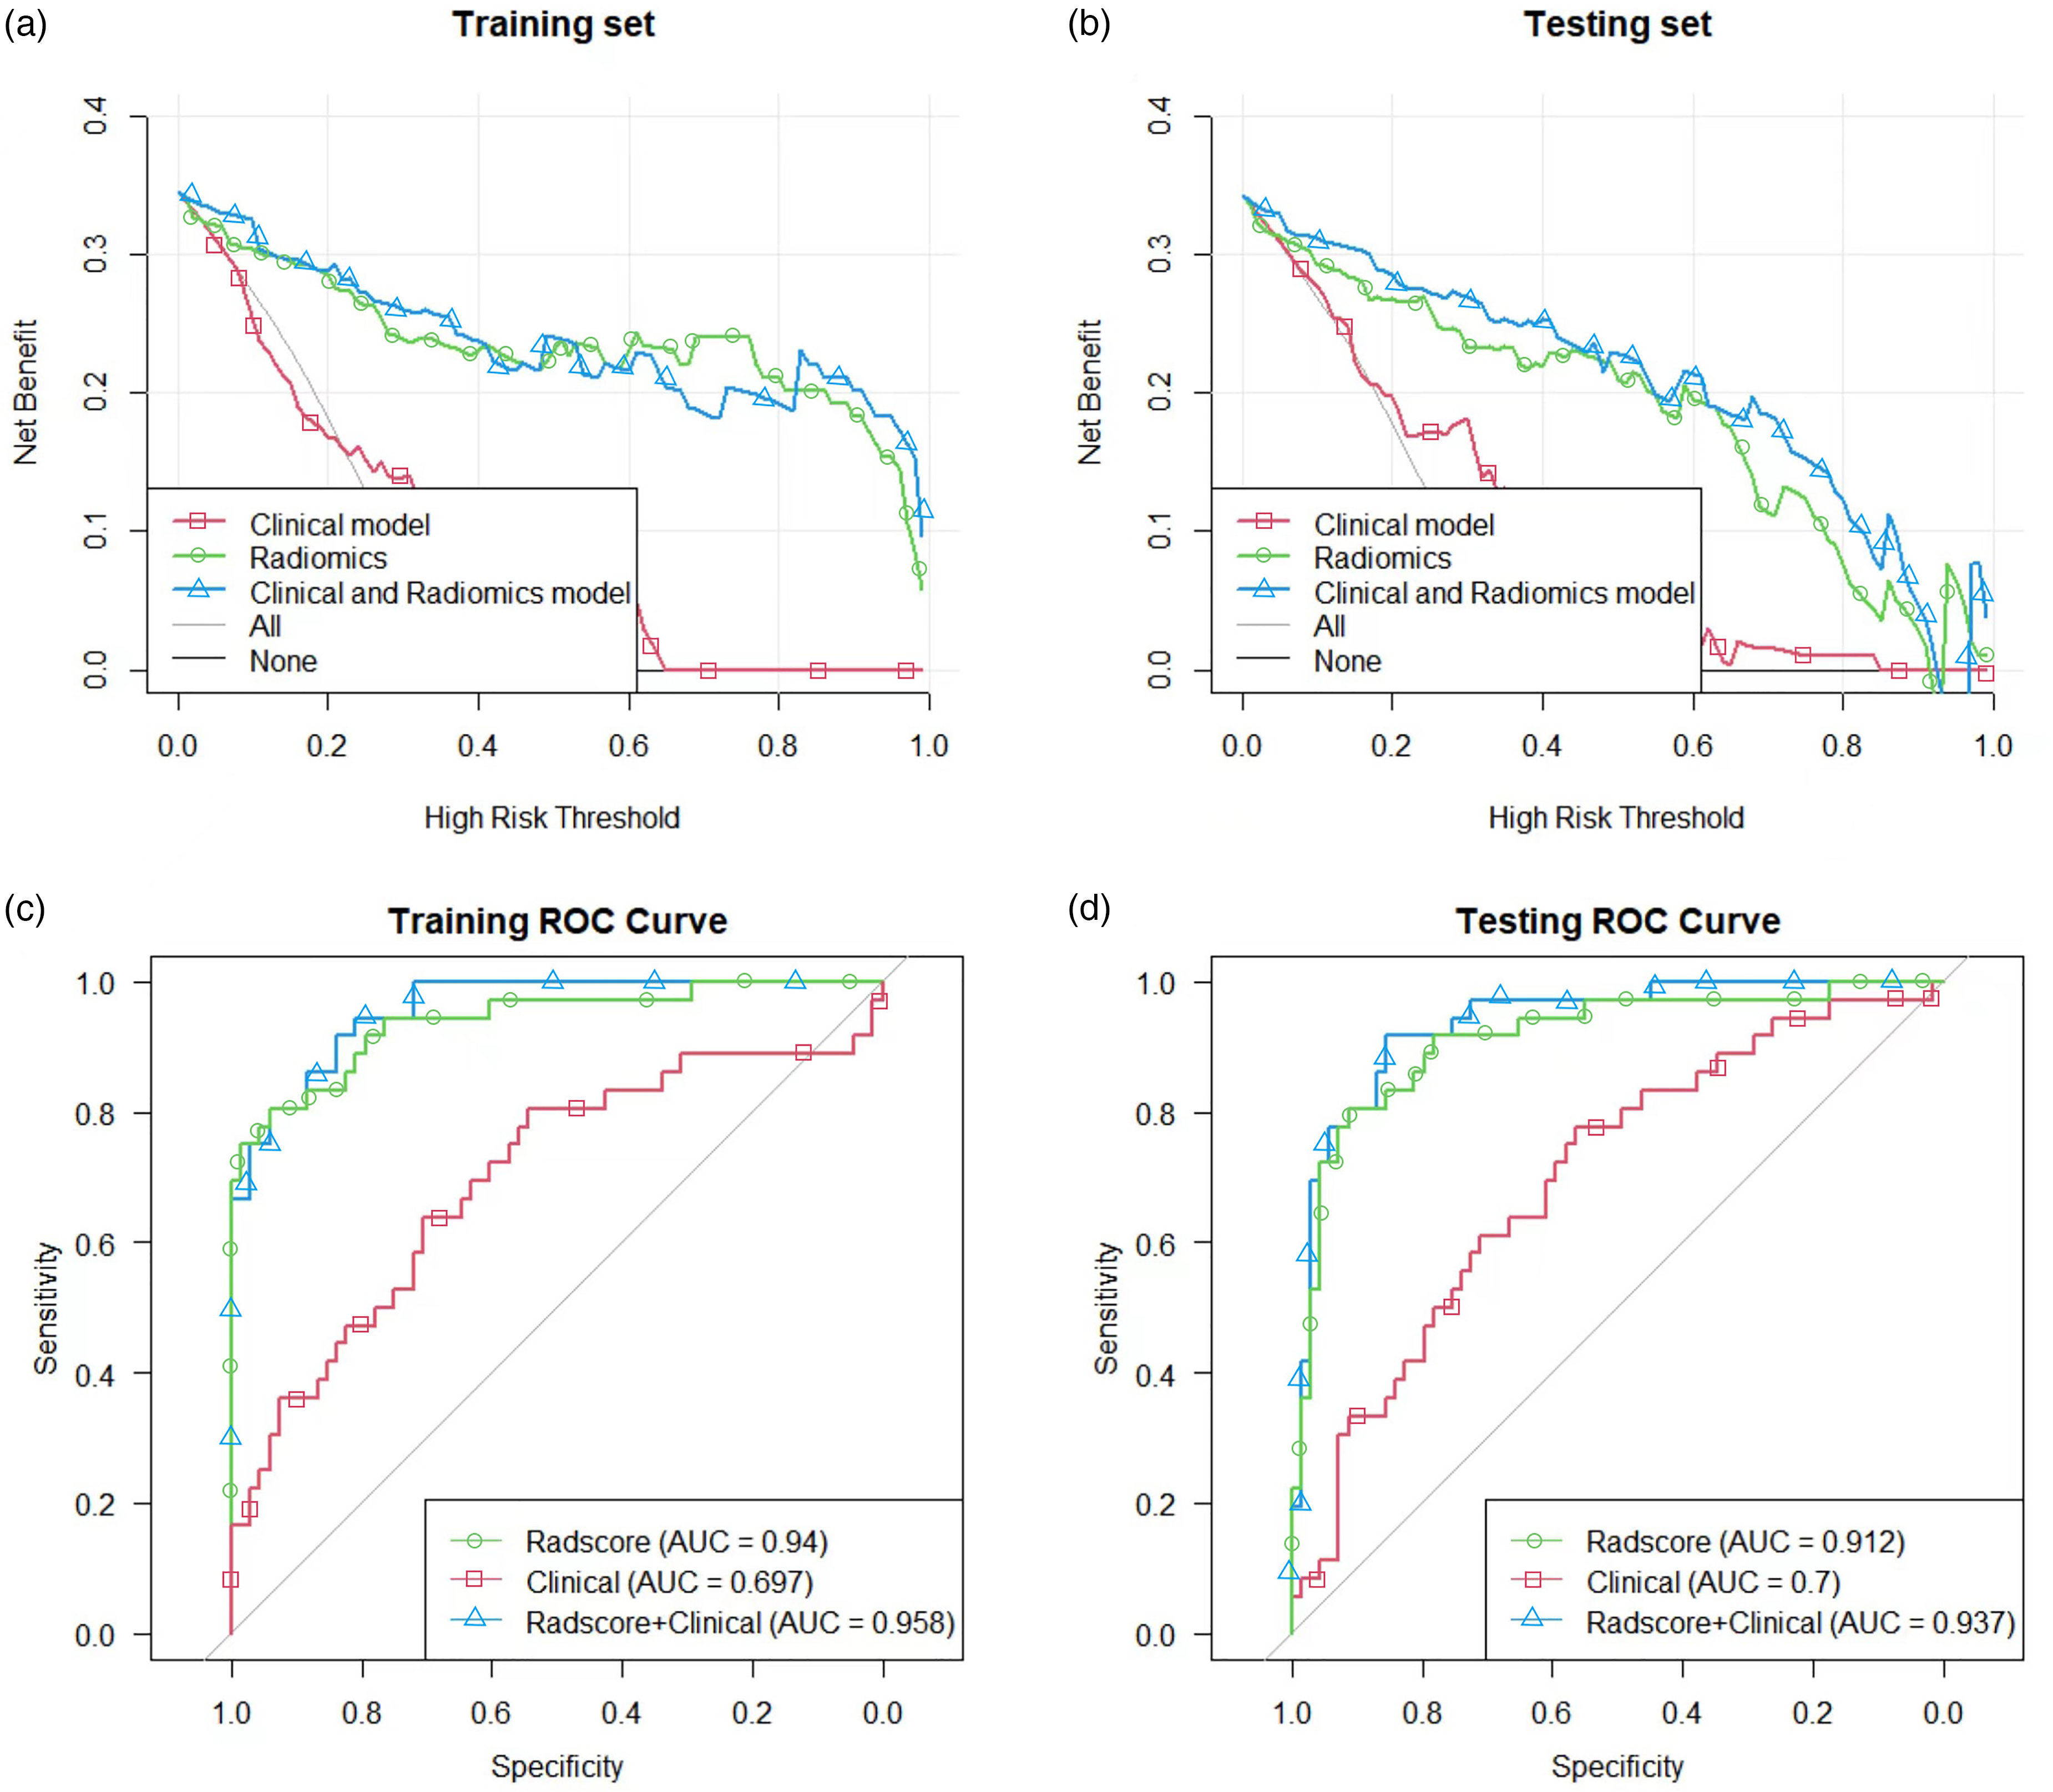
Decision curves for the radscore, clinical model and integrated clinical-radiomics model in the training set (a) and test set (b). The Y-axis shows the clinical benefit of the models. The green line represents the Radscore, the blue line represents the nomogram, and the red line represents the clinical model. The X-axis indicates the threshold probabilities. Diagnostic evaluation and testing of the integrated clinical-radiomics model for differentiating between the good and poor improvement groups. ROC curves of the Radscore, clinical model and integrated clinical-radiomics model in the training set (c) and test set (d); the integrated clinical-radiomics model performed best (AUC of the training set and test set, 0.958 vs. 0.937). ROC: receiver operating characteristic; AUC: area under the curve.
Diagnostic performance of radiomics signatures in combinational models.
Discussion
In this study, we used a machine learning model to validate the strong correlation between STN-DBS and postoperative motor function improvement and obtained the most effective radiomics features for differentiating between good and poor postoperative prognoses from coronal T2-MRI of the STN. Finally, the radiomics model was fused with clinical features to further improve the predictive efficacy.
DBS is a very effective neurosurgical treatment for PD movement disorders,25,26 but the exact neural mechanism of DBS by which it provides benefits is still unknown, which has hindered its promotion and development to a certain extent. If the patients are well adapted, the electrodes are implanted accurately, and the stimulation parameters are set appropriately. Stimulation of both the STN and GPI can provide significant long-term improvements in core motor symptoms such as tremor, rigidity, and bradykinesia in patients with middle- and late-onset PD.27,28 The goal of DBS surgery is to improve motor symptoms and potentially certain nonmotor symptoms at the same time. STN-DBS can significantly reduce the drug dosage for PD patients and is currently the most selected method for delivering DBS.29,30 It has also been shown to improve nonmotor symptoms such as depression and anxiety in PD patients.31,32 Therefore, the STN has been the most used stimulation target for the treatment of PD in the clinic. Even so, some patients are still dissatisfied with the efficacy, and even a few patients have no significant improvement in motor symptoms after surgery. Because large centers have a large number of surgical patients, the number of patients with poor treatment effects should be more common in large centers than in small centers, which is more convenient for our model to predict. Although the number of non-responders will be small, it is of great significance to patients. If there is a way to predict the efficacy of patients in advance, perhaps doctors and patients will carefully consider whether to undergo surgery. Our research is working towards this goal.
The therapeutic efficacy of STN-DBS in PD patients is influenced by multiple factors. Therefore, accurate prediction of improved surgical outcomes is clinically important. Lyons et al. 33 found that the higher the response rate to levodopa in patients with PD was, the better the postoperative outcome, so the levodopa response rate is considered a predictor of the efficacy of STN-DBS. For the assessment of dopaminergic responsiveness, it is generally recommended to apply the acute levodopa loading test. Improvement rates of ≥30% are generally considered indicative of the need for surgery. Ory-Magne et al. 34 found that age at surgery for STN-DBS was negatively correlated with the 39-Item Parkinson's Disease Questionnaires (PDQ-39) and positively correlated with the prevalence of apathy and depression and concluded that age at surgery is an important predictor of postoperative outcome. The ages of patients undergoing DBS surgery are usually <75 years, but relaxation of the age limit is recommended if the patient is in good physical condition. Most of our conclusions are consistent with previous studies. In the training cohort, age, AOO, and LCT improvement rate differed significantly between good and poor prognoses, whereas in the test cohort, age, AOO, ON-UPDRS-III, and LCT improvement rate differed significantly. Univariate logistic regression analysis showed that age, AOO and LCT were all associated with improvements in motor function after PD surgery. Therefore, we created our clinical model based on these three characteristics.
Radiomics is a method for studying medical images that can extract features that are difficult to capture with the naked eye for use in deeply analyzing the information in the images to assist in clinical diagnosis and treatment. 35 The main features extracted by radiomics include shape features, histogram features, texture features, model-based features, and transform-based features. 10 In recent years, radiomics has been widely used to assess the prognosis of PD patients. Using the MRI scans of 94 patients with PD who underwent STN-DBS treatment, Chen et al. 12 found that the thickness of the right anterior middle frontal gyrus was significantly correlated with treatment outcome, while the volume of the gray or white matter in other parts of the brain was not. Features such as brain morphology were used to predict an individual's initial treatment response to STN-DBS by a machine learning algorithm with a relative error of 11.4%. The results of the article suggest that changes in brain morphology are associated with treatment effects and can be used to predict an individual's initial treatment response. 12 Structural changes in the substantia nigra and STN are recognized as major factors affecting clinical deterioration in patients with advanced PD.36,37 Liu et al. 13 used quantitative susceptibility mapping (QSM)-based radiomics to predict motor efficacy after DBS in PD. The resulting QSM model based on nigrostriatal radiomics features predicted global motor and tonic efficacy with an accuracy of 82%, outperforming a model based on levodopa response alone for tonic efficacy. These findings suggest that QSM radiomics of the substantia nigra is a viable method for predicting motor outcomes after STN-DBS in patients with DBS. The current literature search found that there is no radiomics study based on the STN nucleus in T2-MRI to evaluate DBS prognosis. STN is an important regulatory hub of the basal ganglia circuit and is the main imaging material for preoperative evaluation and intraoperative positioning, with potential evaluation value. By using a high-throughput radiomics approach to extract features from T2 W images, we show that a conventional STN-MRI-based radiomics signature is a good predictor of motor function ameliorability in PD after STN-DBS. In our study, three models based on SVM, LR and RF algorithms were used for radiomics modeling. Among the three machine learning models, SVM and LR have good prediction performance with training set accuracy of (89.4%, 86.5%) and validation set accuracy of (87.6%, 84.8%). RF has obvious overfitting, because the calculation of this model is huge, and our sample size is relatively small, so the prediction accuracy of the training set is 100%, but the accuracy of the validation set is also 86.7%, so we believe that RF needs to be applied to larger sample sizes and multi-center studies. The above studies and our results suggest that radiomics features can be used as biomarkers to predict prognostic motor function improvement in STN-DBS.
We then built the best diagnostic ability integrated clinical-radiomics model (training set: AUC = 0.958; test set: AUC = 0.937). However, the purely clinical model's diagnostic performance and clinical utility were not sufficient, and so the difference in performance between the integrated clinical-radiomics model and the radiomics-only model was not significant (p = 0.228). Incorporating clinical features into radiomics analyses is crucial as imaging is meant to enhance clinical decision-making and not replace it. Furthermore, the improved diagnostic efficiency signifies that a multidisciplinary approach, which includes radiomics analysis, is essential for the diagnosis and treatment of diseases. 38
Our study had several limitations. First, this radiomics study used only one imaging modality, T2-MRI. Future studies may explore how multiple imaging modalities can be combined to improve diagnostic and therapeutic accuracy. Second, the sample size of our study is relatively small, and the data were derived from a single-center cohort, which is not sufficiently representative of the population. In the future, we will validate our model with data from other centers to improve model generalizability. Third, a lack of interpretability is one of the biggest limitations of machine learning. Fourth, all of the ROIs in our study were delineated manually. Automatic segmentation is indeed efficient and repeatable. However, ROI is difficult to distinguish on the coronal T2, and the STN position, size, direction, and shape of different patients are slightly different. Therefore, the use of standardized atlas circle will cause incomplete STN circle or circle a lot of non-STN tissues, affecting the model establishment. Therefore, we believe that manual circle is a more accurate segmentation method. However, this way could limit the ability to perform large-sample studies and explore the clinical applications of radiomics. As the training sample size increases, it will be important to develop automatic or semiautomatic algorithms for image selection and ROI determination in future studies to improve the feasibility of the study and reduce interoperator variability. Automated sketching methods and brain partitioning studies may lead to precise automated segmentation with AI screening as the ultimate goal.
Supplemental Material
sj-docx-1-pkn-10.1177_1877718X251319697 - Supplemental material for Predicting motor function improvement following deep brain stimulation of the subthalamic nucleus for Parkinson's disease based on STN-T2MRI radiomics
Supplemental material, sj-docx-1-pkn-10.1177_1877718X251319697 for Predicting motor function improvement following deep brain stimulation of the subthalamic nucleus for Parkinson's disease based on STN-T2MRI radiomics by Zhenke Li, Jinxing Sun, Haopeng Lin, Qianqian Wu, Junheng Jia, Xing Guo and Weiguo Li in Journal of Parkinson's Disease
Footnotes
Acknowledgments
The authors have no acknowledgments to report.
Funding
The authors disclosed receipt of the following financial support for the research, authorship, and/or publication of this article: This work was supported by the National Key Research and Development Program of China [grant number: 2022YFC2405105], the Natural Science Foundation of Shandong Province [grant number: ZR2023MH036], and the Young Elite Sponsorship Program of Shandong Provincial Medical Association.
Declaration of conflicting interests
The authors declared no potential conflicts of interest with respect to the research, authorship, and/or publication of this article.
Data availability
All data and material analyzed during this study are included in this article/supplemental file. Further inquiries can be directed to the corresponding author.
Supplemental material
Supplemental material for this article is available online.
References
Supplementary Material
Please find the following supplemental material available below.
For Open Access articles published under a Creative Commons License, all supplemental material carries the same license as the article it is associated with.
For non-Open Access articles published, all supplemental material carries a non-exclusive license, and permission requests for re-use of supplemental material or any part of supplemental material shall be sent directly to the copyright owner as specified in the copyright notice associated with the article.