
Abstract
Background
Sleep disturbances often precede motor symptoms in neurodegenerative diseases like Parkinson's disease (PD) and dementia with Lewy bodies (DLB). Neuroinflammation is implicated in PD pathophysiology and may contribute to non-motor symptoms such as sleep disturbances. The Thy1-αSyn mouse model, overexpressing human alpha-synuclein (αSyn), mimics key aspects of PD and DLB, making it valuable for studying related sleep disturbances and neuroinflammatory changes.
Objective
To investigate early-stage alterations in sleep architecture, electroencephalographic (EEG) patterns, and neuroinflammation in Thy1-αSyn mice.
Methods
We used telemetric EEG/electromyography (EMG) with video surveillance to compare sleep patterns and EEG spectral power between 2.5- and 4.5-month-old male Thy1-αSyn transgenic mice and wild-type littermates. Neuroinflammation was assessed by examining microglial (Iba1) and astrocytic (GFAP) activation in key sleep-regulating brain regions.
Results
Thy1-αSyn mice showed decreased resting wake time and increased non-REM sleep, with altered sleep bout frequency and length, indicating significant sleep architecture changes. Spectral analysis revealed a shift from higher to lower frequency bands, suggesting early neural circuitry disruptions due to αSyn overexpression. Significant microglial activation was observed at 3 months, with astrogliosis progressing by 5 months in key sleep-regulating regions, indicating that neuroinflammation may contribute to the observed sleep disturbances.
Conclusions
Early-stage Thy1-αSyn mice exhibit significant sleep architecture changes, EEG spectral shifts, and neuroinflammatory alterations. These findings suggest that neuroinflammation may play a role in the initial pathophysiological changes in PD and related synucleinopathies. Sleep, EEG, and neuroinflammatory changes could serve as early biomarkers for these diseases.
Plain language summary
This study examined sleep disturbances and brain inflammation in a mouse model of Parkinson's disease at early ages of 2.5 and 4.5 months. Parkinson's disease is a brain disorder that not only causes movement problems but also debilitating sleep issues like insomnia, acting out dreams during sleep, and excessive daytime sleepiness. These sleep problems can start years before Parkinson's is diagnosed. Additionally, brain inflammation is thought to play a role in the progression of Parkinson's disease. The researchers used EEG recordings to monitor the mice's brain waves during sleep and examined brain tissues for signs of inflammation. They found that even at just 2.5 months old, the mice genetically engineered to produce too much of the protein alpha-synuclein (a hallmark of Parkinson's) had disrupted sleep patterns and early signs of brain inflammation. Compared to normal mice, they spent more time asleep during the day when they should be awake and had more fragmented sleep cycles. Their EEG readings also showed a slowing of brain waves across all sleep stages in the Parkinson's mice, indicating disrupted neural circuitry. By examining brain tissue, they found increased activity of microglia and astrocytes—cells involved in brain inflammation—in key regions that regulate sleep. These findings suggest that neuroinflammation may contribute to early sleep disturbances in Parkinson's disease. Monitoring sleep issues and neuroinflammatory changes could help detect the disease sooner and identify new treatment targets.
Keywords
Introduction
Parkinson's disease (PD) is an incurable neurodegenerative disorder affecting more than 10 million people worldwide. 1 Classical symptoms include motor impairments, 2 but patients also suffer from debilitating non-motor symptoms that can manifest years before PD diagnosis and even before the motor symptoms, including sleep disturbances.2,3 Sleep disturbances in PD patients are common, with reported frequencies ranging from 50 to 80%, 4 and include disorders such as insomnia, rapid eye movement (REM) sleep behavior disorder, and excessive daytime sleepiness.4,5 The pathogenesis of these sleep-related disorders is complex, multifactorial, and largely unknown. 6
Accumulation of the synaptic protein α-synuclein (αSyn), particularly in the brain stem, and the loss of neurons, predominantly in the substantia nigra, are the key drivers of PD.7–9 This increased accumulation of αSyn is genetically and pathologically linked to PD.9,10 Furthermore, synucleinopathies like PD and dementia with Lewy bodies (DLB) have been associated with an increased risk of seizures and epilepsy, potentially linked to the accumulation of αSyn.11–13
The Thy1-αSyn mouse model (Masliah line 61) is a highly relevant model of αSyn-induced pathology, including PD and DLB.8,14 This model has high predictive, face, and construct validity, and is important for preclinical studies. 8 Mice overexpress human αSyn and develop a PD-like neuropathological and behavioral phenotype. While motor symptoms can be detected with sensitive tests starting at 2 months of age, non-motor symptoms such as olfactory dysfunction, anxiety, and cognitive decline have been observed with onset as early as 3 months of age. 8 These symptoms progress, and by 14 months, a PD-like loss of dopamine can be observed in the striatum. 8 Previous research by McDowell and colleagues 15 identified sleep alterations in Thy1-αSyn mice at an age of 9 to 10 months. Thy1-αSyn mice showed decreased REM sleep duration, increased diurnal non-REM (NREM) sleep duration, and reduced frequency of REM sleep bouts. Of note, to our knowledge there are no further comparable studies on sleep architecture in transgenics expressing human wild-type αSyn. Kudo et al. 16 reported impaired circadian rhythm in Thy1-αSyn mice from 3–12 months of age. Furthermore, seizures and epileptiform electroencephalography (EEG) patterns have been previously reported in the Thy1-αSyn mouse model. 17
The aim of our study was to identify the onset of sleep/wake deficits in Thy1-αSyn mice using telemetric EEG/electromyography (EMG) with synchronous video surveillance, which offers translatable measures for comparisons with findings in human PD patients.18,19 We identified early sleep disruptions in Thy1-αSyn mice at 2.5 and 4.5 months of age and correlate the sleep disruptions to αSyn pathology in sleep-regulating brain nuclei by using previously published pathology datasets. 20
Emerging evidence suggests that neuroinflammation significantly contributes to the pathophysiology of PD, including non-motor symptoms such as sleep disturbances as well as seizures.21–25 Microglia and astrocytes, the primary glial cells in the central nervous system, become activated in PD, leading to neuroinflammation and neuronal dysfunction.21–25 This neuroinflammatory response may disrupt neural circuits involved in sleep regulation. Importantly, sleep regulation involves a complex network of interconnected brain regions responsible for various aspects of sleep architecture, arousal, and circadian rhythms.26–28 Alterations in these regions, potentially driven by neuroinflammatory processes, could mechanistically contribute to the sleep changes observed in PD. Despite evidence of sleep disturbances in older Thy1-αSyn mice, the onset and underlying mechanisms of these disruptions at earlier stages remain unexplored.
In this study, we aimed to identify the onset of sleep/wake deficits in Thy1-αSyn mice using telemetric EEG/EMG with synchronous video surveillance, offering translatable measures for comparison with findings in human PD patients.18,19 We identified early sleep disruptions in Thy1-αSyn mice at 2.5 and 4.5 months of age. To elucidate the underlying cellular mechanisms, we analyzed neuroinflammatory changes by examining microglial (Iba1) and astrocytic (GFAP) activation in key sleep-regulating brain regions. These findings provide insights into the potential role of neuroinflammation in the early stages of PD and its contribution to non-motor symptoms.
Methods
Animals
Thy1-αSyn mice (Masliah line 61, on a hybrid C57BL/6-DBA/2 background) were bred in-house. Non-transgenic wild-type littermates (WT) were utilized as controls. Only male mice were used in the study, had unrestricted access to standard lab chow and water, and were housed within a conventional open cage system with woodchip bedding and nesting material. Experiments were performed in a separate room to minimize disturbances for the mice. The light/dark cycle was reversed, featuring a dark (nocturnal) phase from 11:00 to 23:00 and a light (diurnal) phase from 23:00 to 11:00. All animal experiments were conducted in accordance with the guidelines of the German Animal Welfare Act and approved by the local authorities (license number: 33.19-42502-04-16/2227). The experimental unit was a single animal. Genotyping of mice was performed before weaning, and re-genotyping to guarantee correct group allocations was performed after the end of the experiment. Animals underwent analyses in four experimental cohorts. A total of 19 mice were used in the study. Each mouse was intended to be recorded at two different time points: at 2.5 months and again at 4.5 months. However, due to technical issues, it was not always possible to record at both time points for every mouse. Consequently, the sample size for the presented EEG data was: 2.5 months: 5 WT and 10 Thy1-αSyn mice; 4.5 months: 5 WT and 7 Thy1-αSyn mice. The sample size was not pre-determined in this study because it was limited by the animal protocol, but post-hoc power analysis showed that the study was sufficiently powered. Mice were allocated to experimental groups based on genotype. Random animals matching the age requirements were used in the study using an Excel sheet sorted by random numbers. Animals were randomly assigned to EEG-recording spots. There were no significant differences in body weight or other baseline characteristics between the experimental groups.
Surgeries
Two weeks before the scheduled recording period, the mice underwent surgical procedures for the implantation of electrodes and telemetry transmitters. Prior to surgery, mice were anesthetized in an isoflurane chamber. The fur on the head and shoulder regions was removed, and the animals were then carefully positioned in a stereotaxic frame, receiving isoflurane via a nose mask to maintain anesthesia throughout the procedure. Ophthalmic ointment (Bepanthen Nasen- und Augensalbe) was applied to the eyes to prevent dryness. Body temperature and depth of anesthesia were continuously monitored. Local anesthesia was administered before a telemetry transmitter was placed into a subcutaneous pocket along the dorsal flank. Electrodes for EMG were situated in the neck on the cervical trapezius muscles. To install EEG electrodes, holes were drilled into the skull at coordinates 1 mm anterior and 1 mm lateral for the negative lead, and 3 mm posterior and 3 mm lateral for the positive lead, relative to the bregma. The leads were then secured on the brain surface with screws and dental acrylic, which also sealed the skull. Incisions were sutured to both secure the electrodes and close the surgical sites. A recovery period of at least two weeks was observed before the commencement of EEG/EMG monitoring. Animals received perioperative pain management (Levomethadone, s.c.) and antibiotic treatment (Marbofloxacin, s.c.).
Surveillance system
We used a telemetry system from Data Sciences International (DSI) for EEG/EMG data acquisition. Transmitters (model HD-X02) broadcasted signals to a receiver (DSI RMC-1) located beneath the cages. This data was relayed to a DSI Matrix MX2 multi-channel acquisition system, which was then interfaced with a recording computer. The setup included recording software (LabChart 8, AD Instruments) equipped with a DSI compatibility plugin (PhysioTel CONNECT), configured to sample at 500 Hz. Additionally, we synchronized video recordings with the physiological data using the LabChart Video module.
Recordings
The study involved recording sessions of the same animal at two critical age points: at 2.5 and 4.5 months, lasting for one week at each time point. We encountered several challenges, such as issues with transmitter reliability, leading to a reduced number of animals in subsequent analyses.
Analyses
Automated EEG sleep analysis was performed using NeuroScore 3.3 (DSI). Raw EEG, EMG, and video data were reviewed using LabChart 8. The vigilance state of the mice was verified through synchronized video recordings during the tuning of automated analysis parameters. Following a trial-and-improvement method, various iterations of software settings were trialed, and the automated scorings were validated by an experienced researcher by cross-referencing with the raw signals. The final settings for automated analysis with the Rodent Sleep Scoring algorithm were as follows: Delta band 0.5–4 Hz, Theta band 6–9 Hz, slow-wave ratio 0.7, Theta ratio 2.5, EMG threshold 150 µV, and activity threshold 0.1, with an artifact threshold at 1 mV. An additional artifact rejection step employed an amplitude detector filtering signals exceeding an absolute threshold of 0.00125 V, with a duration range of 0.001 to 100 s, joined at intervals of 0.001 s. This filtering was applied to the EEG and EMG. Additionally, activity channels, which include binary data from the telemetry transmitter's activity sensor, enabled the identification of animal movements. The user manual of DSI NeuroScore is available online for details on the algorithms, but briefly, the scoring is performed in a stepwise fashion for each period. Periods with more than 10% of artifact threshold time or in case of missing signal are scored as artifacts. Activity sensor readings during the epoch result in a scoring as active wake. If the EMG signal exceeds the EMG threshold, an active wake scoring is also performed. If the theta ratio exceeds the threshold, the stage is scored as REM sleep. If the slow-wave ratio exceeds the threshold, it is scored as NREM stage. If none of the other criteria are met, the stage is scored as resting wake. All recorded days within the week-long period were used for sleep and EEG analysis. Sleep was scored using the algorithm, and data were exported for further analysis. The analysis of relative power distributions across the four sleep stages utilized a signal grid with 5-s epochs, containing the sleep stage marker and relative power periodogram for the respective frequency bands (delta (0.5–4 Hz), theta (4–8 Hz), alpha (8–12 Hz), sigma (12–16 Hz), and beta (16–24 Hz)). The averaged relative power for each sleep stage and frequency band was computed using Microsoft Excel.
Duration of sleep stages per hour was assessed using a signal grid with 1-h epochs, containing the sleep stage marker and duration of each of the four sleep stages within that hour. The data were then further processed in Excel.
For spike cluster analyses, all EEG channels of 4.5-month animals were manually analyzed in Labchart Pro 8 by an experimenter blinded to the genotype of the animals. A horizontal scaling of 1:10 was chosen and two animals were observed at the same time. Short burst spiketrains could be visually differentiated from few generalized seizures. If observed events had seizure characteristics the scaling ratio was decreased to 1:1 and the corresponding time-locked video file was watched to see if the seizure event had a behavioral correlate. The frequency of spike clusters were semi-quantitatively scored by the observer from 0 to 3, with 0 being an absence, and 1 to 3 being low, medium and high densities of this EEG pattern.
Semi-quantitative analysis of αSyn pathology in sleep networks
To assess the extent of αSyn pathology in sleep-wake related brain regions of the line 61 mouse model, we used the semi-quantitative data analyzed by Delenclos et al. 20 Authors of the study published an extensive catalog of αSyn immunohistochemical data for various brain regions at a time-point of 3–4 months.
The readout of αSyn+ cell bodies (perikarya) were used and mapped to sleep relevant regions. For each region, the abundance of αSyn+ perikarya was scored as follows: (-) none, (+) few, (++) moderate, and (+++) abundant. For brain regions directly reported in the original study, the semi-quantitative scores were assigned based on the published data. In cases where the original study did not provide specific information about a region of interest, we inferred the αSyn pathology based on the data from the nearest anatomical region or the larger brain structure encompassing the region of interest. Specifically, the staining intensity for the laterodorsal and pedunculopontine tegmental nuclei, ventrolateral periaqueductal gray, and sublaterodorsal nucleus was inferred from the data reported for the pontine tegmentum and periaqueductal gray. The staining intensity for the ventrolateral preoptic nucleus was inferred from the data reported for the preoptic area. The semi-quantitative scores were used to create a color-coded representation of αSyn pathology in the simplified scheme illustrating sleep-wake related brain regions. Red circles indicate strong (+++) perikarya staining, mid-red circles indicate moderate (++) perikarya staining, and bright red circles indicate weak (+) and blue circles absent (-) perikarya staining.
The sleep network connections for NREM and REM sleep were published by Scammell and colleagues, 26 and the pathways depicted in this review paper have been simplified in the results of the present study to illustrate sleep-relevant connections of regions with differing intensities of human αSyn expression.
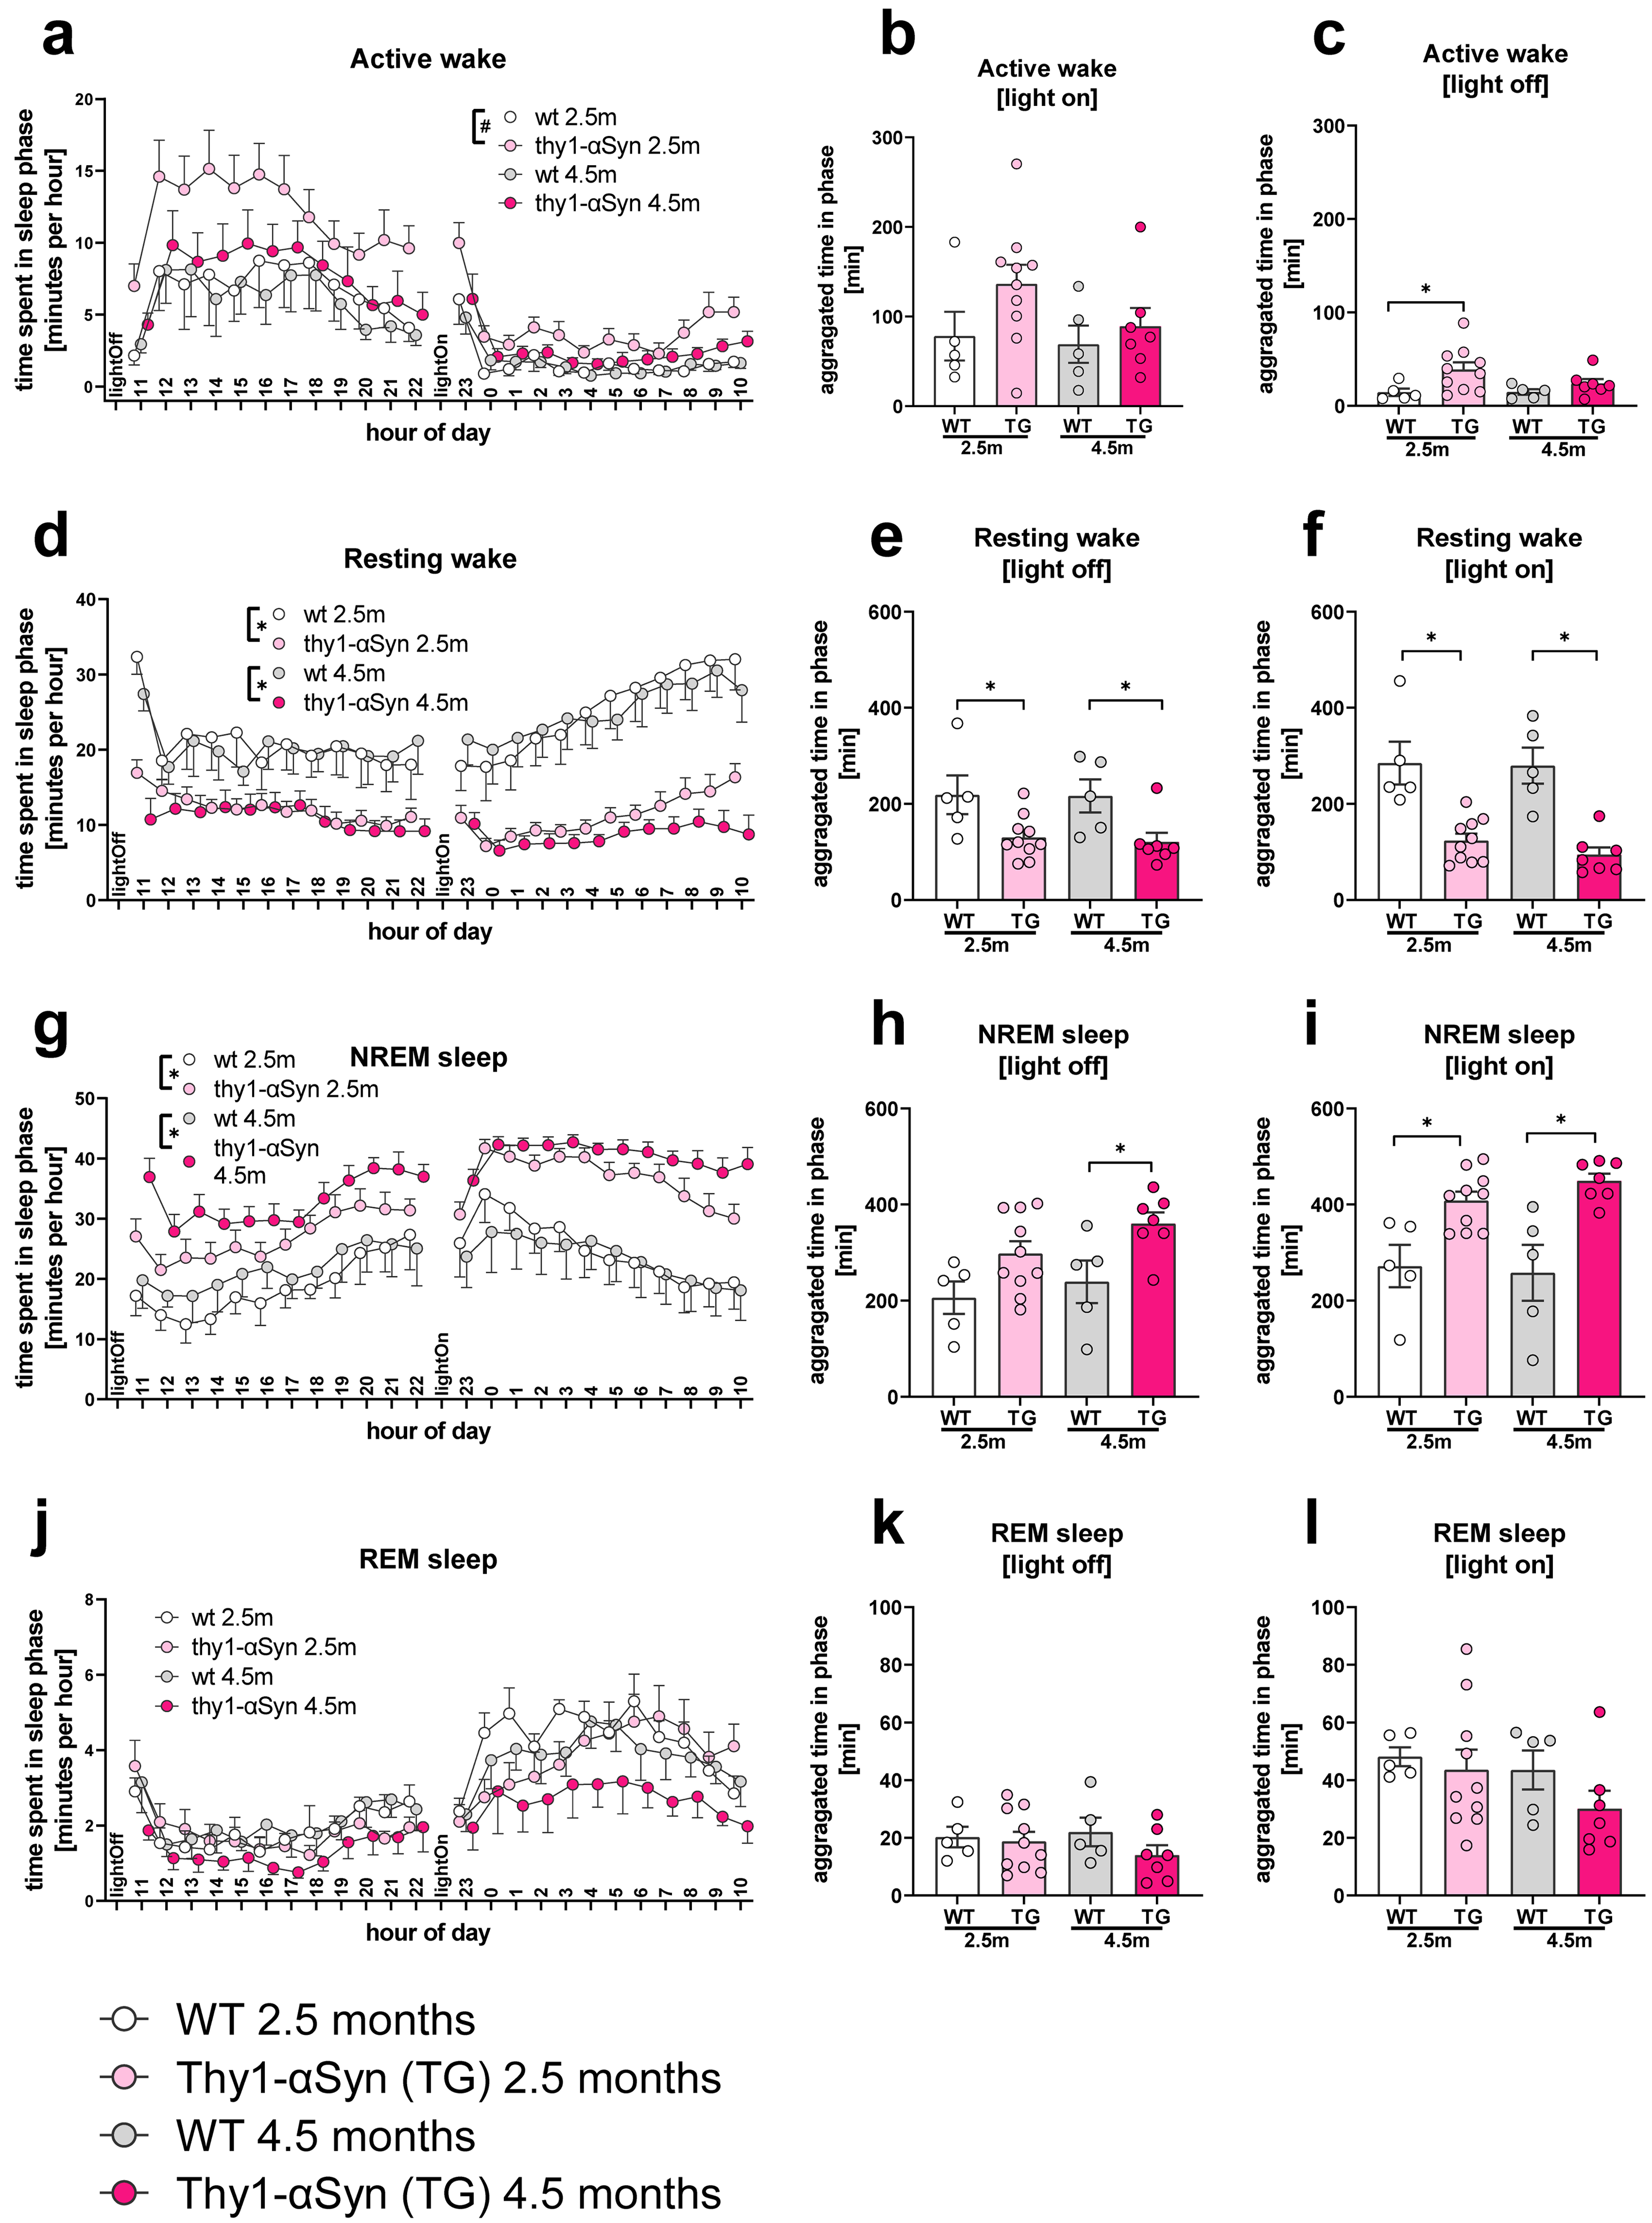
α-Synuclein over-expression changes sleep duration in different sleep stages. Panels (a, d, g, j) display hourly distribution of mean minutes per hour spent in active wake, resting wake, NREM sleep, and REM sleep, respectively, for wild-type (WT) and Thy1-αSyn (TG) mice at 2.5 and 4.5 months of age, with error bars indicating SEM. The corresponding bar graphs (b, c, e, f, h, i, k, l) summarize the aggregate time spent in each state during the dark (light off) and light (light on) phases, with individual data points representing separate mice, revealing differences in diurnal/nocturnal patterns and sleep/wake characteristics between WT and Thy1-αSyn mice across ages. Statistics: (a, d, g, j) Hourly time distributions within sleep/wake state were compared using 2-way repeated measures ANOVA of the hourly data with factors hour x genotype for 2.5 and 4.5 months separated. (b-c, e-f, h-i, k-l) Time spent in the sleep stage during light off and light on phases was compared using 2-way ANOVA of the light on or light off data with factors genotype and age (2.5 and 4.5 months) followed by a Sidak's multiple comparisons test, which is shown above the graphs if statistical differences were identified. Statistical significance was set at p < 0.05. p < 0.05 is depicted as an asterisk. A trend (p between 0.05 and 0.1) is indicated as #. Sample sizes (2.5 / 4.5 months): WT n = 5 / 5, Thy1 n = 10 / 7.
Spectral power shifts across sleep stages in Thy1-αSyn transgenic mice.
Immunohistochemistry and image acquisition
Brains from 3- and 5-month-old wild-type littermates and Thy1-αSyn animals from our biobank were used for the study. After transcardial perfusion, fixation in paraformaldehyde and incubation in 10% and 30% sucrose solutions, brains were sectioned at 40 µm thickness using a cryostat. Sections were stained for Iba1 (Ionized calcium-binding adapter molecule 1) and GFAP (Glial Fibrillary Acidic Protein), as well as NeuN or Parvalbumin to identify sleep-relevant brain regions. The primary antibodies used were rabbit anti-Iba1 (Abcam #178846, 1:500), rat anti-GFAP (Invitrogen #13-0300, 1:500), guinea pig anti-Parvalbumin (Synaptic Systems #195004, 1:1000), and guinea pig anti-NeuN (Synaptic Systems # 266004, 1:500). Secondary antibodies were goat anti-rabbit, goat anti-rat, and goat anti-guinea pig conjugated with Alexa Fluor 488, 555, or 647 (Invitrogen, 1:500), matching the primary antibody species. Sections were mounted using ProLong Gold mounting medium with DAPI.
Images were acquired using a Zeiss AxioObserver 7 microscope equipped with a Colibri 7 LED light source and an Axiocam 508 m camera, using ZEN Blue 3.1 Professional software. Whole-slice scans were obtained using a 10× objective lens with the Tiles and Positions module, allowing for comprehensive imaging of each section. Further methodological details can be found in references.29,30
Quantitative analysis
Machine learning-based segmentation of Iba1 and GFAP was performed using Ilastik software (Version 1.4.0). 31 Whole-slice images were imported into the software, and separate trainings for each cell type were performed by an experienced experimenter. The machine learning algorithms were trained to segment cell bodies of Iba1+ and GFAP+ cells, generating segmentation probability maps.
Scanned images were opened in Fiji (ImageJ), and regions of interest (ROIs) corresponding to specific brain regions were drawn for each animal and saved. The probability maps were loaded into Fiji, and thresholding (“Minimal” for Iba1 and “Otsu” for GFAP) was applied to convert them into binary images. Subsequent processing steps included erosion (1 px), dilation (1 px), and watershed segmentation (only for Iba1). The Particle Analyzer was then used to count the number of Iba1+ cells with a minimum size filter of 60 µm². Additionally, the area covered by Iba1 and GFAP (percentage area) for each ROI was measured, along with mean fluorescence intensity. The measured area was used to calculate cell density (Iba1+ cells per mm²). For quality control, a blinded experimenter measured and counted random regions to ensure the reliability of this workflow.
Statistics
For statistical analysis, we utilized Graphpad Prism Version 9, which enabled graph generation and statistical calculations. A repeated measure or regular 2-way ANOVA was employed to compare datasets containing two variables, specifically genotype versus timepoint, age-group, or frequency bands. A Sidaks post-hoc test was used afterwards. The results of the 2-way ANOVA are presented in the results section. Note that the abbreviations 2.5 m and 4.5 m have been used for the 2.5- and 4.5-month time points in these statistical descriptions. A Fishers exact test was used to test for differences of animals with and without electrographic seizures. Mann-Whitney U-test was applied for comparison of multispike frequency score data. A Receiver-Operator-Characteristics (ROC) analysis was performed for evaluating the capability of multispike-frequency scores for genotype differentiation. Histological data (Iba1 and GFAP) were compared using the Mann-Whitney U test after identifying a non-normal distribution with the Shapiro-Wilk test. Comparisons were always between WT and Thy1-αSyn animals. Statistical significance was ascribed to p-values less than 0.05, denoted with an asterisk (*). A trend (p between 0.05 and 0.1) was indicated as #. Scientists performing surgeries, recording and EEG-analyses were blinded to the genotype. Experimenters were unblinded post analysis. No randomization was used during analysis.
Results
α-synuclein over-expression changes sleep duration in different sleep stages
The typical sleep-wake architecture of mice comprises four stages: active wake, resting wake, REM sleep and NREM sleep. Both sleep stages occur more often in the light-on diurnal or resting period, while wakefulness is more common in the light-off nocturnal or active period. However, all four sleep stages can be observed throughout the 24-h cycle. Using telemetric EEG/video surveillance, we observed the sleep patterns of mice over multiple days and revealed a clear nocturnal-diurnal rhythm in both the 2.5-month-old and the 4.5-month-old mice (Figure 1). For instance, there was an increase in the duration of the active wake stage during the nocturnal (light-off) period and an increase in REM sleep during the diurnal (light-on) period (Figure 1). To understand changes in sleep architecture in the Thy1-αSyn model, we compared the average duration of each sleep/wake stage in Thy1-αSyn mice with their WT littermates. This comparison involved assessing the overall hourly dynamics (Figure 1(a), (d), (g), (j)) as well as the duration of these stages during both the diurnal resting and nocturnal active periods (Figure 1(b), (c), (e), (f), (h), (i), (k), (l)), revealing changes in sleep architecture.
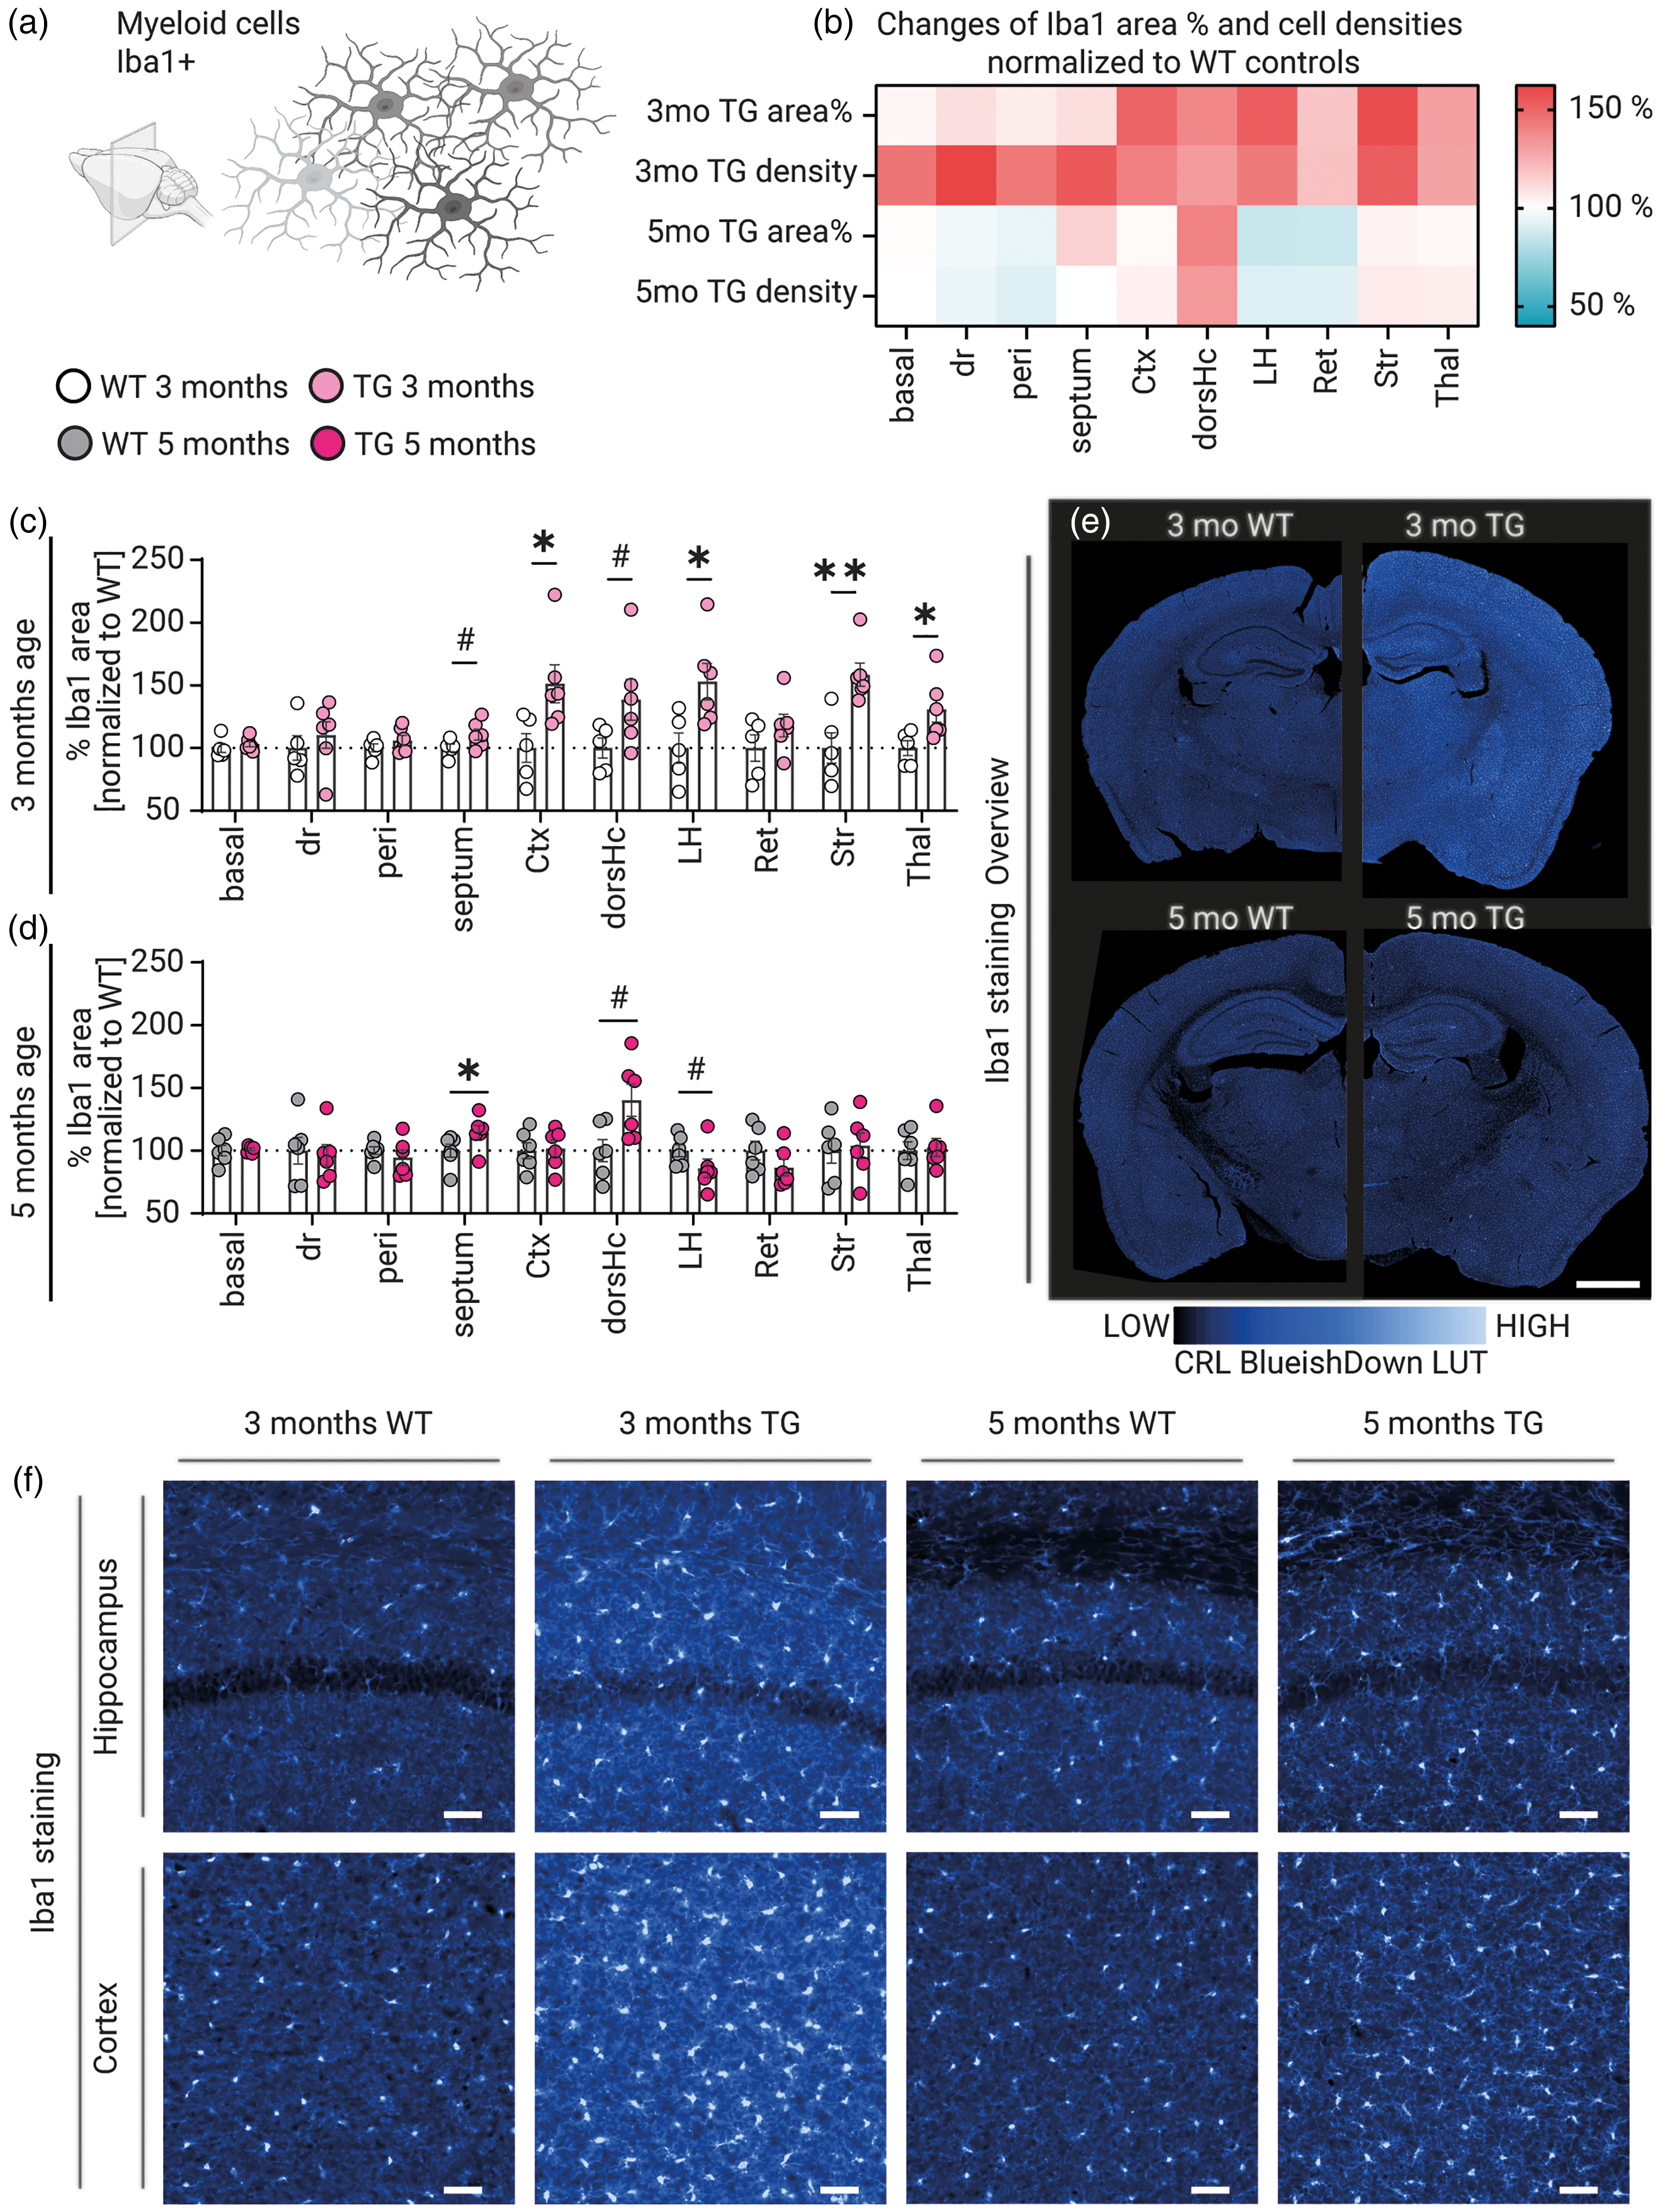
Age-dependent changes in microglial morphology and density in Thy1-αSyn mice. Panels (a-f) demonstrate alterations in microglial (Iba1+) characteristics between wild-type (WT) and Thy1-αSyn (TG) mice at 3 and 5 months of age. (a) Descriptive illustration of Iba1+ myeloid cells, created using BioRender.com. (b) Heatmap showing changes in Iba1+ area percentage and cell densities across brain regions, normalized to WT controls. (c, d) Quantification of Iba1+ area percentage normalized to WT controls at 3 months (c) and 5 months (d) across different brain regions, with individual data points representing separate mice. (e) Overview of Iba1 immunostaining in coronal brain sections comparing WT and TG mice at both age points, with intensity represented using a magma lookup table (LUT). (f) High-magnification images of Iba1 staining in hippocampus and cortex regions across all experimental groups, demonstrating region- and age-specific differences in microglial distribution and morphology. Scale bars: 1000 or 50 μm. Statistics: Data were analyzed using Mann-Whitney U tests between WT and TG animals in their respective brain regions. Statistical significance was set at p < 0.05. p < 0.05 and p < 0.01 are depicted as * and **, respectively. A trend (p between 0.05 and 0.1) is indicated as #. Basal: basal forebrain; dr: dorsal raphe; peri: periaqueductal gray; Ctx: cortex; dorsHc: dorsal hippocampus; LH: lateral hypothalamus; Ret: reticular nuclei of thalamus; Str: striatum; Thal: thalamus.
In the 2.5-month Thy1-αSyn group, there was an observable increase in the active wake stage (Figure 1(a) to (c)). Although hourly data analysis indicated only a trend (2-way ANOVA, genotype effect p = 0.0812), a significant difference emerged during the light-on diurnal period (2-way ANOVA, genotype effect: p = 0.02; post hoc Sidaks test for 2.5 m genotype showed p = 0.03). A notable inversion was seen between Thy1-αSyn and WT mice in both the resting wake and NREM stages at both time points. Thy1-αSyn mice spent less time in resting wake (Figure 1(d)) but more in NREM sleep (Figure 1(g)). This was confirmed by 2-way ANOVA results for both stages at 2.5 months and 4.5 months (2.5 m resting wake: 2-way ANOVA, genotype effect: p = 0.01; 4.5 m resting wake: 2-way ANOVA, genotype effect: p = 0.0123; 2.5 m NREM sleep: 2-way ANOVA, genotype effect: p = 0.01; 4.5 m NREM sleep: 2-way ANOVA, genotype effect: p = 0.01). The diurnal and nocturnal periods showed similar patterns although with significant differences (Figure 1(e) to (f), (h) to (i)).
Interestingly, REM sleep duration was not decreased in 2.5-month-old Thy1-αSyn mice compared to WT, indicating that this phenotype observed at 9- to 10-months of age develops with disease progression. As expected, there was a general difference in REM sleep durations between nocturnal and diurnal periods for both Thy1-αSyn and WT at 2.5 months (2-way ANOVA, light-period effect: p = 0.0001; genotype effect: p = 0.6). Of note, at 4.5 months Thy1-αSyn mice showed a trend to decreased REM sleep duration, supporting our notion of a developing phenotype (2-way ANOVA, light-period effect: p = 0.01; genotype effect: p = 0.07; post hoc Sidaks test for WT showed p = 0.04 and for Thy-αSyn showed p = 0.07).
Altered sleep bout characteristics in Thy1-αSyn transgenic mice
To learn more about the fragmentation of sleep stages, we analyzed the frequency and mean duration of sleep stage bouts (Supplemental Figures 1 and 2). This analysis, conducted hourly over the 24-h cycle and in more detail for the diurnal and nocturnal periods, provided insights into the sleep-wake transition patterns in Thy1-αSyn and WT mice.
We observed that active wake bouts were more frequent in 2.5-month-old Thy1-αSyn mice (Supplemental Figure 1(a), 2-way ANOVA, genotype effect p = 0.05). This difference was particularly pronounced during the diurnal period for the 2.5-month group (Supplemental Figure 1(c), 2-way ANOVA genotype effect: p = 0.01; post hoc Sidaks test for 2.5m showed p = 0.01). Although a similar trend was apparent in the 4.5-month groups, it did not reach statistical significance (Supplemental Figure 1(a) and (c)). The frequency of resting wake and REM sleep stages showed no significant differences between the genotypes (Supplemental Figure 1(d) to (f), (i) to (k)).
However, the NREM sleep stage displayed notable variations in the 2.5-month Thy1-αSyn group compared to their WT counterparts. These mice exhibited an increased frequency of NREM sleep bouts both across the 24-h cycle (2-way ANOVA genotype effect: p = 0.01) and specifically during the nocturnal period (Supplementary Figure 1(f) and (g), 2-way ANOVA genotype effect: p = 0.01; post hoc Sidaks test for 2.5 m showed p = 0.02). Interestingly, these differences were not evident in the 4.5-month group or during the diurnal period (Supplemental Figure 1(f) to (h)).
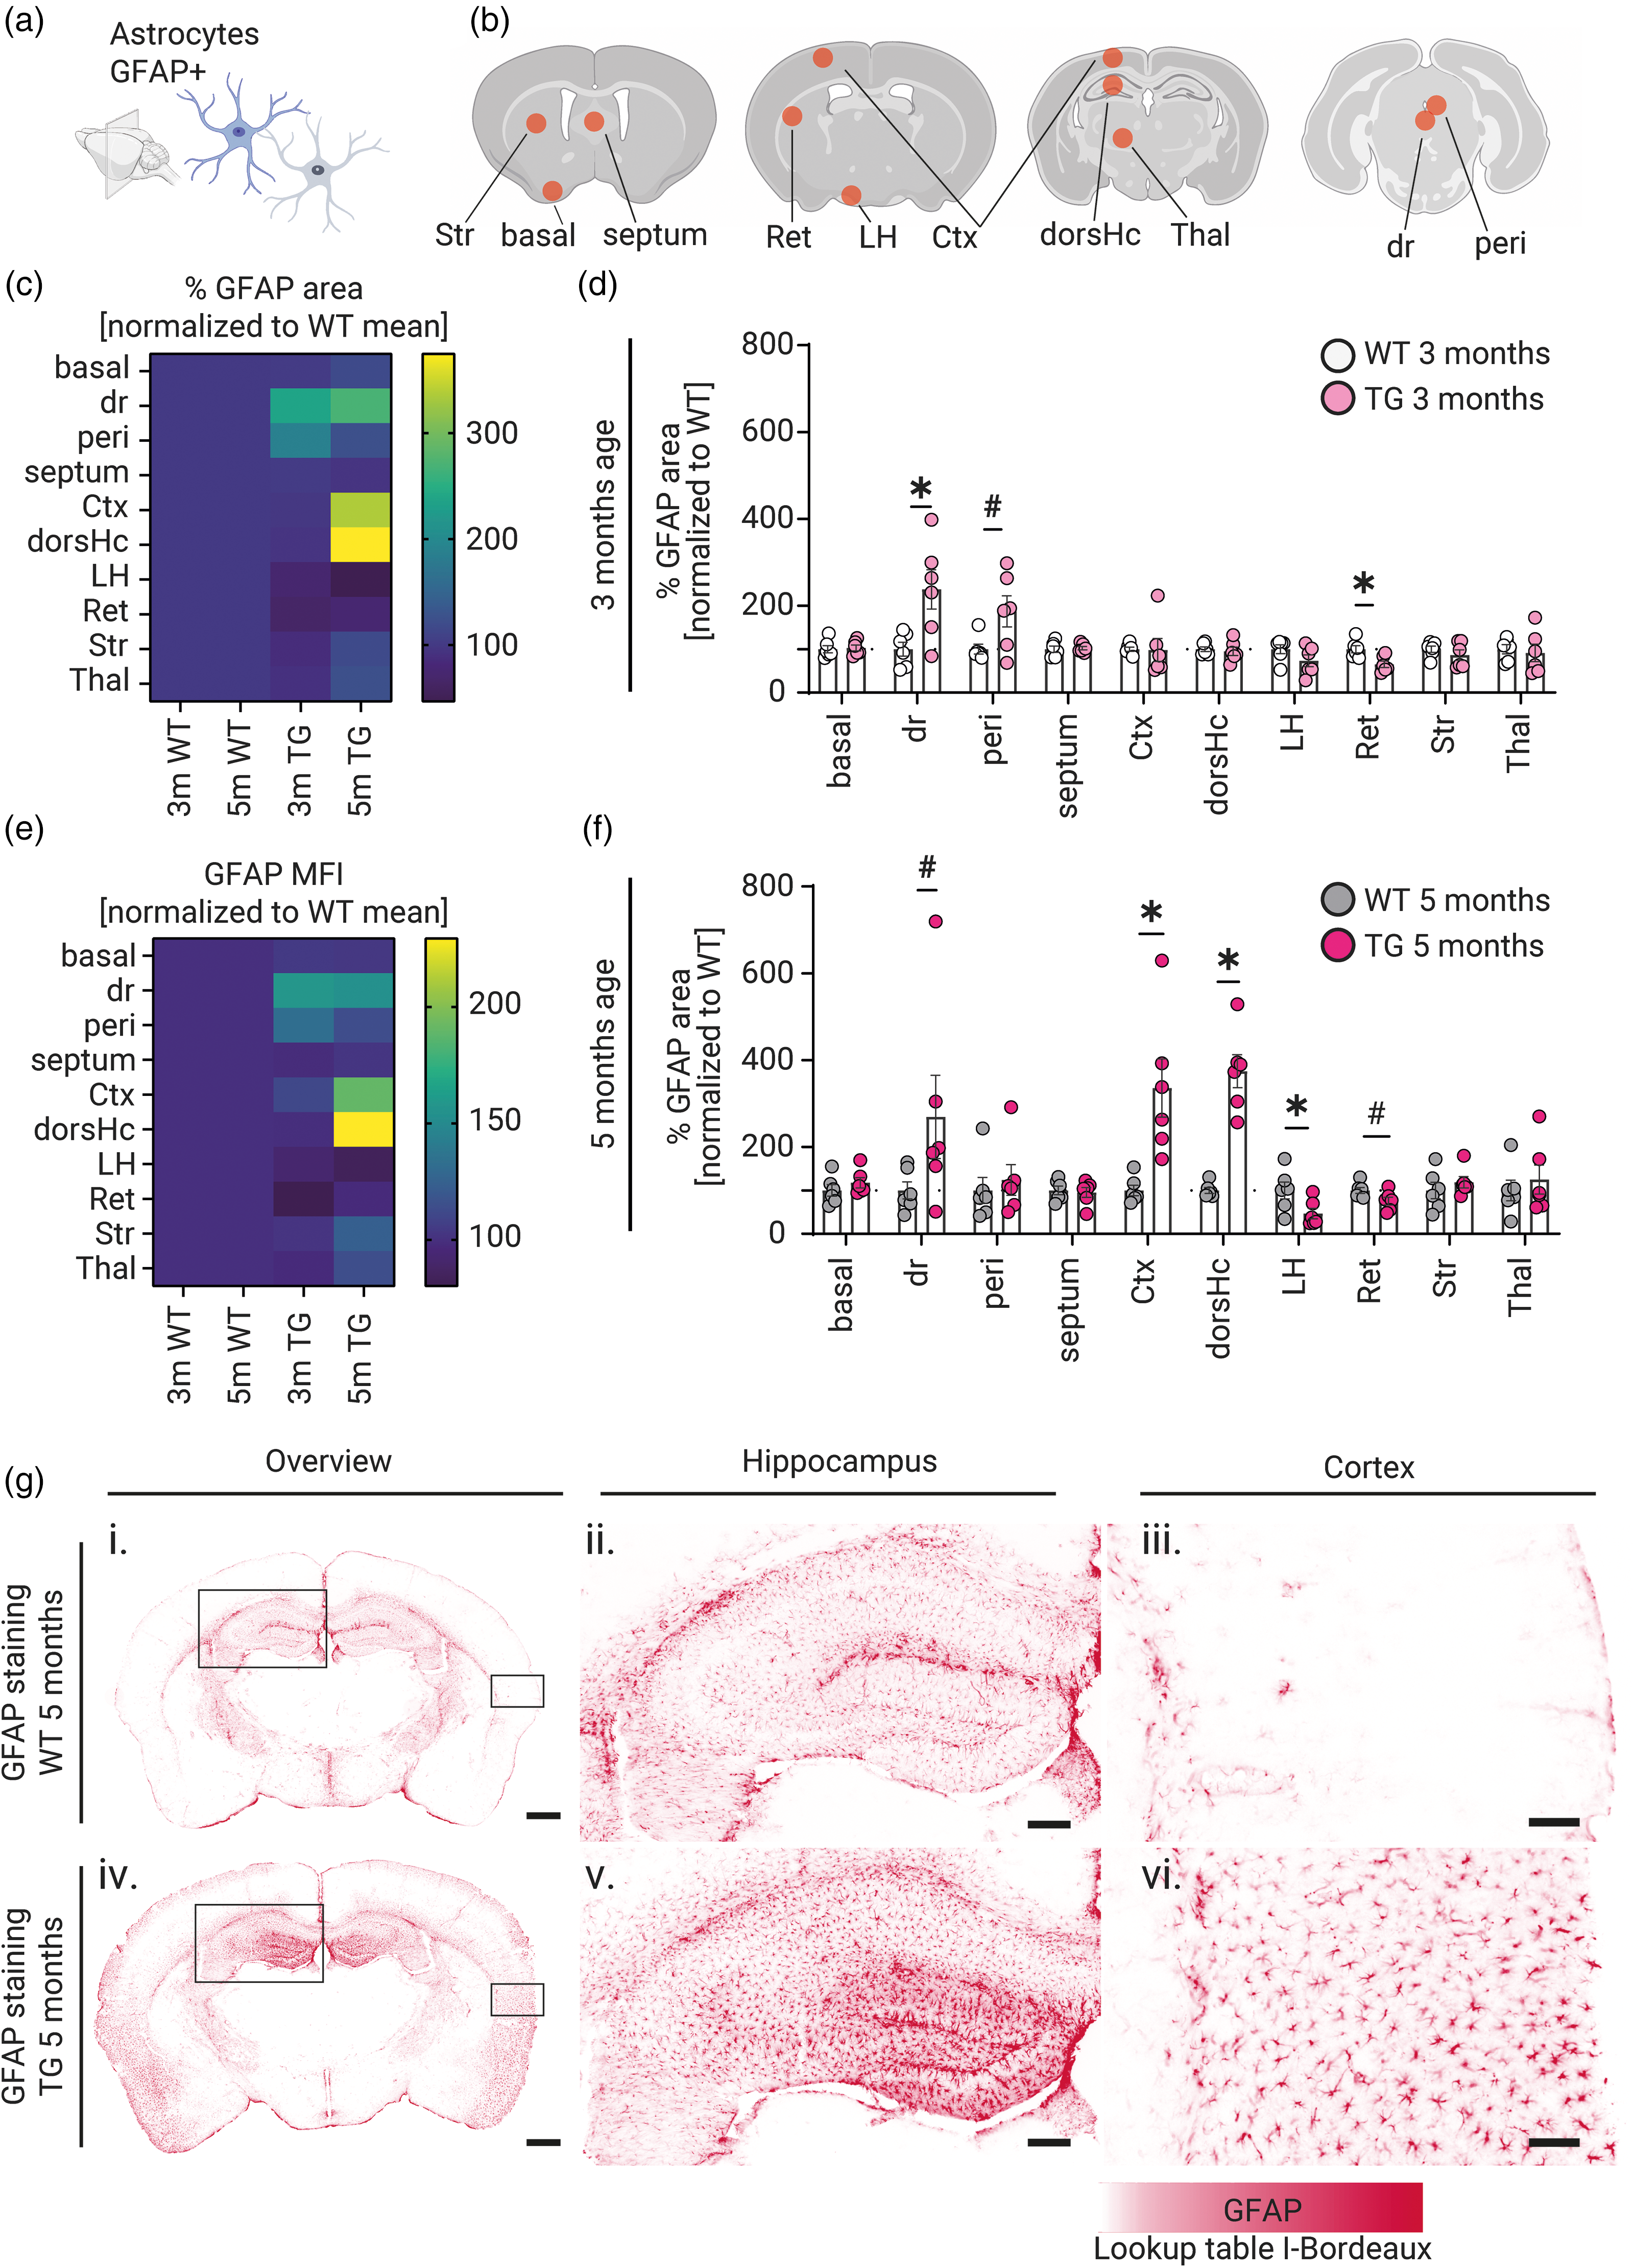
Region-specific astrogliosis in Thy1-αSyn transgenic mice revealed by GFAP expression analysis. (a) Descriptive illustration of GFAP+ astrocytes. (b) Location illustrations of brain regions analyzed. (a and b) were created using BioRender.com. Panels (c, e) show heatmap representations of GFAP area percentage and mean fluorescence intensity (MFI) respectively, normalized to wild-type (WT) controls across different brain regions at 3 and 5 months of age. Corresponding quantitative analyses of GFAP area percentage normalized to WT controls are presented for 3-month-old (d) and 5-month-old (f) mice across various brain regions, with individual data points representing separate mice. (g) Representative GFAP immunostaining images showing: (i, iv) overview of coronal brain sections from WT and Thy1-αSyn (TG) mice at 5 months, with boxed regions indicating areas shown at higher magnification; (ii, v) detailed views of hippocampal regions; and (iii, vi) higher magnification of cortical regions. GFAP intensity is visualized using the i-Bordeaux lookup table. Scale bars: (i, iv) 500 μm; (ii, v) 200 μm; (iii, vi) 50 μm. Statistics: Data were analyzed using Mann-Whitney U test between WT and TG animals in their respective brain region. Statistical significance was set at p < 0.05. p < 0.05 is depicted as *. A trend (p between 0.05 and 0.1) is indicated as #. Basal: basal forebrain; dr: dorsal raphe; peri: periaqueductal gray; Ctx: cortex; dorsHc: dorsal hippocampus; LH: lateral hypothalamus; Ret: reticular nuclei of the thalamus; Str: striatum; Thal: thalamus.
The mean lengths of sleep bouts, which are closely tied to the duration of the sleep stages (Supplemental Figure 2), revealed further intriguing patterns. In the 2.5-month group, active wake bouts showed a tendency towards increased length over the 24-h cycle (Supplemental Figure 2(a)), with this difference becoming statistically significant during the nocturnal period (Supplemental Figure 2(b)). However, older mice did not exhibit significant alterations in the length of active wake bouts (Supplemental Figure 2(a) and (c)). Contrasts were more pronounced in resting wake and NREM sleep bout lengths between WT and Thy1-αSyn groups for both age groups (Supplemental Figure 2(d) to (h)). Specifically, Thy1-αSyn mice had shorter resting wake bouts but longer NREM sleep bouts, a finding that underscores a shift in their sleep architecture (resting wake 2-way ANOVA 2.5 m 24h-cycle genotype effect p = 0.01; 4.5 m genotype effect p = 0.01; NREM sleep 2-way ANOVA 2.5 m 24h-cycle genotype effect p = 0.01; 4.5 m genotype effect p = 0.01). In terms of REM sleep, no differences were noted between the groups and time points (Supplemental Figure 2(i) to (k)).
Spectral power shifts across sleep stages in Thy1-αSyn transgenic mice
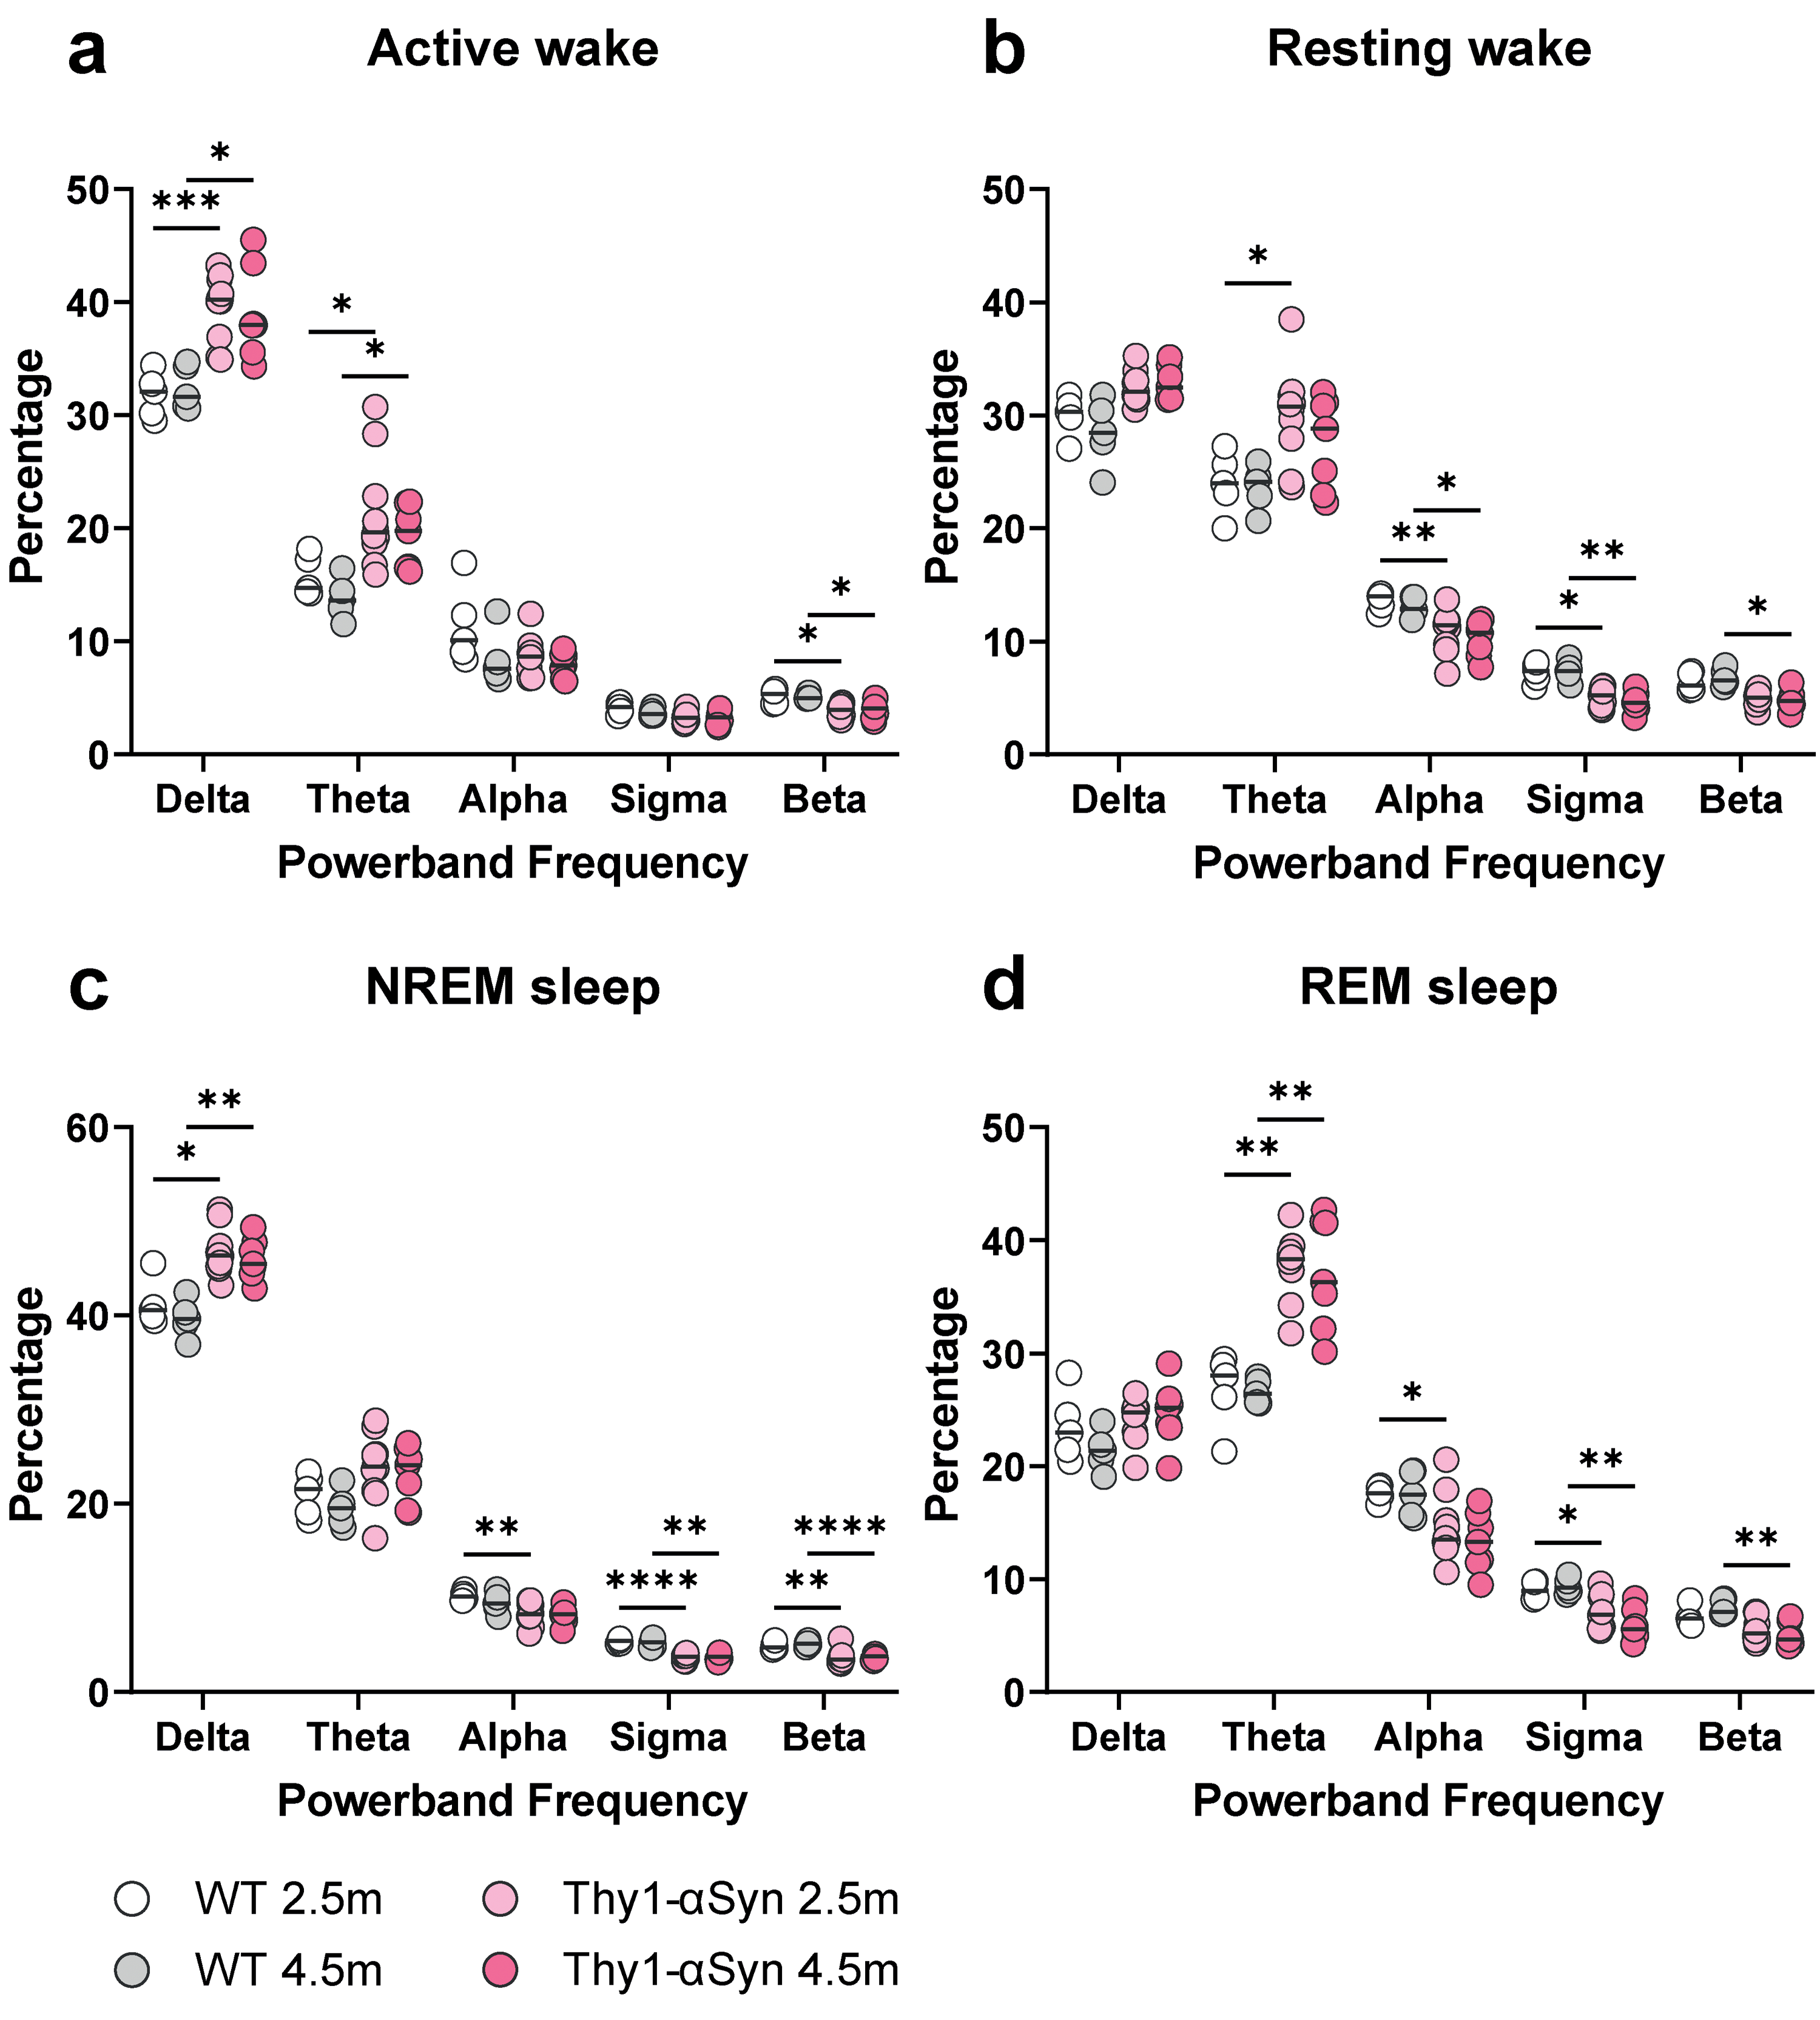
In addition to analyzing the duration of sleep stages and bout characteristics, we explored the relative spectral power changes between Thy1-αSyn and WT mice across different sleep stages (Figure 2). EEG signals can be decomposed into frequency bands, each associated with specific brain states: delta (0.5–4 Hz, predominant during NREM sleep), theta (4–8 Hz, increase during REM sleep and active wakefulness, linked to memory processes), alpha (8–12 Hz, relaxed wakefulness), sigma (12–16 Hz, sleep spindles in NREM sleep), and beta (16–30 Hz, active wakefulness, attention, and anxiety states). The analysis involved examining the relative power distribution within each vigilance state across delta, theta, alpha, sigma, and beta frequency bands.
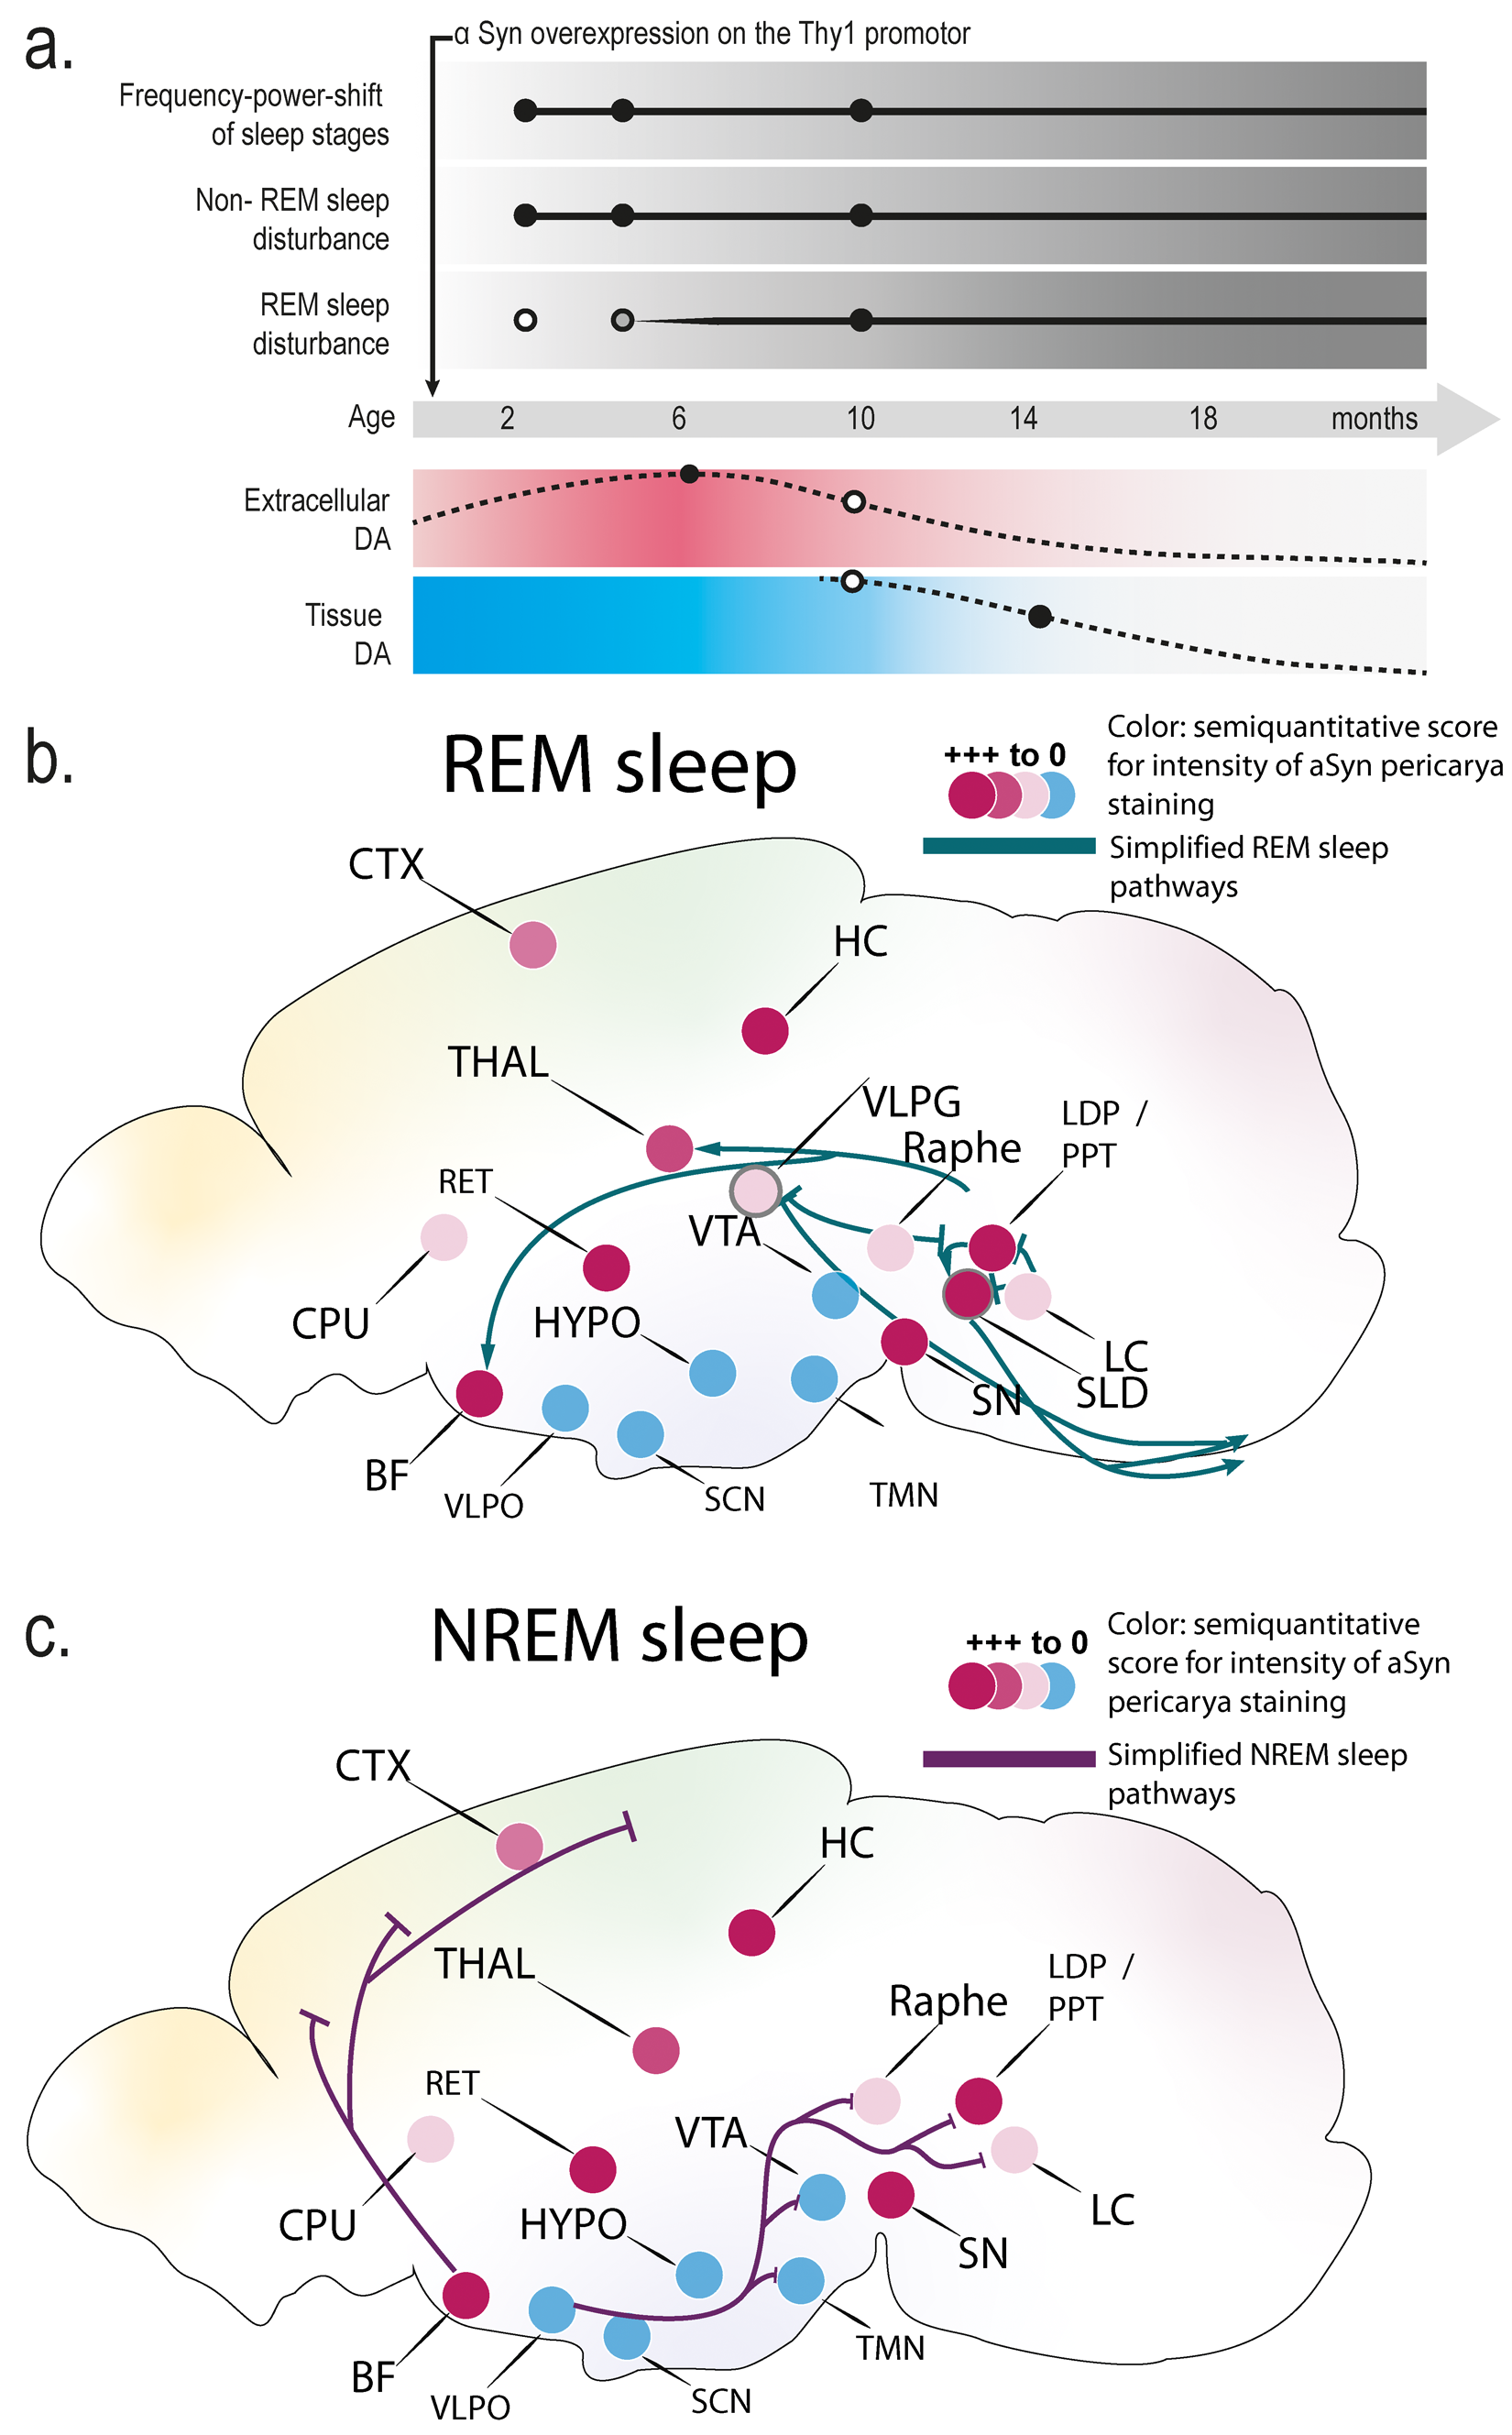
Simplified scheme of model timeline of sleep changes and key brain regions and pathways involved in the regulation of NREM and REM sleep with color-coded representation of α-synuclein (αSyn) pathology in the Thy1-αSyn PD mouse model. Information on αSyn pathology is derived from Delenclos et al., 20 and details on the sleep circuits are based on Scammell et al. 26 (a) Schematic representation of model timeline of EEG/sleep changes in Thy1-αSyn mice. The figure depicts the timeline of frequency-power shifts in the different sleep stages and NREM and REM sleep disturbances described in relation to age and dopamine dynamics (extracellular and tissue dopamine levels) in the animal model.8,14 At 2.5 months, frequency-power shifts and NREM sleep changes are observed in the model (black-filled circles). At 4.5 months, a trend towards REM sleep changes (gray-filled circle) is seen. The REM sleep disturbances are pronounced at 8–10 months of age as described by McDowell and co-workers, 15 along with changes in power distribution in the different frequency bands and non-REM sleep (black-filled circles). (b) REM sleep-promoting pathways and regions. The sublaterodorsal nucleus (SLD) plays a central role in REM sleep regulation, receiving inputs from the laterodorsal and pedunculopontine tegmental nuclei (LDP/PPT) and sending projections to the ventromedial medulla and spinal cord to induce muscle atonia. The ventrolateral periaqueductal gray (VLPG) and raphe nuclei (Raphe) inhibit REM sleep by suppressing SLD activity. Other REM sleep-related regions include the ventral tegmental area (VTA), hypothalamus (HYPO), and basal forebrain (BF). (c) NREM sleep-promoting pathways and regions. The ventrolateral and median preoptic nuclei (VLPO) are crucial for NREM sleep initiation and maintenance, inhibiting wake-promoting regions such as the tuberomammillary nucleus (TMN), locus coeruleus (LC), and raphe nuclei. The suprachiasmatic nucleus (SCN) regulates the circadian timing of sleep and wake. Other NREM sleep-related regions include the hypothalamus (HYPO), basal forebrain (BF), and reticular thalamic nucleus (RET). (b-c) Color-coded circles represent the semi-quantitative intensity of αSyn pathology (perikarya staining) in the Thy1-αSyn mouse model, derived from Delenclos et al. 20 Red indicates strong staining (+++), lighter red shades indicate moderate or weak staining (++/+), and blue indicates no (-) staining. Staining intensity for the laterodorsal and pedunculopontine tegmental nuclei (LDT/PPT), VLPG, and SLD is inferred from the pontine tegmentum and periaqueductal gray regions reported in the original study. Staining intensity for the VLPO is inferred from the preoptic area. Regions directly reported in the original αSyn study include the VTA, HYPO, BF, raphe nuclei, TMN, LC, and SCN. CTX: cortex; HC: hippocampus; CPU: caudate-putamen; THAL: thalamus; SN: substantia nigra.
Our analysis revealed a general shift in power from higher to lower frequency bands in Thy1-αSyn mice at both 2.5-month and 4.5-month time points, suggesting a slowing of the EEG, noticeable across all four sleep stages (Figure 2(a) to (d)). Specifically, in the active wake stage, Thy1-αSyn animals showed an increased relative power in the delta and theta bands, alongside a decrease in the beta band (Figure 2(a); 2-way ANOVA interaction effect: p < 0.0001, genotype effect: p < 0.0001; post hoc Sidaks test). Notably, these changes varied between individual time-points.
During the resting wake stage, a significant increase in theta band power was observed in 2.5-month-old Thy1-αSyn animals (Figure 2(b); 2-way ANOVA interaction effect: p < 0.0001, genotype effect: p = 0.17; post hoc Sidaks test). Concurrently, there were decreases in alpha, sigma, and beta band powers for both age groups in Thy1-αSyn mice (Figure 2(b)). In the NREM sleep stages, Thy1-αSyn mice exhibited an increase in delta band power at both time-points (Figure 2(c); 2-way ANOVA interaction effect: p < 0.0001, genotype effect: p = 0.05; post hoc Sidaks test). Additionally, there was an increase in theta band power in Thy1-αSyn mice of both age groups in NREM and REM stages (Figure 2(c) and (d); REM sleep 2-way ANOVA interaction effect: p < 0.0001, genotype effect: p = 0.01; post hoc Sidaks test). We also noted decreases in power across alpha, sigma, and beta bands for most of the band-group combinations (Figure 2(c) and (d)).
Seizure-like activity
While our primary focus was on sleep changes, we also noted the occurrence of seizures and seizure-like activity in the EEGs (Supplemental Figure 3). We quantified the occurrence of seizures and epileptiform activity in a subgroup of animals at 4.5 months and observed electrographic seizures in 44% of Thy1-αSyn mice (4 of 9 mice) with a varying frequency from 1 to 5 seizures per animal per week. We did not observe electrographic seizures in WT mice, and occurrence of seizures did not differ significantly between groups (Fisher's exact test p = 0.1). Additionally, we found spikes, sharp waves, and multispike patterns in the EEG of both genotypes within this subgroup (Supplemental Figure 3). Such events were characterized by a series of brief, high-amplitude, sharp waveforms occurring in rapid succession, often with a duration of less than 100 ms and an amplitude exceeding background activity by at least three times. A more detailed analysis of frequencies of multispike electrographic patterns revealed a significant increase in patterns in Thy1-αSyn mice at 4.5 months of age (Supplemental Figure 3(b)). ROC analysis provided further insights into the potential of these measurements to differentiate between Thy1-αSyn and WT mice, with an area under the curve (AUC) of 0.82 (95%CI: 0.58–1.000; Supplemental Figure 3(c)).
Given these functional disturbances in sleep architecture and seizure susceptibility, we investigated whether underlying neuroinflammatory processes might contribute to these phenotypes.
Microglial activation shows temporal and regional specificity
To investigate neuroinflammatory changes in the Thy1-αSyn mouse model, we analyzed microglial activation by assessing Iba1 immunoreactivity across various brain regions at 3 and 5 months of age (Figure 3). Microglia are the resident immune cells of the central nervous system, and their activation is a hallmark of neuroinflammatory processes associated with neurodegeneration. At 3 months, Thy1-αSyn mice exhibited significant increases in Iba1+ area (% area) compared to WT controls in multiple brain regions (Figure 3(b) and (c)). Specifically, significant increases were observed in the: Cortex, Lateral hypothalamus, Striatum, and Thalamus (p < 0.05). There were also trending increases (p < 0.1) in the dorsal hippocampus and septum. Quantification of Iba1+ cells revealed similar patterns (Figure 3(b)). High-magnification images revealed increased microglial density and morphological changes suggestive of an activated state in the hippocampus and cortex of Thy1-αSyn mice (Figure 3(e) and (f)). At 5 months, microglial changes were more modest (Figure 3(b) and (d)). A significant increase in Iba1+ area was observed only in the septum (p < 0.05), with trending increases in the dorsal hippocampus and lateral hypothalamus. These findings suggest that microglial activation is more pronounced at earlier stages and may partially normalize over time.
Overall, the data indicate an early, region-specific microglial response in Thy1-αSyn mice, which could contribute to the initial neuroinflammatory processes associated with PD pathology.
Astrogliosis progresses with disease advancement
We next assessed astrocyte activation by examining GFAP immunoreactivity, a marker of astrogliosis, in various brain regions at 3 and 5 months of age (Figure 4). Astrocytes play a crucial role in maintaining neuronal homeostasis, and their reactive changes can influence disease progression. At 3 months, significant increases in GFAP+ area were observed in: the dorsal raphe nucleus and reticular nucleus of the thalamus (p < 0.05). There was also a trending increase in the periaqueductal gray (p < 0.1) (Figure 4(a) to (d)). These regions are involved in sleep regulation and arousal, suggesting early astrocytic responses in areas relevant to the observed sleep disturbances. At 5 months, astrogliosis became more widespread (Figure 4(c) to (f)). Significant increases in GFAP+ area were found in the Cortex, dorsal hippocampus and lateral hypothalamus (p < 0.05). Trending increases were also noted in the dorsal raphe nucleus and reticular formation. Heatmap analysis of GFAP mean fluorescence intensity (MFI) revealed the highest intensity changes in the dorsal hippocampus and cortex, particularly at 5 months (Figure 4(e)). Histological images showed increased GFAP+ cell density and enhanced astrocytic branching in the hippocampus and cortex of Thy1-αSyn mice compared to WT controls (Figure 4(g)). These findings indicate a progressive pattern of astrogliosis in Thy1-αSyn mice, with more widespread changes occurring as the disease advances. The regions showing significant astrocytic activation are key components of the sleep-wake regulatory network, suggesting that astrogliosis may contribute to the sleep disturbances observed.
Discussion
This study explored early-stage sleep and EEG alterations in Thy1-αSyn mice to define the onset of specific alterations previously reported in older animals, to correlate sleep deficits to αSyn pathology 15 and to investigate underlying neuroinflammatory mechanisms. Our key findings reveal significant shifts in sleep architecture and EEG spectral power as early as 2.5 months, with an emphasis on increased NREM sleep and decreased resting wake states, alongside more active wakefulness during the diurnal period. Although REM sleep changes were not significantly altered at 2.5 months, a trend towards reduction was noted by 4.5 months, suggesting a delayed onset compared to other sleep stages. These observations are paralleled by EEG changes, notably a shift towards lower frequency bands across all sleep stages, indicating profound neural circuit disruptions. αSyn pathology is present in key sleep-regulating brain regions in young Thy1-αSyn mice, providing a potential mechanism. In addition, we observed early and region-specific neuroinflammatory changes – microglial activation and astrogliosis – in key sleep-regulating brain regions of Thy1-αSyn mice. These findings suggest that neuroinflammation may contribute to the observed sleep disturbances and EEG alterations.
A previous study on sleep alterations in Thy1-αSyn mice was conducted in 9- to 10-month-old animals, and REM sleep disruptions, among other sleep disturbances, were evident. 15 In this model of synucleinopathies, human αSyn expression under the Thy-1 promotor begins in the first weeks postnatally, with αSyn-related pathology subsequently occurring in various brain regions as the mice age. 32 As in PD, dopamine homeostasis is altered, initially characterized by increased extracellular dopamine levels that peak at 6 months (Figure 5). 8 Pathology progresses into a decline in striatal dopamine levels, which is significant at 14 months of age. Thus, at the age up to 5 months investigated in this study, Thy1-αSyn mice represent the pre-manifest/prodromal phase of PD. In line with observations in PD patients, this model presents with non-motor symptoms such as constipation, olfactory deficits or anxiety during this phase, together with progressive motor deficits in challenging tests. 8
Initial elevation in extracellular dopamine levels typically manifests as hyperactivity, which may underlie the observed active wake states.8,15 Of note, hyperactivity may introduce noise, artifacts, or secondary alterations to the EEG data, which required careful analysis by a trained observer.
Although differences in extracellular and tissue dopamine levels may have a direct impact on sleep architecture, the consistent presence of sleep disturbances in this synucleinopathy model starting at 2.5 months of age suggests additional underlying mechanisms. Notably, we found significant microglial activation and astrogliosis in sleep-regulating brain regions at early disease stages. Microglial activation was prominent at 3 months in regions such as the cortex, lateral hypothalamus, striatum, and thalamus, while astrogliosis showed a progressive pattern with significant changes by 5 months in the cortex, dorsal hippocampus, and lateral hypothalamus. These neuroinflammatory changes may disrupt neural circuits involved in sleep regulation, contributing to the observed sleep disturbances. 20
Separate research by Kudo and colleagues 16 assessed circadian activity in Thy1-αSyn mice using wheel running, revealing disruptions at as early as 3–4 months of age. These mice exhibited impaired circadian rhythms, with fragmented activity and rest cycles that continued to deteriorate until the study's conclusion at 12 months. Furthermore, another study of a PD mouse model harboring the mutated human A53 T αSyn variant reported similar early sleep changes, characterized by increased wakefulness, reduced NREM and REM sleep, and delayed sleep onset during the quiescent phase. 33 These changes, observable from as early as 3–4 months, became more pronounced as the mice aged, underscoring sleep dysfunction as an early and enduring characteristic of these models.
Thus, there are important similarities in sleep/wake stage alterations between our findings in young Thy1-αSyn and those observed in 9–10 months old mice, 15 but we also noted significant differences in diurnal/nocturnal distributions and resting wake states. These differences could stem from the progressive nature of sleep disturbances, linked to αSyn accumulation in various brain regions and associated inflammatory processes such as increased microglia activity and cytokine levels which develop with disease progression in this model.
Our observations of shifts in EEG spectral power towards lower frequency bands across all four sleep stages at 2.5 months of age corroborate findings by McDowell and co-workers 15 in 9–10 month-old mice and Morris et al., 17 who studied mice aged 4 to 8 months. These studies highlighted an increase in delta and theta band power alongside a decrease in alpha, sigma, and beta bands, underscoring profound changes in sleep architecture driven by elevated neuronal αSyn expression. Additionally, research involving A53 T αSyn mice – a model of human αSyn mutation that reflects many traits of PD and DLB – reported EEG slowing across various stages (3–4, 5–7, and 9–10 months), with similar shifts in frequency power. 33 Such frequency alterations are common in synucleinopathies and are routinely noted in neurological assessments of both DLB and PD patients, with or without dementia.34–37
To further understand the translational relevance of our findings, we compared our results with EEG alterations observed in PD and DLB patients.
Our findings demonstrate that Thy1-αSyn mice exhibit EEG spectral shifts characterized by increased delta and theta power and decreased alpha, sigma, and beta power across all sleep stages. This EEG slowing mirrors observations in PD and DLB patients. Studies have reported similar spectral changes in these patients, indicating a shift from higher to lower frequency bands.12,38–40 Such EEG slowing is considered a hallmark of PD and correlates with cognitive decline.38,41
A notable study by Musaeus and colleagues 12 found that 80% of DLB patients exhibited EEG slowing in standard 30-min recordings, a significant contrast to the 6.7% observed in healthy controls. Particularly, 60% of these patients showed focal slowing in the temporal lobes—a key area implicated in DLB pathophysiology. While our study did not allow for regional frequency localization, the parallels in EEG patterns between DLB patients and Thy1-αSyn mice underscore the model's potential utility in further probing EEG changes in synucleinopathies, providing compelling evidence for its use in exploring the underlying mechanisms of EEG slowing.
Regarding sleep architecture, our observation of increased NREM sleep in Thy1-αSyn mice may seem contradictory to findings in human PD patients, who often exhibit reductions in slow-wave sleep (SWS), a component of NREM sleep.42,43 However, this discrepancy could be attributed to differences in disease stages or the specific aspects of NREM sleep affected. It's possible that increased NREM sleep in our mouse model reflects early-stage compensatory mechanisms, preceding the SWS reductions observed in later stages of PD in humans.
Moreover, REM sleep EEG slowing, characterized by increased delta and theta power, is a strong predictor of dementia development in PD patients. 40 While we did not observe significant REM sleep changes at 2.5 months, we noted a trend towards decreased REM sleep by 4.5 months in Thy1-αSyn mice. This suggests that REM sleep deficits might develop later in disease progression, similar to the progression observed in human PD.
Overall, the EEG spectral shifts and sleep alterations observed in our mouse model closely mirror those reported in PD and DLB patients. These similarities reinforce the translational relevance of our findings and support the use of Thy1-αSyn mice as a valuable model for studying early neural circuit disruptions and their implications for PD and DLB pathology.
Notably, we observed early microglial activation and astrogliosis in regions critical for sleep regulation. The lateral hypothalamus, which contains orexin neurons promoting wakefulness and regulating REM sleep transitions, showed significant microglial activation at 3 months and astrogliosis by 5 months. The dorsal raphe nucleus, involved in serotonergic modulation of sleep architecture, exhibited early astrogliosis. The reticular nucleus of the thalamus, essential for generating sleep spindles during NREM sleep, also showed increased astrocytic activity. These neuroinflammatory changes could lead to synaptic dysfunction and altered neurotransmitter release, disrupting sleep-regulating circuits.
Microglial activation can result in the release of pro-inflammatory cytokines and neurotoxic factors, leading to neuronal damage.44,45 Astrocytes, when undergoing reactive astrogliosis, can impair neuronal support functions, glutamate uptake, and blood-brain barrier integrity.46,47 The combined effect of microglial activation and astrogliosis may exacerbate neural network instability, contributing to both sleep disturbances and increased seizure susceptibility observed in Thy1-αSyn mice.
The early onset of sleep and EEG alterations observed in our study suggests a direct impact of αSyn overexpression and associated neuroinflammation on neural circuits regulating sleep. Key brain regions such as the midbrain, cortex, and brainstem show early αSyn accumulation.8,14,20 Previous immunohistochemical analyses have shown increased αSyn in 4-month-old Thy1-αSyn mice in perikarya and neuropil in crucial sleep-regulating regions like the locus coeruleus, raphe nucleus, thalamus, and reticular formation. 20 The combination of αSyn accumulation and neuroinflammatory responses in these regions could synergistically disrupt sleep architecture.
Synucleinopathies are linked to the development of seizures and interictal events. αSyn has been proposed as a factor in epileptogenesis with increased levels noted in both preclinical epilepsy models and synucleinopathy patient samples.48–50 Enhanced αSyn expression in Thy1-αSyn mice correlates with heightened electrographic seizure activity and specific EEG anomalies. As these seizures are only observable in EEG, and only rarely translate to clinical signs, they represent aberrant network hyperexcitability. Thy1-αSyn mice, bred on a hybrid of C57BL/6 and DBA2 strains, show higher electrographic seizure rates than reported in WT C57BL/6, clearly supporting an association with αSyn pathology. We observed increased electrographic seizure frequency (1–5 per week), with 44% of Thy1-αSyn mice displaying at least one seizure during a one-week period at 4.5 months. Although not every animal showed seizure activity on the EEG, interictal EEG patterns such as spikes, sharp waves, and multi-spike discharges were notably more frequent in Thy1-αSyn compared to WT littermates, supporting previous findings. 17 While the mechanisms of network hyperexcitability associated with DLB are poorly understood, we have observed interneuron degeneration in the basolateral amygdala 29 and hippocampal (unpublished) region of Thy1-αSyn mice, a crucial process implicated in epileptogenesis.51,52 Case studies have connected DLB to epilepsy, noting that epilepsy patients can exhibit symptoms resembling those of DLB.53–55 In PD, retrospective analyses have found that temporal lobe epileptiform discharges correlate with visual hallucinations, a symptom of advanced PD. 56 The propensity for developing seizures or epilepsy is higher in individuals with DLB or PD.57–60 While our study primarily focused on sleep alterations, these findings suggest a need for further exploration into the αSyn-related changes affecting brain networks. The observed neuroinflammatory changes may contribute to this network hyperexcitability. Microglial activation and astrogliosis can alter synaptic function and neuronal excitability, potentially lowering the seizure threshold.46,61–63 The early onset of sleep and EEG alterations observed in our study suggests a direct impact of αSyn overexpression and associated neuroinflammation on the neural circuits regulating sleep. Notably, key brain regions such as the midbrain, cortex, and brainstem show early αSyn accumulation, as reviewed recently (Figure 5). 8
Figure 5 provides a simplified diagram of NREM and REM sleep circuits, illustrating the associated αSyn levels in these areas. Interestingly, while regions such as the basal forebrain, lateral hypothalamus, and potentially the parabrachial nucleus, laterodorsal tegmental nucleus, and pedunculopontine tegmental nucleus exhibit increased αSyn levels, critical nodes for non-REM sleep and circadian rhythms—like the ventrolateral preoptic nucleus, median preoptic nucleus, and suprachiasmatic nucleus—remain relatively unaffected. Additionally, although the sublaterodorsal nucleus, vital for REM sleep, was not explicitly analyzed, adjacent data suggest it might also be less impacted by αSyn accumulation. Intriguingly, elevated αSyn levels in stool samples from patients with REM sleep behavior disorder suggest an ongoing αSyn pathology with a higher likelihood of transitioning to clinical PD. 64 The combination of αSyn accumulation and neuroinflammatory responses in these regions could synergistically disrupt sleep architecture.
This selective vulnerability could explain the specific patterns of sleep disturbances observed.
Our findings align with the hypothesis that neuroinflammation contributes to non-motor symptoms in PD. Targeting neuroinflammatory pathways may offer therapeutic potential for alleviating sleep disturbances in PD patients. Anti-inflammatory interventions have shown promise in preclinical models of neurodegeneration, potentially mitigating microglial activation and astrogliosis.65–68
Limitations
It is crucial to acknowledge the limitations of our study. The histological analyses were conducted on different cohorts of animals than those used for EEG recordings, precluding direct correlation between neuroinflammatory changes and sleep disturbances at the individual level. Transient microgliosis requires more characterization and repetition in additional animal cohorts to understand whether there are external factors influencing this phenotype, and to provide in depth characterization of the Iba1+ cells. Additionally, the small group sizes due to animal protocol constraints and surgical complications inherent to such complex procedures may limit the generalizability of our findings. Furthermore, while every effort was made to reduce the impact of external factors, comparisons across different animal models and ages at investigation could have been influenced by technical and methodological variations, including differences in housing, breeding, surveillance, and analysis.
Conclusion
In conclusion, our study provides evidence that early neuroinflammatory changes, characterized by microglial activation and astrogliosis in key sleep-regulating brain regions, may contribute to the sleep disturbances and EEG alterations observed in Thy1-αSyn mice. These early-stage changes offer crucial insights into the progression of neuronal dysfunction in synucleinopathies, supporting theories that sleep alterations are among the early symptoms of PD and related disorders. Sleep disturbances may not merely be biomarkers of ongoing disease pathology but could also exacerbate the progression of synucleinopathies.
The glymphatic system, which clears the brain of protein waste products, such as amyloid proteins, is mostly active during sleep. 69 Thus, lack of sleep may exacerbate synucleinopathy. Recent findings by Miao et al. 70 add an additional building block to this discussion by reporting that brain clearance is actually reduced during sleep. As we report increased durations of sleep in the animal model this suggests a possible buildup of metabolites due to decreased clearance. αSyn pathology and early sleep disruptions may initiate a feed-forward mechanism that leads to more severe sleep changes over time.
Some studies report that REM sleep behavior disorder changes with PD progression, but there is no clear trajectory which could be used as clinical trial endpoint. 71 However, our study suggests that alterations in NREM sleep and EEG spectral power may progress into REM sleep behavior disorder. With an increasing number of early biomarkers and diagnostics to detect the underlying biology of PD available, attention should be paid to such sleep alterations which could develop into REM sleep behavior disorder and PD.
Supplemental Material
sj-docx-1-pkn-10.1177_1877718X241310723 - Supplemental material for Alterations in non-REM sleep and EEG spectra precede REM-sleep deficits in a model of synucleinopathy
Supplemental material, sj-docx-1-pkn-10.1177_1877718X241310723 for Alterations in non-REM sleep and EEG spectra precede REM-sleep deficits in a model of synucleinopathy by Christopher Käufer, Miloš Stanojlović, Alina Schidlitzki, Jana Bonsberger, Alexander Storch and Franziska Richter in Journal of Parkinson's Disease
Footnotes
Acknowledgments
We thank Dr Eliezer Masliah for providing the line 61 Thy1-αSyn mice, Dr Kimberly A. McDowell for discussion at initiation of this study, Cristina-Luminita Baciu for guiding us with expert knowledge and Silas Staats, Ivo Wiesweg, and Scotty Käufer for their skillful technical assistance. Text written by the authors has been in part streamlined by LLM (ChatGPT4 and Claude 3 Opus) for better readability and language refinement. Text has been read and reevaluated by the authors for correctness.
Funding
This research was supported by intramural funding from the University of Veterinary Medicine Hannover.
Declaration of conflicting interests
The authors declared no potential conflicts of interest with respect to the research, authorship, and/or publication of this article.
Supplemental material
Supplemental material for this article is available online.
References
Supplementary Material
Please find the following supplemental material available below.
For Open Access articles published under a Creative Commons License, all supplemental material carries the same license as the article it is associated with.
For non-Open Access articles published, all supplemental material carries a non-exclusive license, and permission requests for re-use of supplemental material or any part of supplemental material shall be sent directly to the copyright owner as specified in the copyright notice associated with the article.