
Abstract
This report summarizes the existing literature on the use of technology for the assessment of freezing of gait (FOG) as well as the use of technology to provide insights into the mechanisms of FOG in people with Parkinson's disease. Specifically, this work was carried out for the 3rd International Workshop on Freezing of Gait in Jerusalem in 2023. This review focuses on the most used technologies to quantitatively assess FOG in a laboratory environment and describes the technologies that hold promise for assessing FOG in daily life. Examples of implementation of machine learning algorithms are provided as well as algorithmic biases. Lastly, a standardized assessment using inertial measurement units during a clinical protocol is proposed and a 5-year outlook is discussed. We anticipate this review will help move the field forward in the coming years.
Keywords
Introduction
In this narrative review, we present a comprehensive overview of the current state-of-the-art measurement technologies employed in the assessment and management of freezing of gait (FOG) among people with Parkinson's disease (PD). FOG, a debilitating symptom characterized by brief episodes of involuntary gait cessation or marked absence of progression, significantly impacts the quality of life and independence of many, but not all individuals with PD. Accurate and timely detection of FOG is crucial for effective therapeutic interventions and tailored treatment strategies. This review reflects the work of the Measurement Group of the International Consortium for FOG (ICFOG), formed for the 3rd International Workshop on FOG that took place in Jerusalem in March 2023. Leading members of the ICFOG created a blueprint of their objectives and formed four working groups that met multiple times to develop: (1) a new, detailed definition of FOG (Definition Group), (2) new clinical and patient-reported outcome measures (Standardized Assessment Group), (3) instrumented approaches to the use of technology to assess FOG (Measurement Group), and (4) data collection, sharing and harmonization (Harmonization Group). For the Measurement Group, this process informed discussions around the optimal and most widely used technologies to assess FOG and to understand FOG mechanisms, as will be summarized here. In addition, we provide a standardized approach for utilizing inertial measurement unit (IMU) recordings for automated scoring of a novel clinical assessment of FOG, developed during the Jerusalem meeting. Lastly, we present a case study describing the potential influence of preprocessing steps on FOG outcome validity.
The present work builds on, updates, and extends a narrative review on this topic that was written after an international FOG meeting that was held in Leuven, Belgium in 2014. That paper focused on clinical and methodological challenges in assessing FOG, 1 mainly related to the use of wearable sensors, while this paper reviews the used technologies to quantitatively assess FOG in a laboratory environment and describes the technologies that hold promise for assessing FOG in daily life. In addition, here we provide examples of the implementation of machine learning algorithms as well as algorithmic biases, finalizing a list of suggestions for algorithm implementation. Lastly, a standardized assessment using inertial measurement units during a clinical protocol is proposed and a 5-year outlook is discussed.
Problem definition
Freezing of gait
The work presented here uses the working definition of freezing of gait established in the literature. FOG is defined as “a brief, episodic absence or marked reduction of forward progression of the feet despite the intention to walk”. 2 This definition is not all-encompassing as FOG episodes may be prolonged in duration or may occur while turning or walking backwards. There are various phenotyping standards for FOG episodes, based on either the emergent kinematics (e.g., trembling or akinetic type), the freezing trigger (e.g., start, turning, tight quarter, doorway, destination, open space), or its responsiveness to medication (i.e., levodopa responsive, levodopa unresponsive, levodopa evoked). Parallel efforts at the Jerusalem FOG meeting focused on updating the definition; we believe that these technologies will be appropriate irrespective of the evolution of the precise definition of FOG.
Clinical assessment
In current clinical practice, FOG is evaluated as part of regular clinic visits with the Movement Disorder Society – Unified Parkinson's Disease Rating Scale Part III (MDS-UPDRS-III),
3
a widely used tool for assessing motor function in PD. The MDS-UPDRS-III total score is composed of 33 items across various motor domains, and is intended to give an aggregate impression of parkinsonian symptom severity, particularly for use as an outcome in treatment evaluation.
4
The MDS-UPDRS-III includes an item (3.11) specifically for assessing freezing of gait, which is scored simultaneously with the gait item (3.10). The patient is instructed to walk away from the examiner (at least 10 meters, or roughly 30 feet), turn around, and return. The examiner observes the patient for the presence of FOG during the test. The item is scored on a scale of 0 to 4, with higher scores indicating more severe freezing of gait, as follows:
No freezing. Freezes on starting, turning or walking through a doorway with a single halt during any of these events, but then continues smoothly without freezing during straight walking. Freezes on starting, turning or walking through a doorway with more than one halt during any of these activities, but continues smoothly without freezing during straight walking. Freezes once during straight walking. Freezes multiple times during straight walking.
In isolation, the MDS-UPDRS-III FOG score may not be informative for clinical management, because FOG is episodic in nature and the patient's conscious attention to walking during testing may suppress FOG.
5
Therefore, while a nonzero score likely indicates that FOG is present in daily life, a zero score does not necessarily indicate that it is absent. For this reason, treatment algorithms typically recommend detailed history taking in addition to testing using behavioral tasks designed to provoke FOG to reliably establish the presence or absence of FOG.
5
Assessment gold standard: 2D video with manual annotation
There is a clear need for a more precise evaluation of FOG than those that are provided by the MDS-UPDRS-III assessment. The current gold standard for assessing FOG severity is via manual annotation of FOG episodes in conventional video recordings during standardized behavioral, performance-based tests.6,7 A trained clinician or researcher will observe the patient walking and note (or “annotate”) the start and stop times of any freezing episodes later during video playback. Depending on the center and protocol, they may also ask the patient to perform other tasks, such as turning, stepping over an obstacle, or dual-task walking to more reliably elicit freezing episodes. The “Ziegler Test” has been suggested to be a reliable standard behavioral testing paradigm;8,9 however, currently there is a large variation in testing protocols across centers.
The annotation process involves one or more expert raters reviewing video recordings of the behavioral testing to record the start and stop times of each FOG episode, either manually or with the assistance of software tools. 7 Once annotations are complete, FOG severity can be reported with several potential quantitative outcomes, such as the percentage of the task that is spent frozen (%TF) or the frequency of FOG episodes.101112–13 Additionally, annotation details like the type of FOG episode can be provided, such as tremulous episodes, where the limbs shake in a “freeze band,” or akinetic episodes, where there is very little detectable motion. 14
The use of observational assessment presents both advantages and disadvantages in the evaluation of FOG. One of the primary benefits is that these methods can be completed with a relatively short period of training to use simple video equipment as compared to the expertise required to utilize advanced technology. The equipment required can be as simple as a mobile phone video camera and as such, barriers to entry are low.
However, observational assessments come with drawbacks, mainly the time burden associated with manual annotation. The process is labor-intensive and currently non-standardized. Formal video annotation tools can streamline the annotation process somewhat, 7 but annotation remains a substantial burden to research and clinical raters. The lack of standardized training may lead to inconsistencies in the quality and accuracy of assessments. Additionally, human raters may attend to subtle implicit factors that may or may not be captured by objective measures, potentially introducing rater-specific bias. Subjectivity issues such as questionable inter-rater and test-retest reliability can compromise the overall validity and reliability of observational evaluations.
It is also important to note that simply observing FOG through video may not help us understand the specific reasons behind it within individuals, like physiological, psychological, or neurological factors. While technology has given us reliable ways to measure many relevant outcomes, it is unclear if researchers consistently consider these factors in their studies. In the next section, we discuss current methods to detect but also understand FOG. We also outline future goals to use technology to better measure individual factors and automate the assessment of environmental and task constraints, particularly those affecting the intent of the walker. Since the manifestation of FOG may depend on specific goals, intent can play an important role.
Objectives and contexts for measuring FOG
Here, we first summarize the evidence for the use of technology specifically for two applications defined as follows:
Outcome measures: FOG measurements to inform clinical trials and/or general course of treatment (e.g., pharmacotherapy, deep brain stimulation (DBS), physical therapy (PT), occupational therapy (OT)) over a period of weeks or months (for example, use of technology to quantify/detect/classify FOG episodes, or duration). Mechanistic insights: FOG measurements to understand mechanisms of FOG (e.g., cortical/subcortical activity prior to or during FOG).
For this narrative review, we will be leaving out a common application where technology is used as part of a treatment specifically designed to directly disrupt FOG episodes as they occur in daily live or use technology for rehabilitation (for example, use of technology to inform closed-loop cueing such as a metronome that automatically switches on when FOG occurs
11
). Second, we present a standardized approach for utilizing IMU recordings for automated scoring of the clinical assessment of FOG, the Giladi-Protocol (GP-ClinRO). This new FOG-provoking protocol is named in memory of Prof. Nir Giladi, a renowned world leader in the study and care of FOG and PD, and one of the main drivers of the International Freezing of Gait Consortium.
In ideal circumstances, we would like to obtain a precise estimate of the burden of FOG during unprescribed tasks in unsupervised environments—the home and other environments of daily living (Figure 1). However, this context is the most challenging to measure quantitatively due to the uncontrolled nature of the environment. Therefore, most research has been conducted in a prescribed or supervised environment to eventually use measurement technology in real-life situations. By doing so, researchers can obtain a more comprehensive understanding of the patient's experiences and use this information to inform treatment decisions. Here, we will focus on the supervised assessment during prescribed activities.
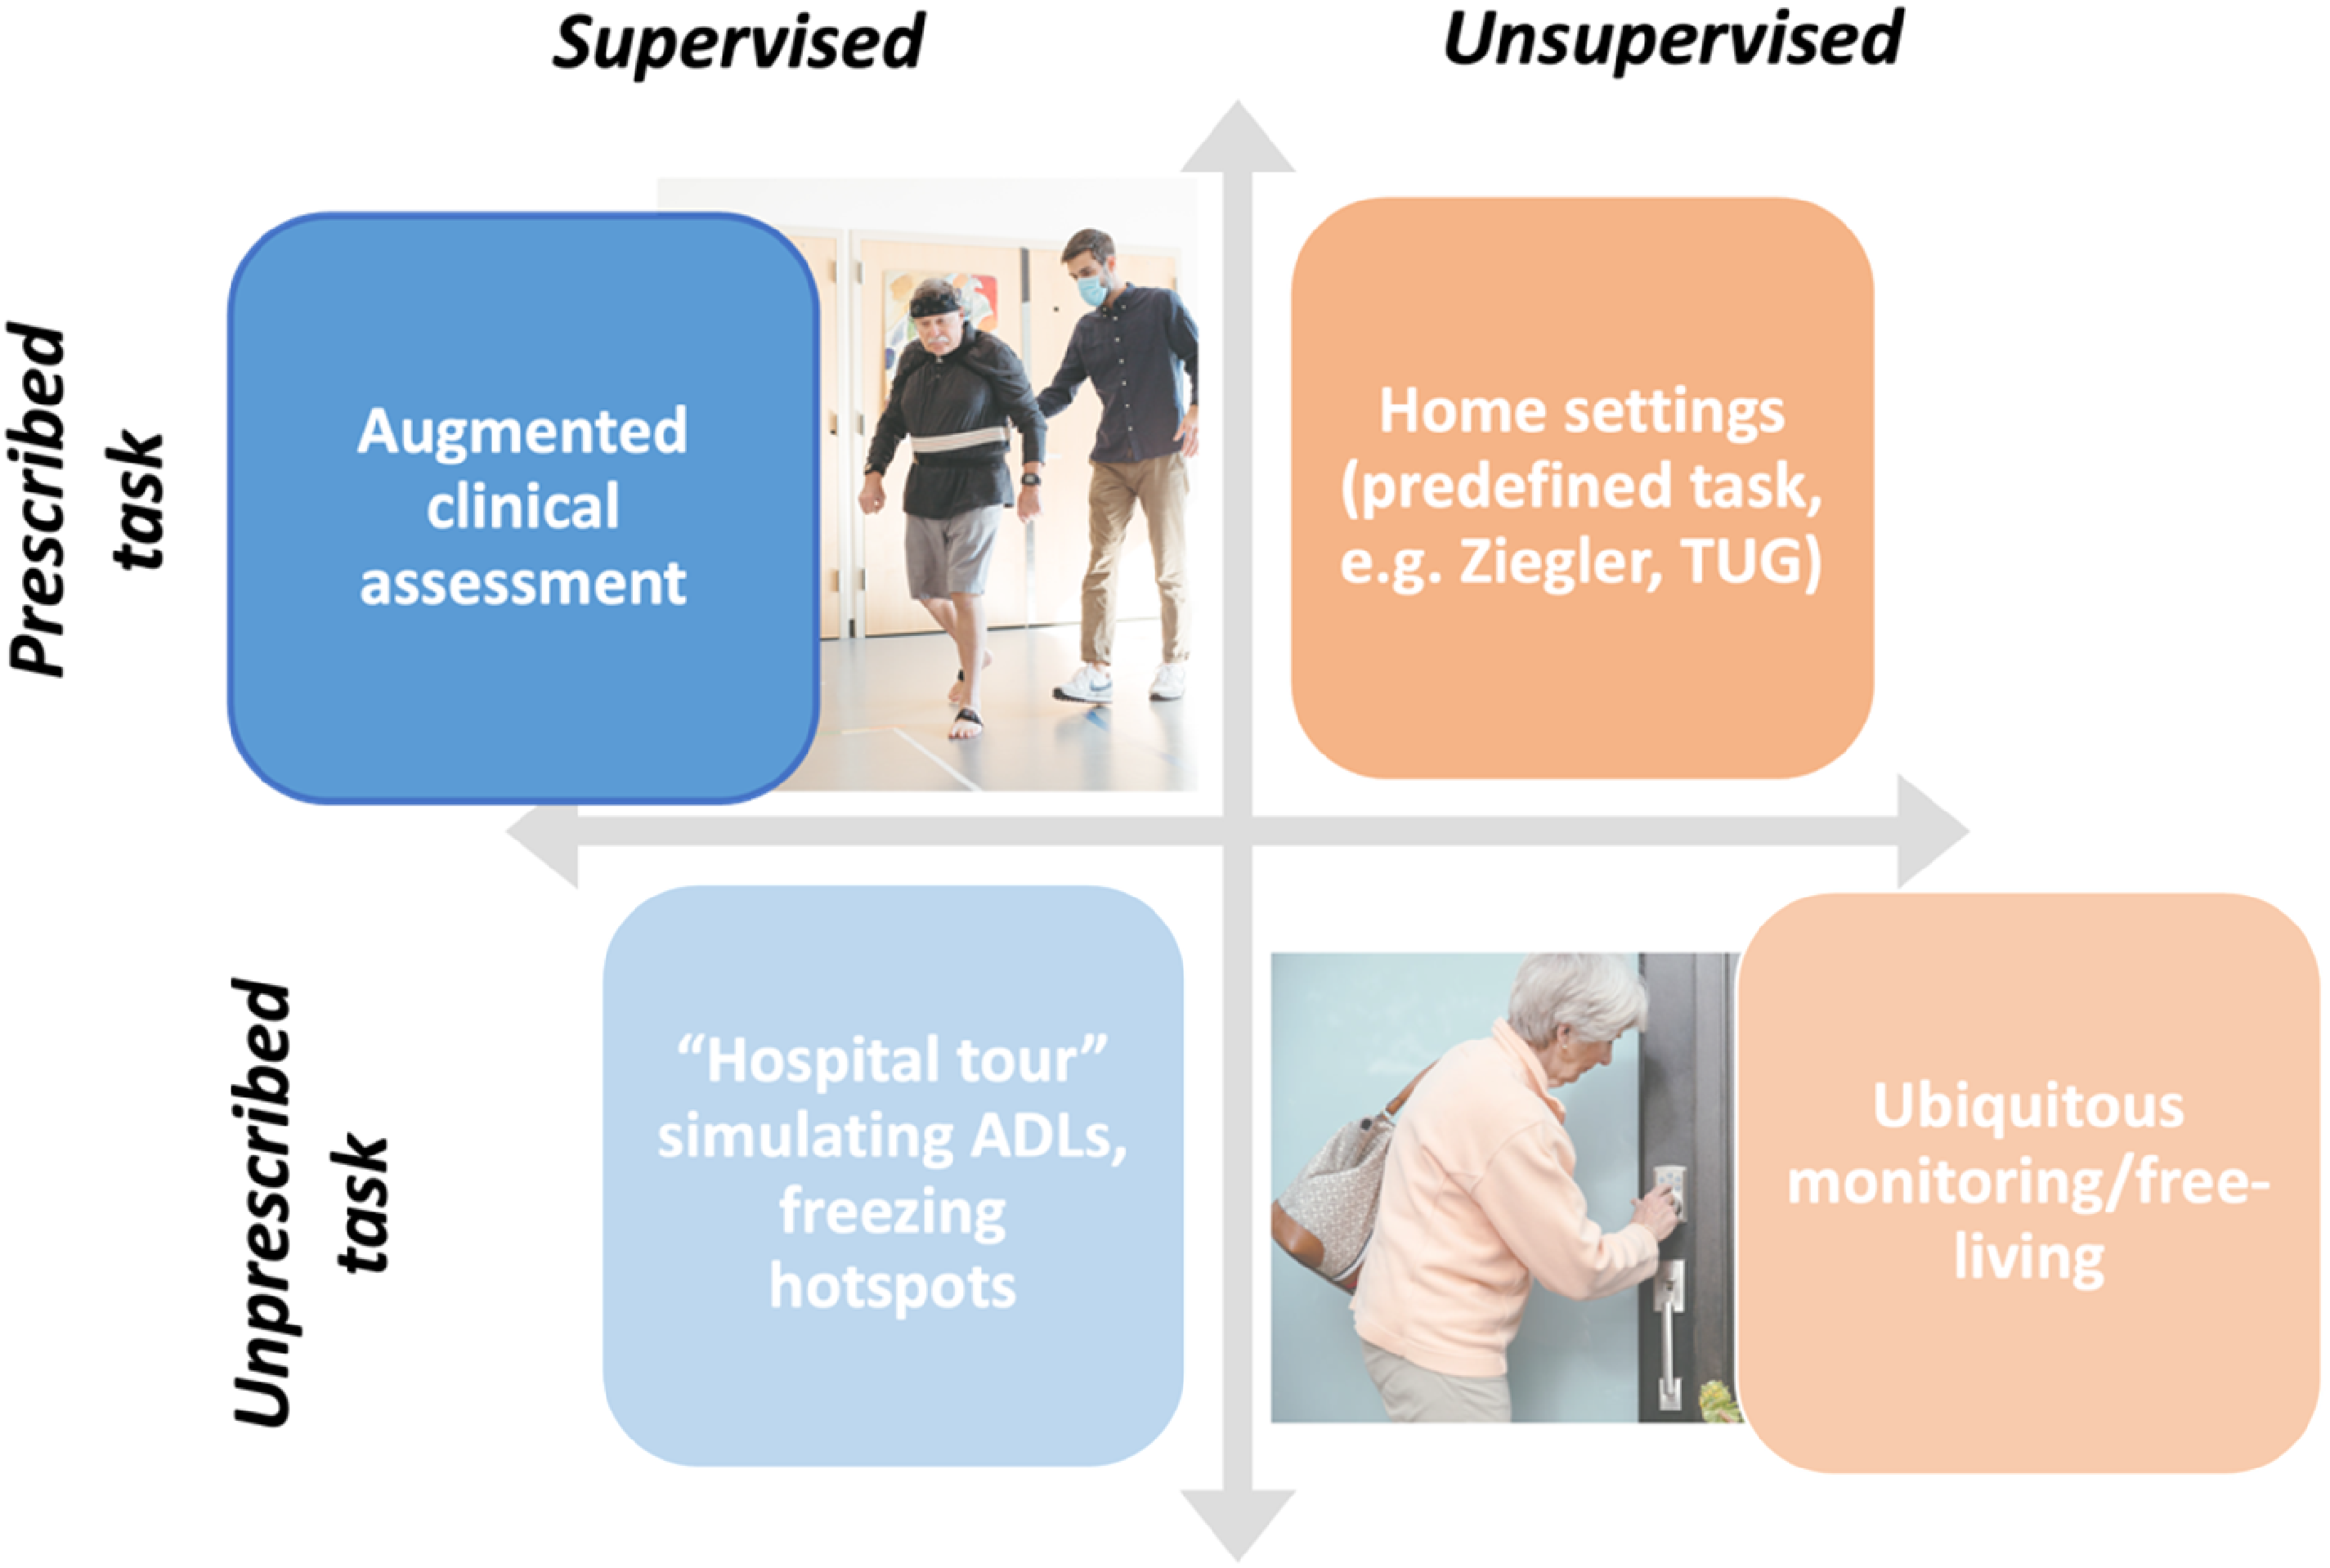
Contexts for measuring FOG. Here we focus on the top left panel, supervised assessment during prescribed activities in a clinical setting.
Current usage of technologies for measuring FOG
Our working group conducted an internal survey among the ICFOG investigators and clinical and research colleagues to assess the current usage and goals of measurement technologies to evaluate FOG. Of 46 people who were invited, 38 responded to the internal survey, roughly half were medical providers (movement disorders specialists, therapists) and half were researchers. We were surprised to find that 38% of the responders had measured FOG in 100 or more individuals. The majority of respondents (74%) currently measure FOG in between 1 and 10 cases per month. Results of the survey are reported in Supplemental Material, Section 1.
The top three environments where FOG is measured were:
Research-oriented gait laboratory (79%) Home environment and real-world (61%) Clinical environment (52%). Video recordings (67%) Multiple wearable sensors (55%) Pressure walkway (42%) 3D motion analysis systems (42%). The number and duration of each FOG episode (97%) The percentage of time spent frozen (91%) FOG phenotype information (akinesia vs. trembling, or shuffling; 70%).
Among various kinds of technologies to assess FOG, the most common were:
Lastly, the most desired outcome measures for FOG were:
We note that this internal survey was intended to provide guidance rather than as a comprehensive formal summary of knowledge, attitudes and practices related to FOG.
Summary of state of the art
Efforts over the last few decades have strived to objectively characterize FOG using instruments available in traditional gait laboratories, including motion capture to measure body kinematics,151617–18 foot contact switches,19,20 force plates, 21 and surface electromyogram (EMG). 22 The most used wearable sensors to quantify FOG are accelerometers and, more generally, IMUs, that integrate accelerometers, gyroscopes, and sometimes magnetometers, to comprehensively capture body a body segment's motion and orientation in three-dimensional space. 23
However, we do not believe that it is necessary to propose a singular analysis approach. With the aid of machine learning techniques such as ensemble classifiers,24,25 it is expected that multiple sensing modalities and various FOG algorithms can be combined to create ensemble meta-estimators. This approach is expected to provide more accurate and comprehensive assessments of FOG, helpful for both outcome measures and to understand mechanisms.
Measurement technology reviews
In this section, we review the state of the art of 5 technologies used for measuring FOG, including those that were frequently reported by our internal survey and other emerging technologies identified by the writing group as potentially highly influential in the short or near term. We present each technology with its applications for assessing FOG in clinical practice and with its applications for understanding the mechanisms behind FOG. Generally, for each technology we focus on the application that has mostly been studied in literature. Although this division is somewhat useful, it is imperfect at best, as all technologies have been, in general, applied across both use cases (see Table 1).
Comparison of advantages and disadvantages of FOG measurement modalities currently in use with suggestions on FOG phenotypes measures.
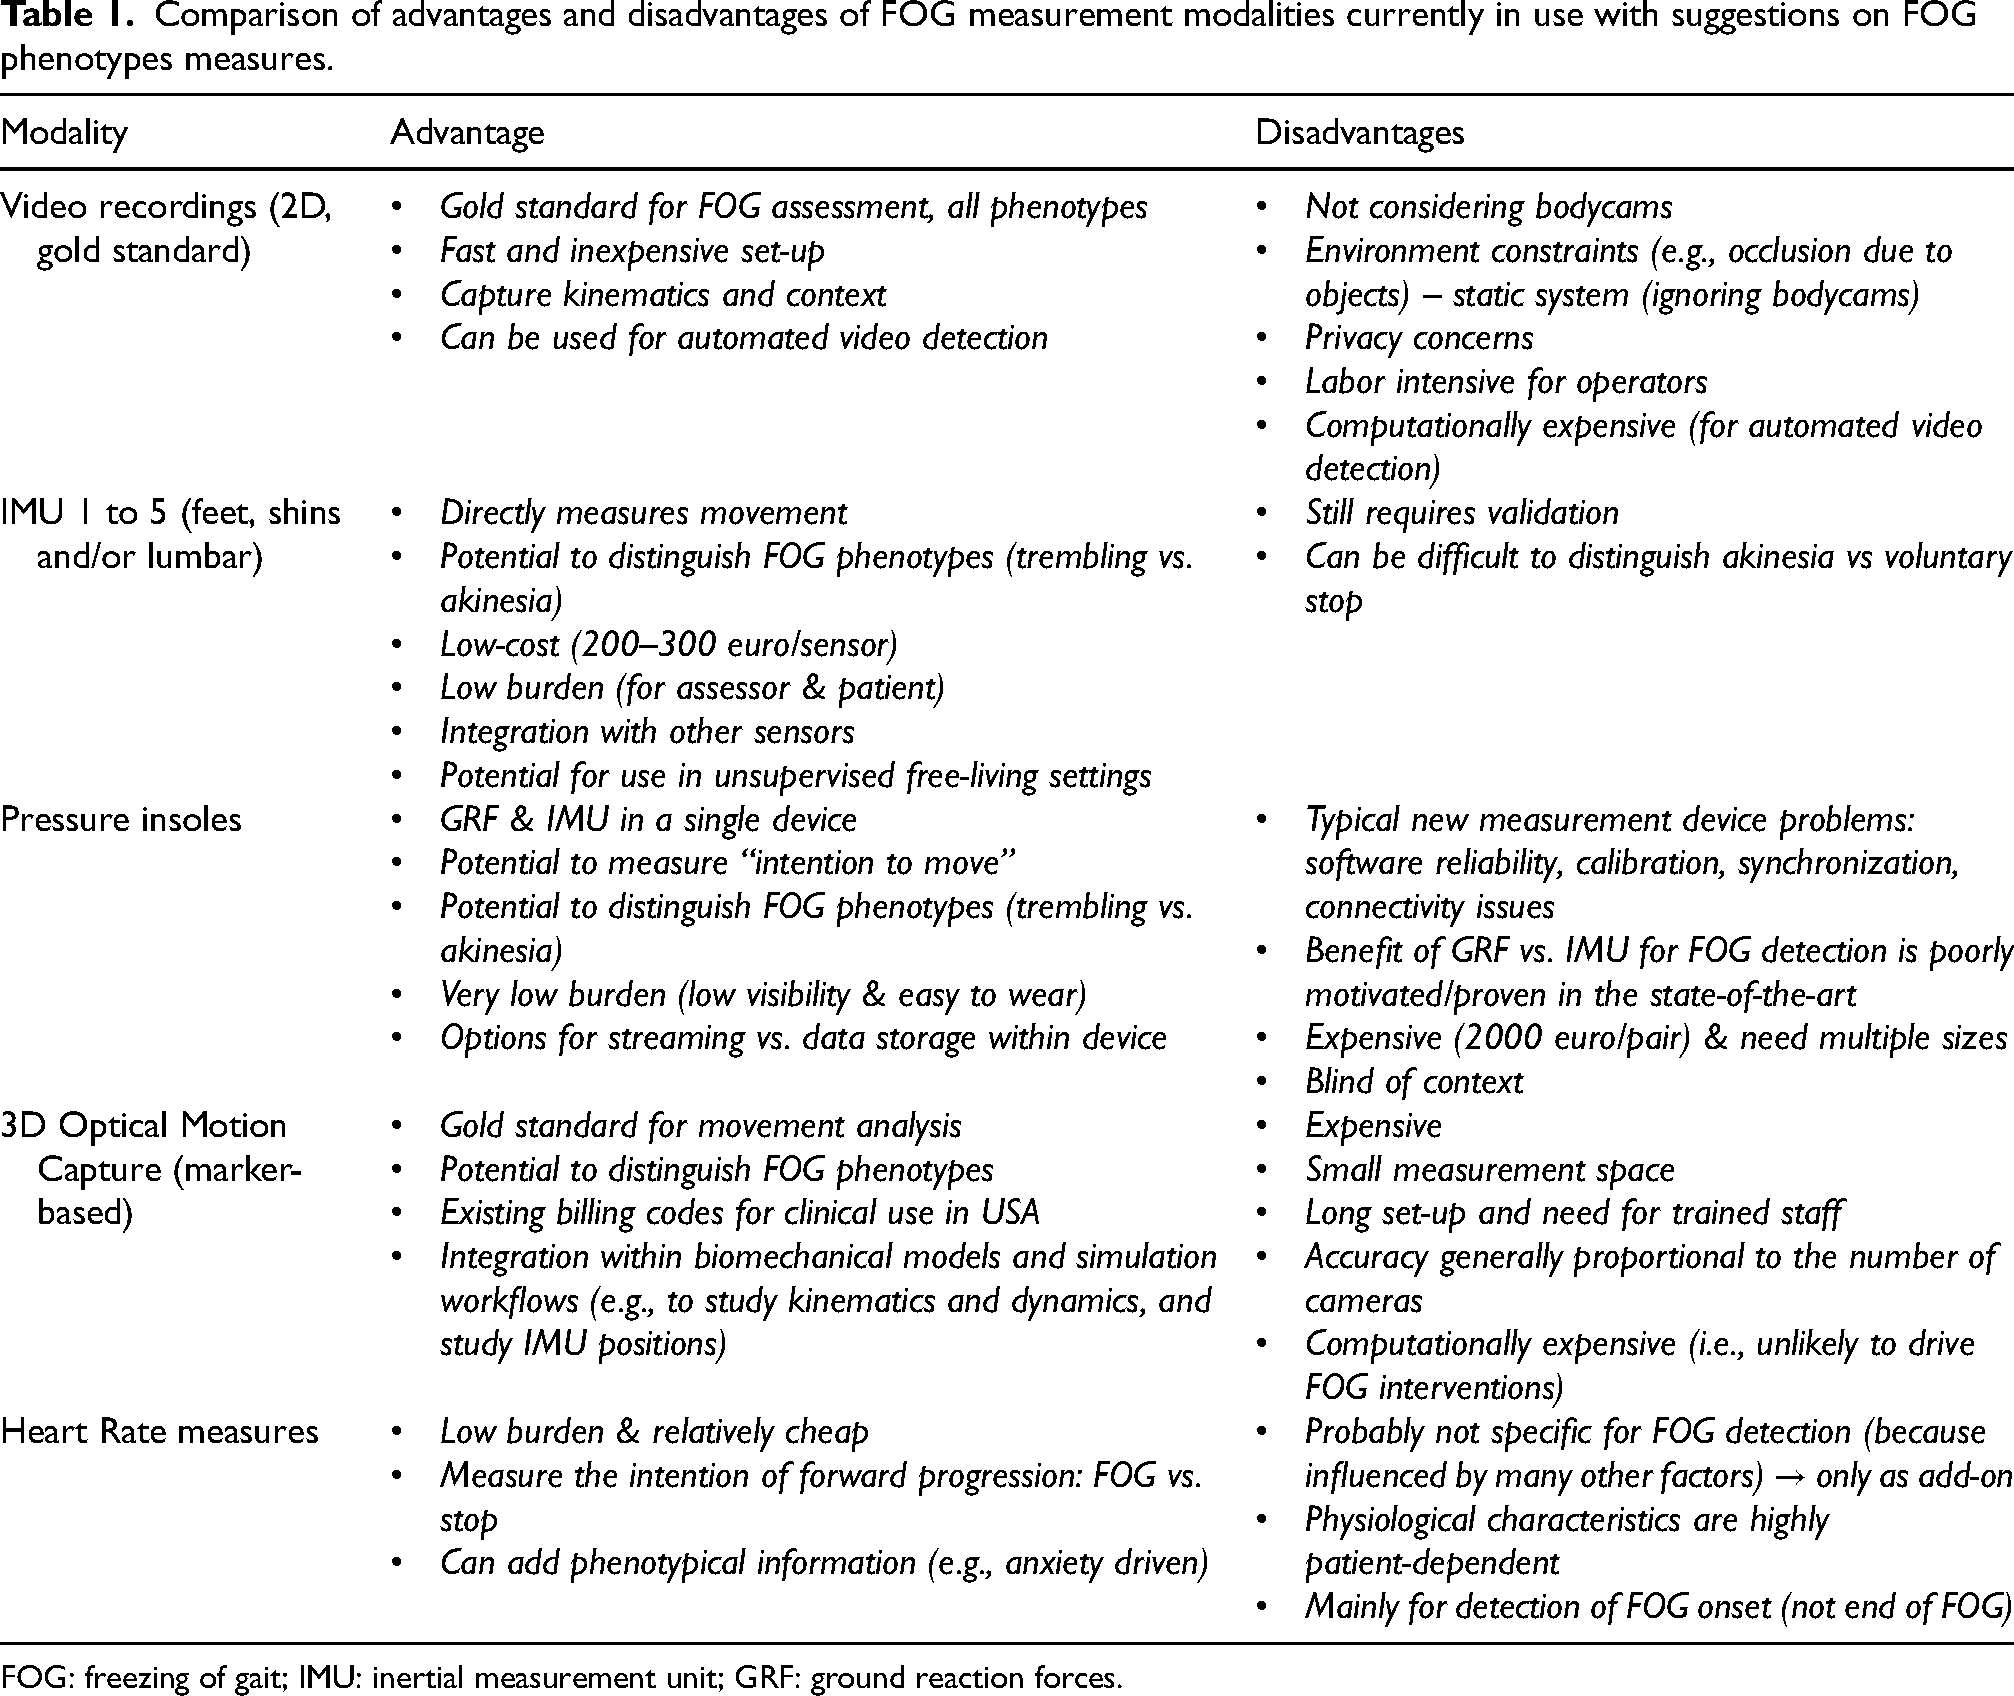
FOG: freezing of gait; IMU: inertial measurement unit; GRF: ground reaction forces.
Inertial measurement units
Wearable IMUs are one of the most widely used technologies to measure FOG.1,26,27 They are based on the recording of movement (3D acceleration & angular velocity, and optionally magnetic field). They are well suited to capture trembling/high frequency movements that characterize many FOG events. Although IMU's have the potential to also capture the akinetic manifestations of freezing, viewed as an absence of leg movement, it may still be difficult to differentiate these episodes from intended stopping. 28
Assessment
Previous reviews in this area have shown the effectiveness and widespread use of wearable-sensor-based FOG detection. The number of sensors chosen and location in the body can depend on the context of use: laboratory/clinic vs. real-world. For FOG measurement in daily life (not prescribed, unsupervised assessment) one sensor on the lower back is usually preferred.13,29 However, when assessing sensor performance in laboratory settings, best performance were achieved with sensors on the shins (or shank/tibia/ankle), used in 56% of the studies, followed by lower back (23.62%), and thigh (22.2%).23,29 For example, work by O’Day et al. 29 reports an AUC of about 0.74 when using a single IMU on the lumbar spine, an AUC of 0.80 if the IMU was placed on one shin (less convenient), and 0.83 with one IMU on each shin and one on the lumbar spine (even more burdensome). However, performance dramatically varies based on the method used to assess FOG and also by algorithm specifics.
The methods to assess FOG vary in complexity, from the simplest approach using threshold-based methods on time or frequency domain of the recorded acceleration and angular velocities signals (Fourier transform, wavelets, frequency index)26,27 to machine learning (ML) techniques (neural networks, decision trees, random forest, support vector machine, and some unsupervised or semi-supervised methods).13,26,27 The reported performances range from 89% to 95% for sensitivity, and from 93% to 95% for specificity (see reviews26,27), oftentimes with a single IMU. One particularly promising study to mention is work from Borzi and colleagues, who showed good classification performance in detecting FOG 0.8–3 s before its occurrence using a multi-head convolutional neural network on data detected from a single IMU on the waist in 118 people with PD and 21 older healthy controls during supervised daily activities tasks. 30 Although results from IMU-based detection algorithms sound promising, small datasets and inconsistent evaluation processes still hinder the use of these applications in clinical practice and for clinical trials.
A machine learning competition (the Kaggle competition) aimed to address these limitations. 13 An IMU dataset collected from 128 patients with PD and FOG and almost 5000 labeled episodes of FOG were the basis of the competition. The goal of the competition was to automatically identify FOG from 3D accelerometer signals taken from a single sensor worn on the lower back using machine learning models developed by the participants. Participant submissions were automatically ranked based on the mean average precision, averaged over 3 classes of FOG (start hesitation, walking, and turning). The best solutions had high accuracy, high specificity, and good precision in FOG detection (irrespective of FOG class), with strong correlations to gold-standard references (see Table 2). The results highlight the importance of evaluating precision and recall (and not just accuracy or ROC). Although additional work is needed to improve the detection performance for less common classes of FOG (start hesitation and walking), the present results suggest that the top models can be used to assist at least in the automatic detection of turning FOG, i.e., the most common type of FOG, either replacing or supplementing expert annotations.
Intraclass correlation results (ICCs) reflecting the machine learning model's ability to reproduce gold-standard measures based on expert review of the videos.
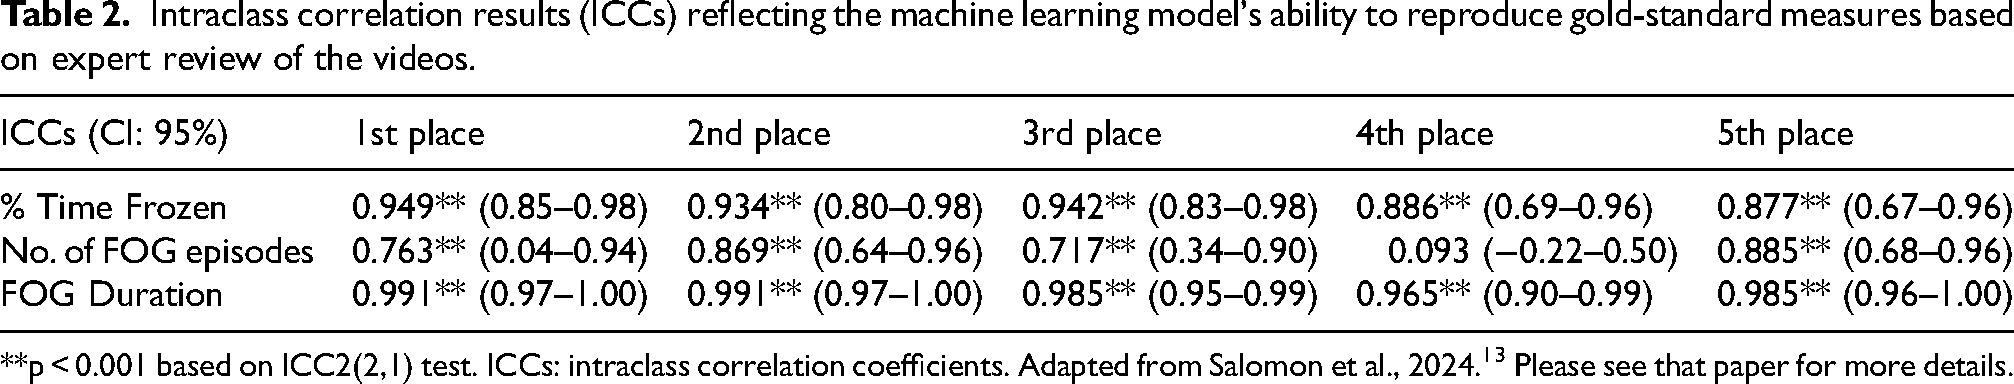
**p < 0.001 based on ICC2(2,1) test. ICCs: intraclass correlation coefficients. Adapted from Salomon et al., 2024. 13 Please see that paper for more details.
Interestingly, exploratory analyses applied a combination of the top winning models to unlabeled 24/7 IMU data. When applied to continuous 24/7 data, the combined model revealed previously unobserved patterns in daily living FOG occurrences, with two peaks in % time frozen around 7 a.m. and 10 p.m., probably reflecting off-medication states (see Figure 2). Although these initial findings need to be further confirmed and potentially false positive results should be addressed, this initial work demonstrates how 24/7 monitoring of FOG could be used to provide hour-by-hour estimates of FOG, potentially gaining insights into medication and time-of-day effects.
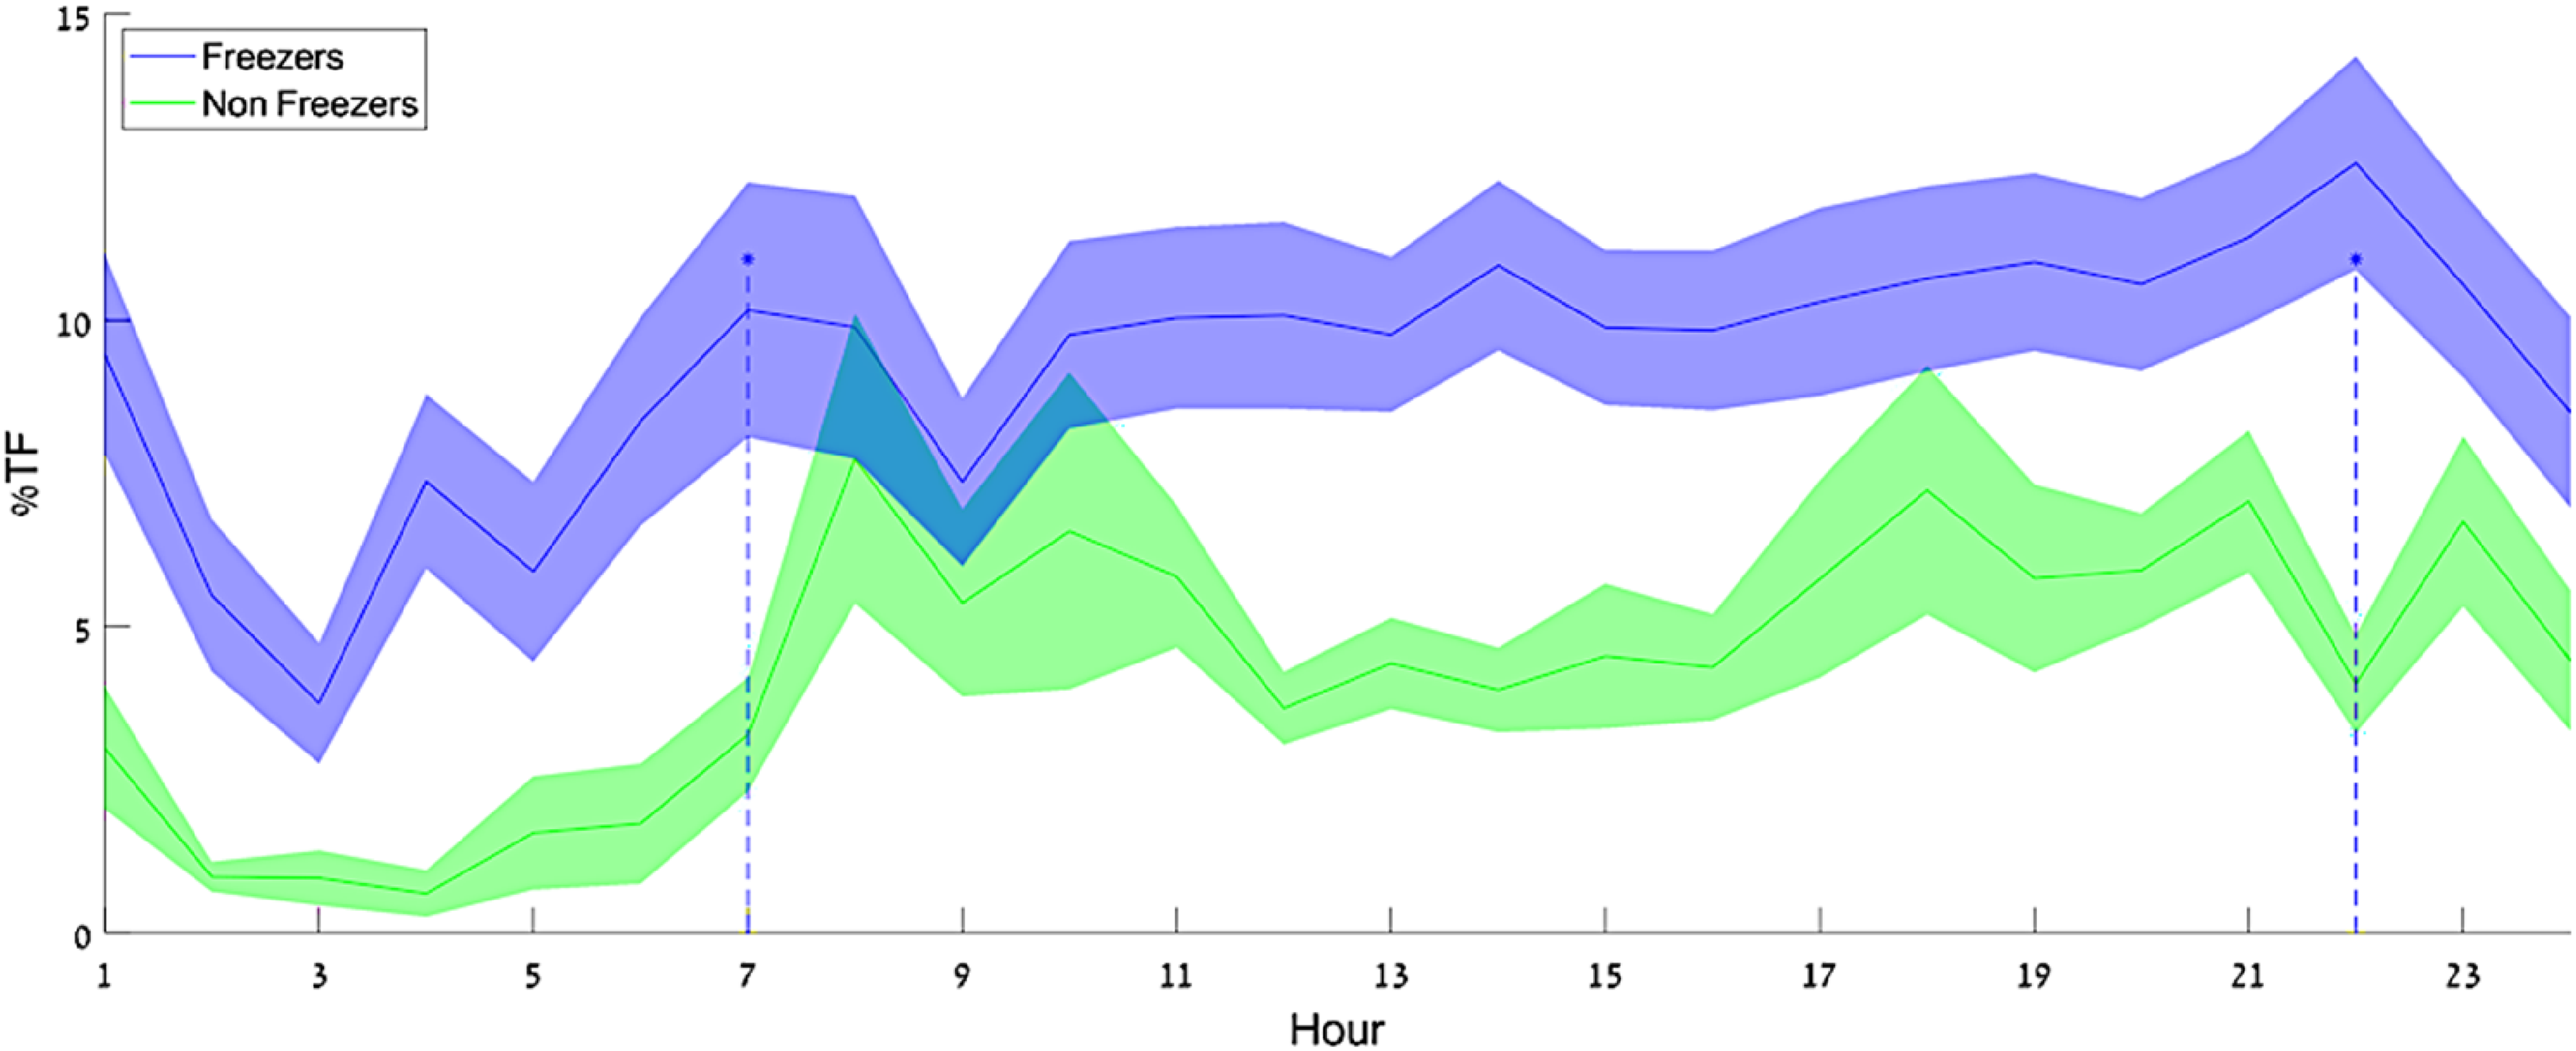
% time frozen as a function of time-of-day model estimation on daily living data from freezers and non-freezers. Darker lines show the group means, and the shaded areas show the SD around the mean. There appear to be two peaks in the %TF of the freezer group – around 7 a.m. and 10 p.m. From: Salomon et al., 2024. 13
Mechanisms
The majority of studies using IMU's to address the underlying mechanisms of FOG has mainly focused on characterizing differences between people with and without FOG during gait, turning and balance tasks, often in the absence of FOG episodes313233–34 and mainly during structured and supervised tasks in the laboratory. Dual-task paradigms provide an additional challenge to gait and balance tasks in laboratory settings and are often used to gain better insight into daily-life FOG mechanisms. The simultaneous completion of multiple tasks, such as walking and performing a cognitive task, 35 is often reported to be more difficult in people with PD compared to healthy controls and even more so in people who exhibit FOG. 36 Recent work showed that people with PD and FOG have a more pronounced “dual-task cost” for several gait measures (stride length, foot strike angle, and arms swing range of motion) which is usually interpreted as evidence that people with PD and FOG may rely on greater cortical control for the execution of gait.
Pressure insoles
One of the very first papers quantifying FOG with technology used pressure-sensitive insoles. 19 This technique was chosen because it directly measures the plantar pressure distribution during normal walking, reflecting changes in the ground reaction forces, hence leg and body movement. The methods for measuring plantar force differ and include piezoresistive, resistive, capacitive, piezoeletric, and temperature-humidity methods, with some methodologies more prone to errors than others. 37 In addition, this technology used to be relatively fragile and the most reliable versions are more expensive. Still, insoles can provide a relatively in-depth, objective characterization of FOG-subtypes and manifestations.
Assessment
The number of papers using pressure insoles for FOG is definitely lower than that using IMUs 38 or 3D Motion Capture. We speculate that this reflects the known issues related to the costs and reliability of this technology (some of which have been addressed recently). Some studies have used pressure insoles alone for FOG assessment19,39404142–43 and others have used pressure insoles in combination with IMUs. 44 Apart from one paper that quantified the frequency content of the vertical forces during FOG episodes, 19 other papers used the reaction forces or reconstructed center of pressure to derive gait parameters and feed them to various model types to detect and predict FOG onset. A small study 41 using long short-term memory (LSTM) deep learning methods reports the best performance in detecting FOG episodes from plantar pressure data with a 72.5% sensitivity and 81.2% specificity in the validation portion. Nevertheless, no definitive conclusion can be drawn on the use of pressure insoles for FOG detection as the number of studies is low and have small sample sizes. Despite these limitations, we believe that this technology has good potential to be used in daily life as soon as the technology becomes sufficiently robust for long-term monitoring.
Mechanisms
To the best of our knowledge, only one paper has investigated FOG mechanisms using pressure insoles. 19 Specifically, this paper showed that the forces under the legs change widely during a FOG episode (see Figure 3), with oscillations that are typically much faster than the normal walking pattern and that are distinct from tremor. The study showed that FOG is not a random process, but that the legs move with temporal structure and organization that is different from walking. 19 The complex oscillations during FOG suggest that the phenomenon is not under the control of a (single) central pattern generator (like walking) and may reflect a central mechanism that is systematically activated during or in response to freezing. 19
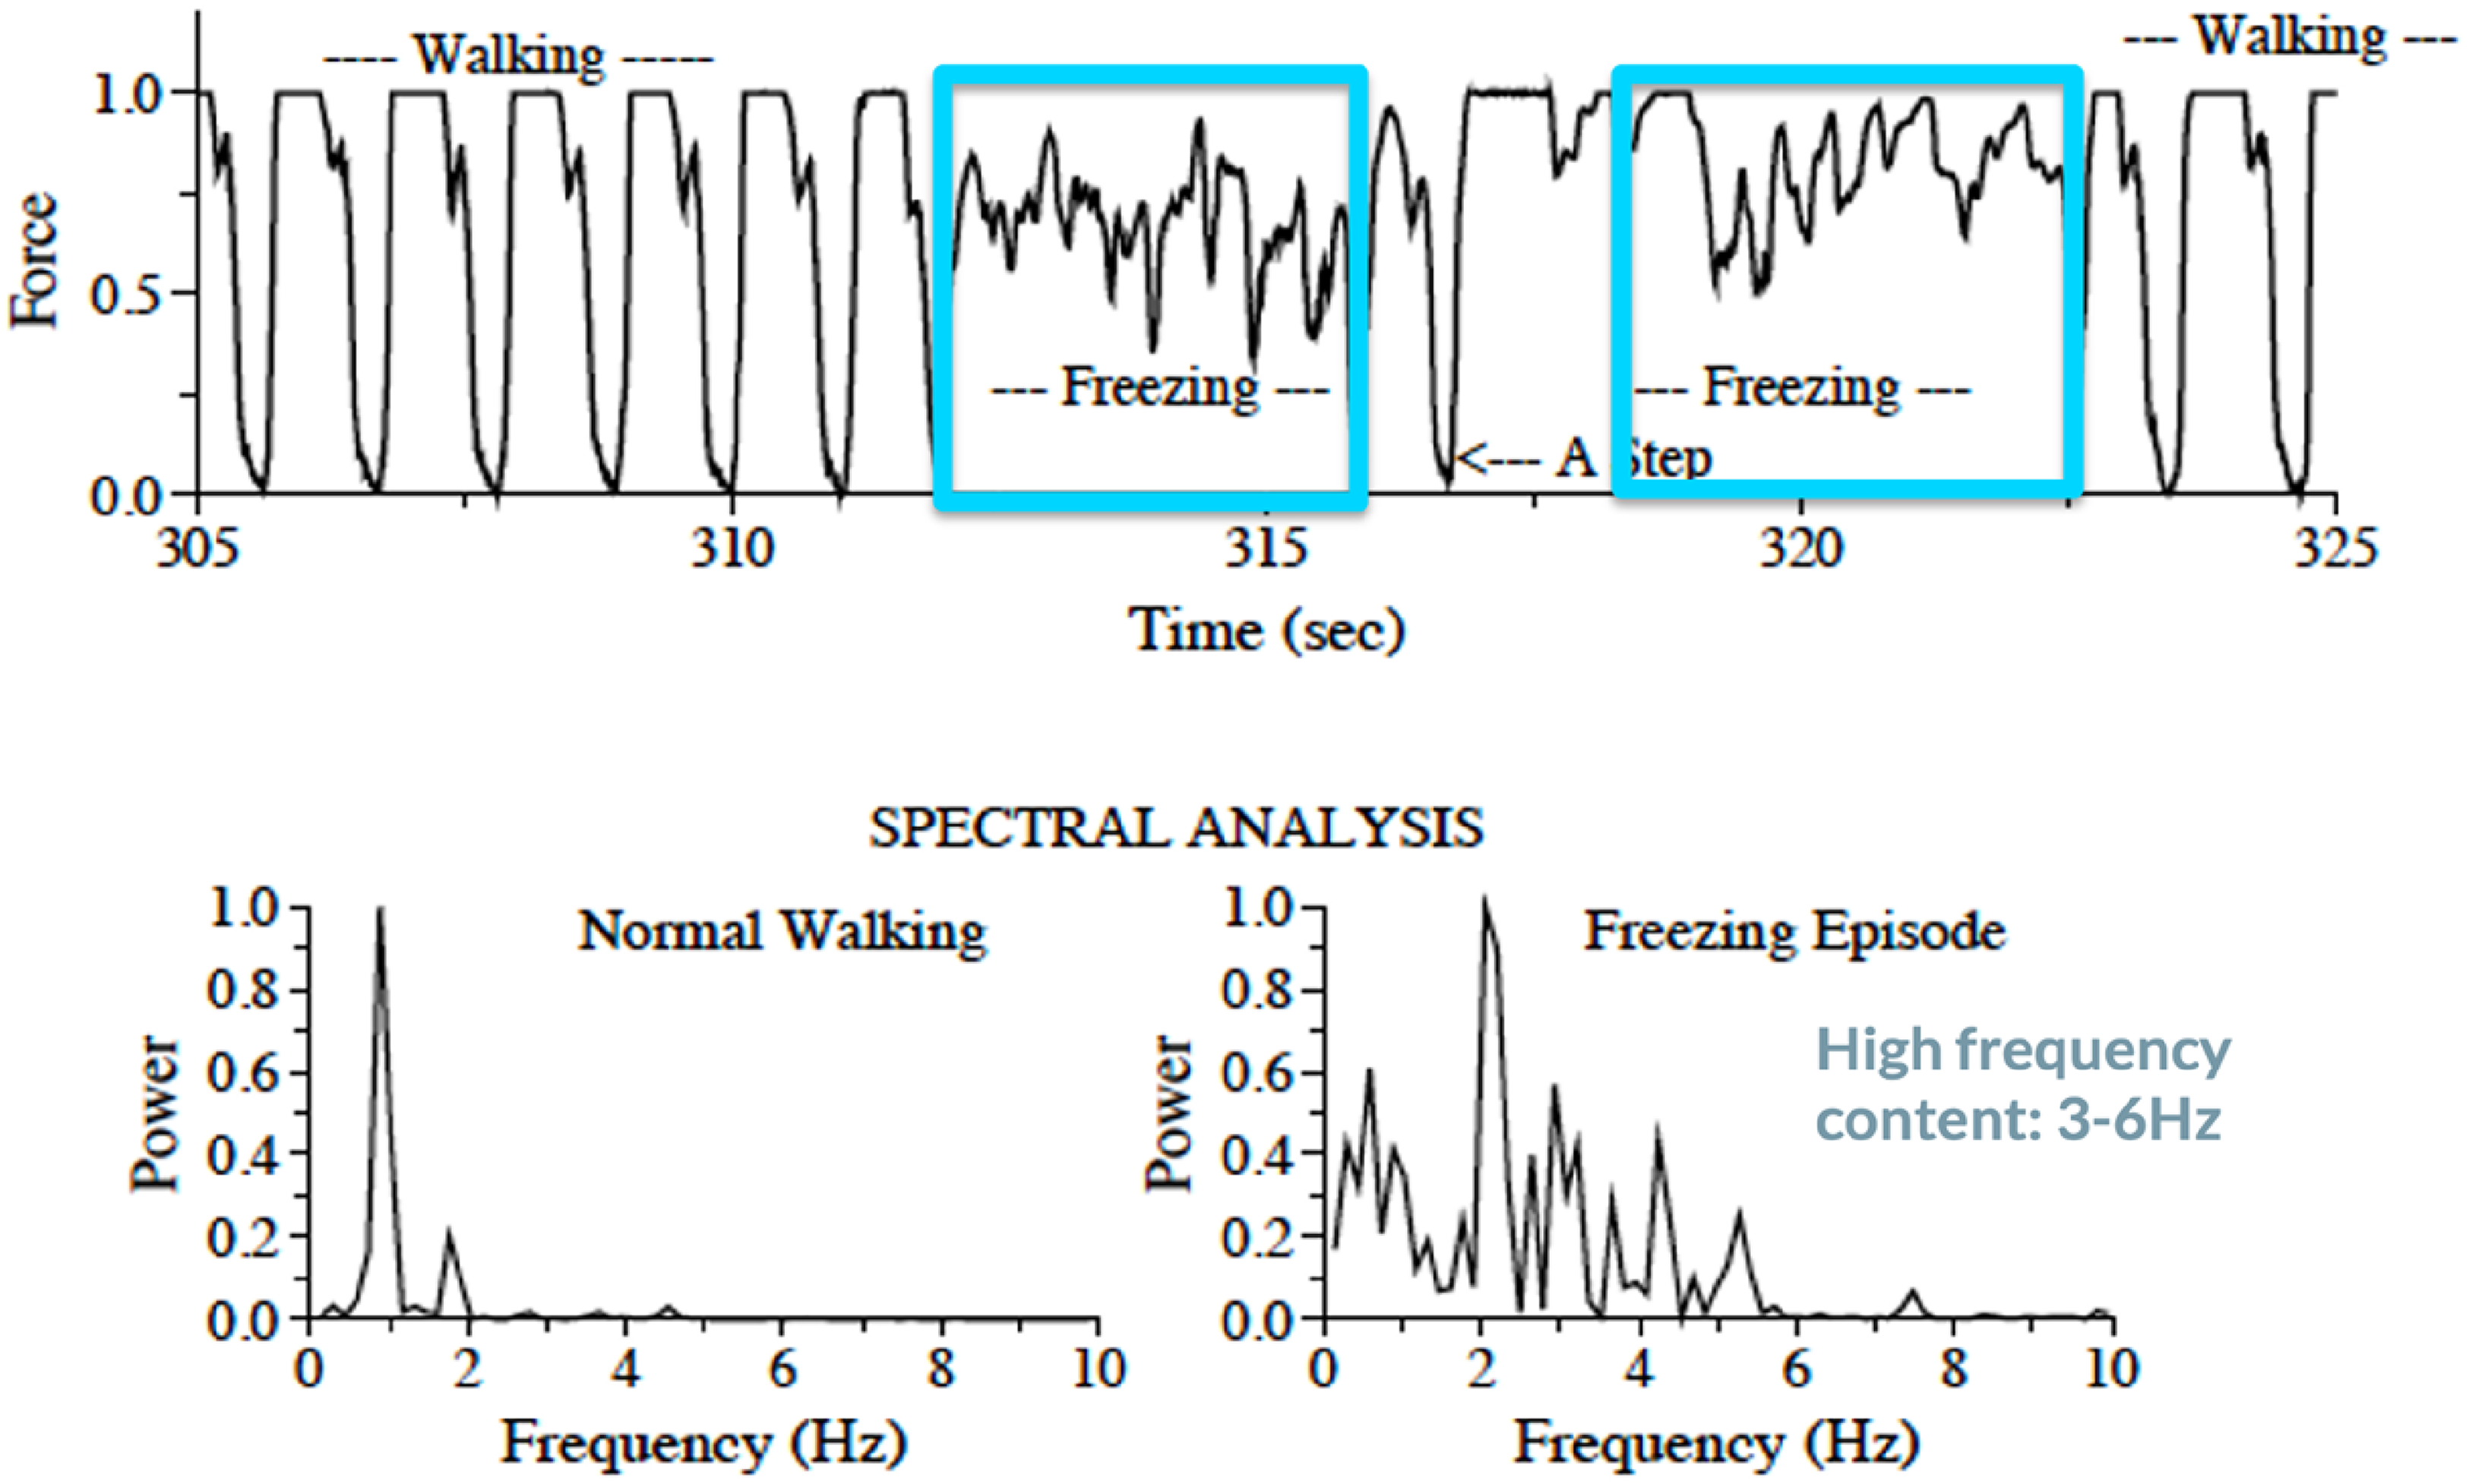
Insole force during and before FOG episodes captured in the laboratory. Upper panel: Representative example in one individual with FOG of the insole force while walking before and during a FOG episode. FOG episodes are marked in blue. Lower panel: Spectral analysis during normal walking and FOG showing the complex oscillations during FOG. Adapted from Hausdorff et al., 2003. 19
3D optical motion capture
Optical Motion Capture (MoCap) systems, such as the ViconTM Motion Systems Limited (class I Medical devices with a CE-mark), use multiple infra-red or visual light cameras positioned on the walls of a dedicated gait laboratory to triangulate and track the 3D motion of retro-reflective markers placed on the body. Many clinical gait laboratories subsequently use the “plug-in-gait” or similar biomechanical models, which use the 3D positions of the kinematic markers to infer an accurate 3D depiction of the movement of the major joints. 45 Optical MoCap is commonly used to identify upper- and lower-limb movement abnormalities in conditions like cerebral palsy 46 and has been used for basic and clinical studies of FOG in PD. An example of a FOG episode captured with optical MoCap is shown in Figure 4.
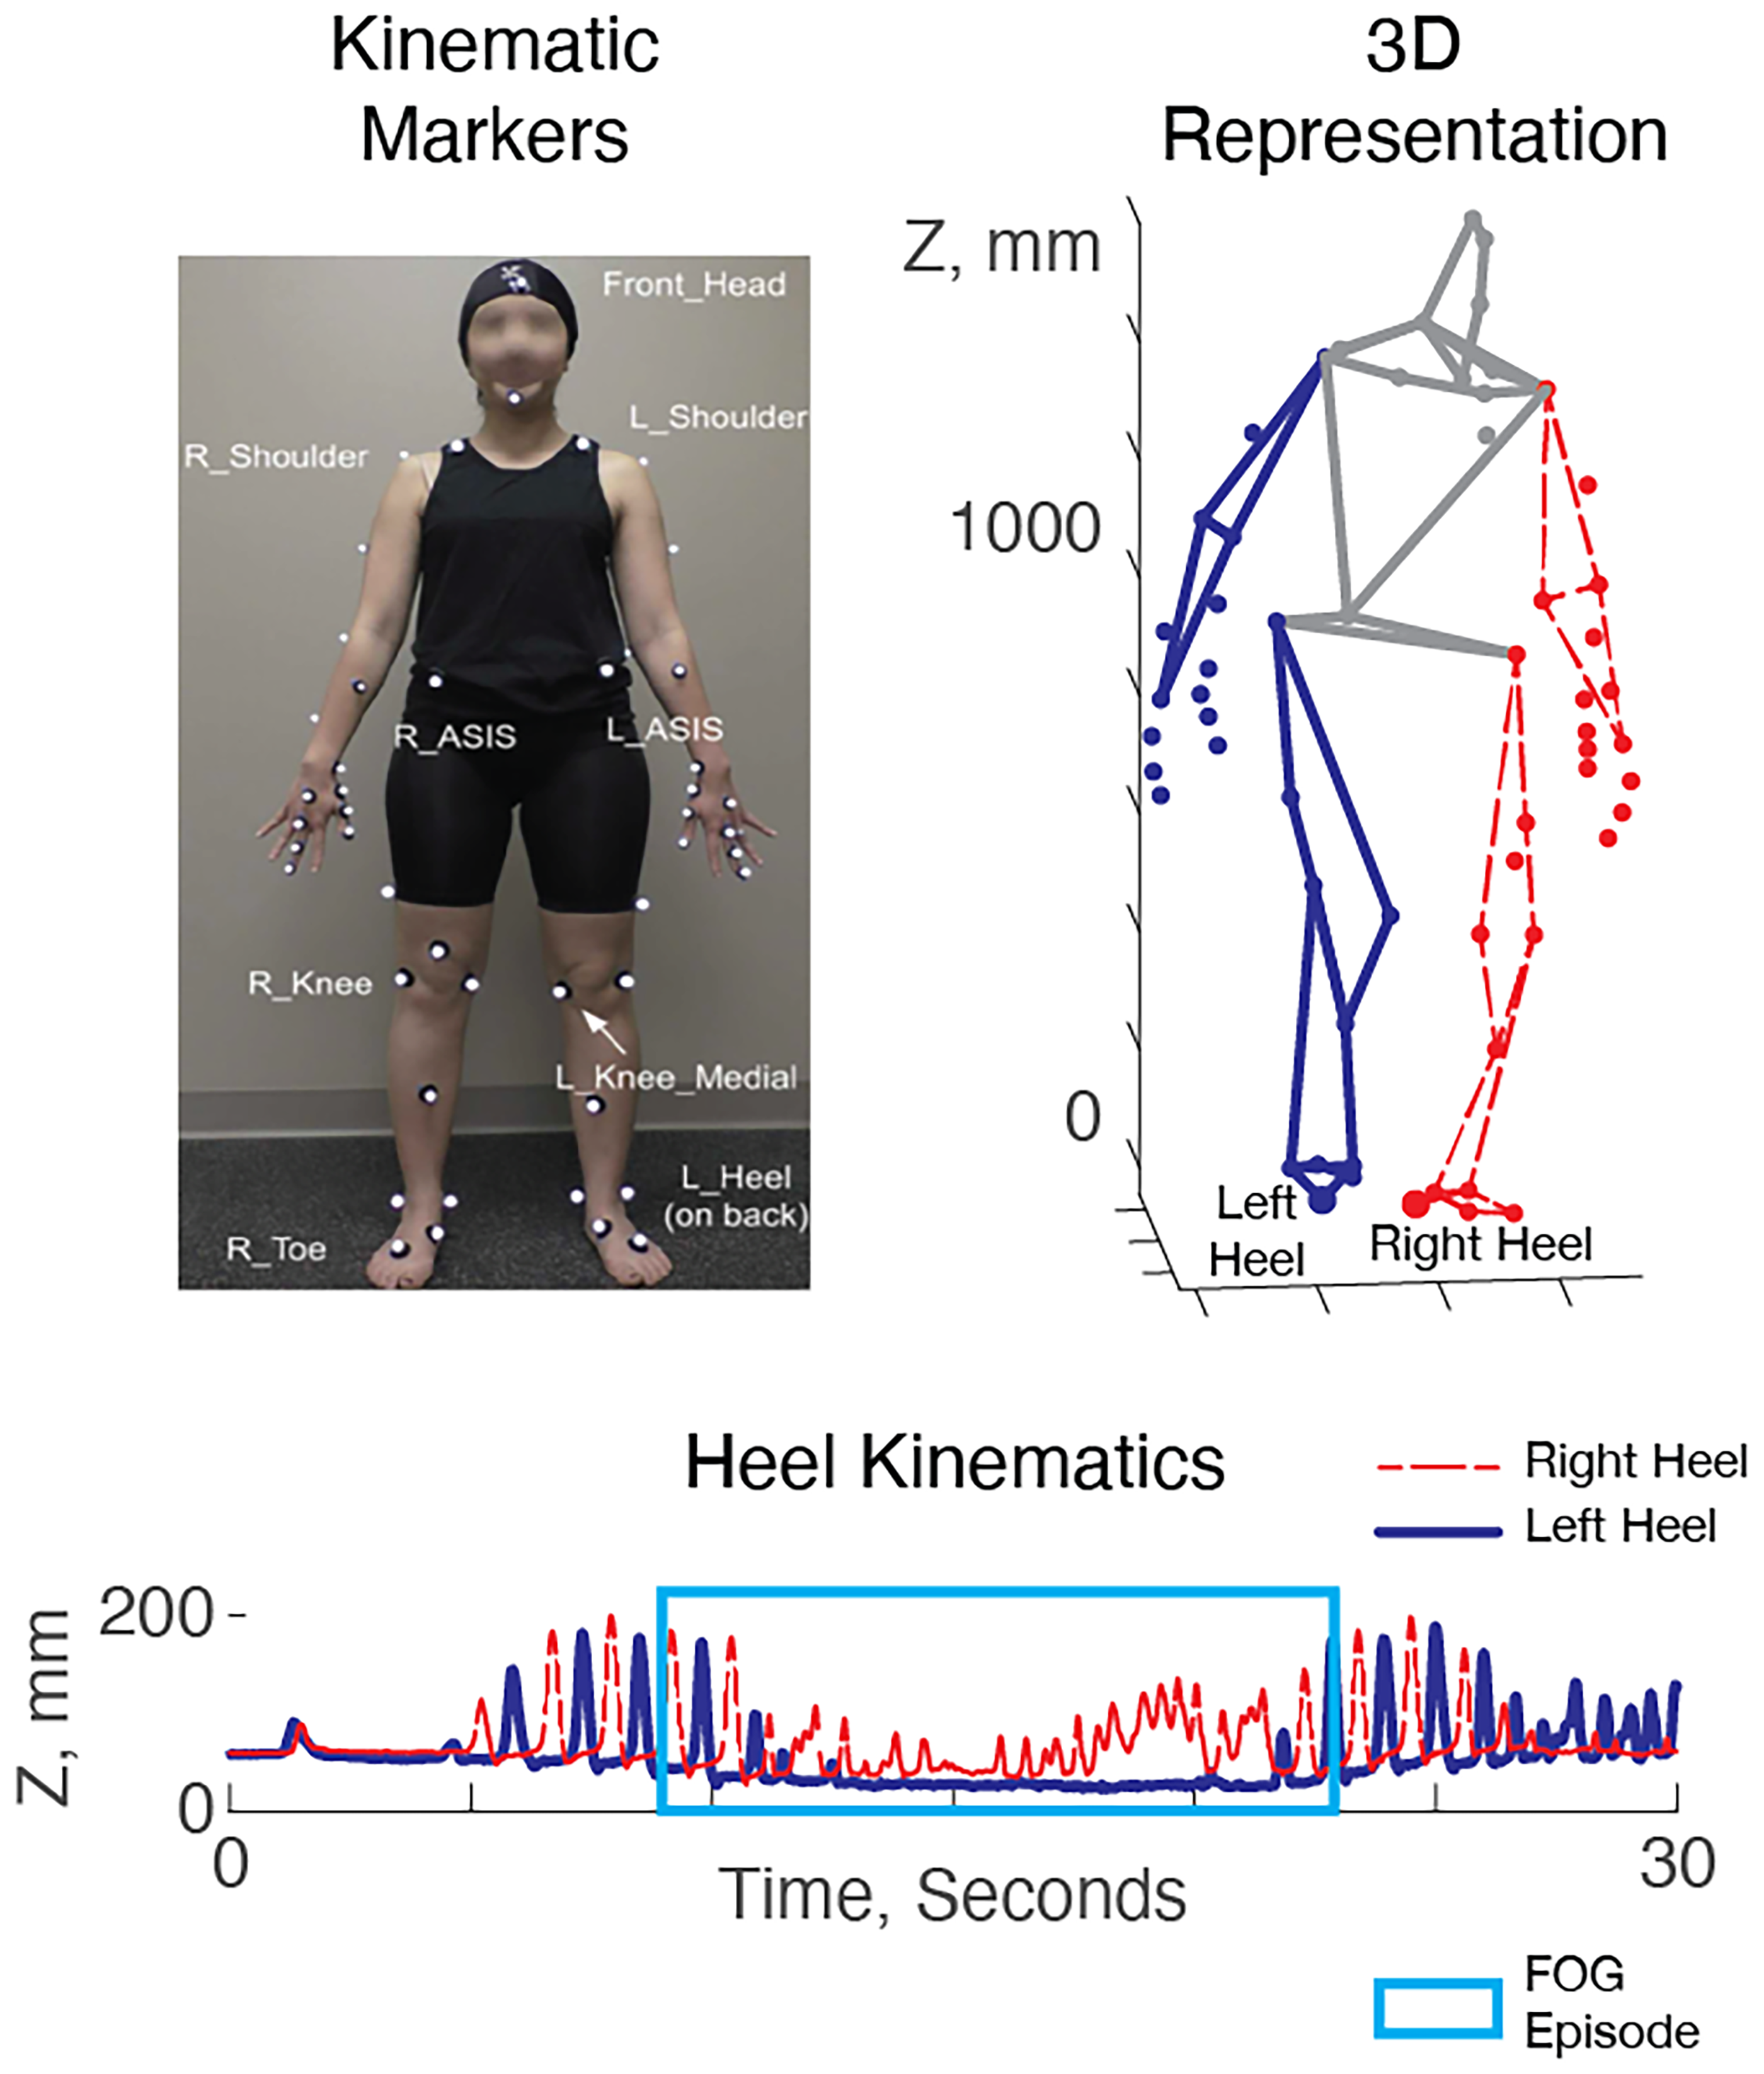
Kinematics of a FOG episode in 3D motion capture data. Left: A kinematic marker set used in a typical gait laboratory. Right: 3D kinematics during walking. Below: vertical position of the heel markers vs. time during a FOG episode. The right heel (red) oscillates while the left heel (blue) remains fixed to the floor. The FOG episode (blue box) can be identified via manual annotation or by (semi-) automated approaches.
Assessment
Because optical MoCap uses a 3D “skeleton” representation of the body, it can be used for manual FOG episode annotation in a similar manner to 2D video while enabling the blinding of raters to patient identities.4748–49 The same drawbacks of video annotation apply here (e.g., time-consuming and expertise required). Although optical MoCap is the gold standard to monitor pathological gait, only a few studies have used it to automatically assess FOG severity.1617–18
This is likely caused by the economic and time constraints that inhibit its routine collection (see Table 1).
A few automated algorithms for FOG detection and assessment relied on the use of graph convolutional neural networks (GCNs) 50 with good results; for technical details on this method see Supplemental Material, Section 2. In addition to detecting FOG, 51 MoCap in combination with GCNs has also been used to study the contributions of different body segments to FOG detection 16 and, consequently, the optimal positioning of wearable IMU sensors for FOG detection. 51
Mechanisms
Past research that utilized optical MoCap to study FOG can be roughly categorized into two domains: (1) Those that study gait and postural or gait differences between PD patients with FOG and PD patients without FOG, and (2) those that study gait and posture immediately preceding and during FOG episodes. The former group of studies identified that patients with FOG had increased cadence during turning,34,52 reduced walking speed, 53 reduced range of motion during stance, 54 and an overall more flexed posture. 55 The latter group of studies identified that gait and posture preceding and during FOG was characterized by an incremental decrease in stride length and time, 56 reduced range of motion in the hip, knee, and ankle, 56 a forward center of mass shift, 57 disordered temporal control, 58 and high-frequency oscillations in the lower limbs. 15 One study used a specific type of “attention-based” deep learning method to automatically classify FOG, enabling the study team to examine which elements of body motion were most relevant for the classifier for detecting FOG. Surprisingly, they found that multiple elements of upper body motion were of high salience. 16 This may suggest that sensing modalities that include only the lower body may experience limitations going forward.
Automatic video detection
As stated, visual inspection of 2D video is the current gold-standard to assess FOG severity. Nevertheless, annotating FOG from camera footage in an accurate manner is an extremely time-consuming and labor-intensive task that requires experts with sufficient training. One approach to addressing these limitations would be through automated analysis of monocular camera footage by machine learning methods. 59
This approach appears to have significant potential for clinical use because patient videos are common in movement disorders settings, especially those with a research focus. 60 Nevertheless, a few practical elements should be considered that may not be obvious on first sight. First, previous algorithms have been developed based on videos recorded in controlled settings where the patient is alone in a testing environment. The majority of videos produced in clinical use are in busy clinical settings where other caregivers and providers often appear, with minimal or no standardization. Thus, which person to attend to may be ambiguous to automated algorithms, 61 and manual annotation of a bounding box or similar region of interest may be required. As previous studies considered this issue variably, the performance of these studies may be difficult to compare. Second, the majority of efforts for automated FOG detection in 2D video rely on initial processing through a “pose recognition” algorithm (e.g., OpenPose 62 ), which presents the position of each “joint” as a pixel location within the video frame, rather than full 3D positions with respect to a constant reference point. This has the implication that camera position, camera movement, and the particular visual environment of different clinics may influence performance significantly. Thus, there may be more potential limitations to external validity in automatic video algorithms.
Assessment
Automated approaches tend to follow established machine learning pipelines developed in the “human activity recognition” literature within the computer vision community. First, videos are decomposed into separate single-frame images. Subsequently, pose estimation algorithms (e.g., OpenPose 63 ) are applied to identify regions of each image that resemble human “joints”. Next, these joints are assembled into complete “skeletons” described by the x and y locations of each joint in pixel coordinates. (Note that in this case the terms “joints” and “skeletons” are used in the computer vision community, but do not necessarily correspond to anatomical coordinates in human anatomy). The output data structure of a pose estimator is inherently very similar to that of an optical MoCap system, albeit that the positions of each “joint” are expressed as pixel locations within the video frame, rather than full 3D positions with respect to a constant reference point. In the next step, the skeleton sequences are used as an input to a deep learning algorithm (such as graph convolutional neural networks50,64) designed to transform high-dimensional pose data into tractable measures of freezing.
As an alternative approach to deep learning, another study simplified the skeleton data by first calculating hand-engineered features (e.g., knee joint angles), which was followed by a traditional classifier to generate measures of freezing. 65
Both aforementioned study methods included only pose and motion information in the form of skeleton sequences and did not consider contextual information captured by the image sequences, such as the patients’ interaction with the environment. The work by Hu et al. 59 addressed this limitation by utilizing a 3D convolutional neural network, namely C3D, 66 to capture the contextual information gathered in the image sequences. Their results suggest that the addition of contextual information offers a minor improvement in FOG detection performance compared to a model that considers only skeleton sequences.
Mechanisms
So far, no studies using automatic video detection have been used to investigate the underlying mechanisms of FOG. Nonetheless, because 2D videos are widely accessible, we can imagine that this technology may be useful to address questions related to FOG mechanisms in the future.
Heart rate monitors
Research on FOG in the past two decades saw an increase of evidence aiming at investigating the role of the autonomic nervous system (ANS) in FOG assessment as well as in pathophysiology.28,63,67686970–71
Various methods exist to monitor heart rate. Electrocardiography (ECG) is considered the gold standard when measuring heart rate because it directly measures the electrical activity of the heart which can be picked up by sensors at the skin. Although most accurate ECG measurements are measured around the chest, emerging technologies make it possible now to also measure ECG signals at the wrist. Another technique to measure heart rate is photoplethysmography (PPG). PPG recordings are based on measurements of LED light absorption by the blood in the skin. By detecting blood volume changes, it can measure heart rate indirectly. Due to its flexibility of use, i.e., it can be basically measured from anywhere in the body with adequate access to skin vessels, PPG is the technique currently used by most smart watches and heart trackers. However, PPG carries limitations for accurate data acquisition as the signal can be lost due to movement, ambient light, skin conditions, colors, and certain blood vessel characteristics. Recent work suggests that a combination of ECG and PPG may be the most optimal for heart rate monitoring. 72
Assessments
Existing results documenting ANS variations related to FOG occurrences28,67,68 suggest that ANS and motor pathologies in PD may interact more than traditionally conceived. More specifically, research showed that around 2–3 s before a FOG event, heart rate increases, and this increase also continues during freezing events.67,68,70 In contrast, during voluntary stops performed within the same gait trials, heart rate was shown to consistently decrease,67,70 as expected when transitioning from walking to rest.
Although these results sound promising to be used for FOG detection, heart-related measures can currently not be reliably used as a single modality to detect or predict FOG episodes, probably due to the many factors influencing changes in heart rate. One study used only features from an ECG to predict (classify before they happen) FOG events. 73 Although some differences were found between walking, pre-FOG and FOG, these were not reliable enough to build an accurate classification model. Similarly, another study exploring electrodermal activity (skin conductance) as a substitute measure for ANS activity, reached a sensitivity of 71.3% for FOG prediction with an average prediction time of 4.2 s before the freezing event, however, with 31.5 false alarms per hour.
Nonetheless, given the compelling evidence reviewed above suggesting an involvement of ANS activity in FOG phenomena, we encourage future studies to combine heart rate (or skin conductance) with other techniques for FOG detection/prediction (e.g., IMUs) to potentially improve detection/prediction outcomes. 28 Potentially, these measures may reflect an internal anxiety state or “willingness to move” during a FOG episode thereby providing information that can be missing from IMU sensors or other movement-based technologies (e.g., to differentiate FOG from a voluntary stop).
Mechanisms
The mechanism behind the heart rate increase around FOG episodes has been subject to discussion. Some authors linked the documented heart rate increase around FOG events to anxiety-related effects, ultimately proposing a sub-type of freezers for which anxiety is the main FOG triggering factor.68,69 Other authors, however, suggest that this increase in heart rate may reflect a general effort to move forward and is independent of the subtype of freezing. 28
Another interesting path of research focuses on differences in heart rate variability between people with and without FOG. Heart rate variability is considered a marker of sympathetic and parasympathetic activity, thus providing indirect insight into ANS regulation. 74 ANS alterations in persons with PD are well documented, with cardiac sympathetic degeneration and α-synuclein pathology often observed in pre-symptomatic and early-stage individuals with PD. 63 These conditions were shown to concurrently increase with the severity and duration of the disease. More specifically, α-synuclein pathology has been observed in the heart in more than 60% of people PD, in the nerve fibers around the coronary arteries and in the myocardium (for a recent review see 63 ). One recent study showed that heart rate variability recorded either prior or during gait (while off levodopa) was significantly lower, i.e., more disrupted, in freezers experiencing a FOG episode than freezers not experiencing a FOG episode during that specific assessment. 70 Heart rate variability measures may develop our further understanding of the pathophysiology related to FOG, as they may be promising to capture intrinsic day-to-day susceptibility for the occurrence of FOG (see later ‘Emerging technology to capture intrinsic factors’).
Measurement recommendations
Based on our review and discussion of the above-mentioned technology, we identified the best suited technologies for assessing FOG during the newly developed standardized GP-ClinRO, that was developed by the Standardized Assessment Group of the 2023 Freezing of Gait Workshop. In the next section, we present this clinical assessment protocol and provide recommendations for a standardized way of measuring FOG during the protocol using two video cameras and five IMU sensors.
Behavioral testing conditions
Because of the difficulty in eliciting FOG reliably in controlled settings, the current draft of the GP-ClinRO contains items demonstrated in previous studies to be the most successful at eliciting FOG. Briefly, the GP-ClinRO consists of asking participants to complete the following eight tasks, including several around a 50 cm×50 cm square taped in the floor of, as quickly and safely as possible: (1) Walk 3 meters, turn 180 degrees within a square on the ground and return to a chair; (2) Dual-Task Walk with a concurrent cognitive task (serial subtractions); (3) Walk 3 meters, when you step on the square in the ground bend and pick an object, turn 180 degrees and return to chair; (4) 360-degree Turns clockwise and counter-clockwise x 6 in a box; (5) Dual-Task Turns; (6) Box Shuffle with small steps around the square; (7) Box Agility Stepping, taking small forward, sideways, backward, and sideways steps around the square in the ground; and (8) Walk Through Doorway. Immediately after each test, the clinician will score the cumulative duration and frequency of FOG (i.e., no, 1 brief FOG, many brief episodes, many long episodes or unable to do the task). The GP-ClinRO will also be videotaped for rating by trained personnel. The FOG severity score from the GP-ClinRO constitutes of the sum of the cumulative duration (0–4) and Severity (0–4) across the 8 tasks.
In addition, it was recommended to collect two walk trials over a 10 m path: (1) non-interrupted gait, participants are asked to walk at their comfortable speed over the 10 m and stop at a line, and (2) interrupted gait, participants are asked to stop 3 times during the 10 m walk, so that the FOG can be distinguished from a voluntary stop. We note that key details of this draft protocol are likely to be changed as part of the ongoing validation and refinement process.
Video measurement and annotations
We recommend that the testing session is recorded with at least two video cameras, one in the sagittal and one in the frontal plane, to enable offline video rating. Precise synchronization of multiple cameras is not required for rating, but can be accomplished with commercial “timecode” systems, ad-hoc software, or more simply with a “clap board” that establishes a unique event that is common across cameras during recording.
As mentioned above and in Table 1, the gold standard for FOG assessment is based on video annotations. Two publications7,75 proposed a standardization of video annotation using open-source software (i.e., ELAN) offering helpful templates to calculate the % time spent FOG automatically. According to these guidelines, videos should be annotated by at least two independent raters. ELAN, an open-source software to score FOG video, could be used for annotation and in characterization of the FOG phenotype (i.e., trembling, shuffling). From ELAN, the annotations are subsequently exported to the other open-source tool “FOGtool” to compare the ratings and/or calculation of % time spent FOG.7,75 It should be mentioned that the ELAN software is not yet validated for use on the abovementioned GP-ClinRO tests. This way of annotating files, however, allows for precise comparison with technology-based methods of identifying FOG episodes.
IMU measurement
In addition to the 2D video gold-standard, we agreed that the easiest technology to use, backed up with the majority of studies in literature, was IMUs. Specifically, we recommend adding five IMU sensors while performing the tasks: one on each foot, one on each shin, and one at the lumbar spine (see Figure 5). From these data, multiple approaches can be taken to extrapolate objective FOG measurements (see the above review and example below in the algorithms section). Currently, we do not advise one approach to measure FOG as the most optimal algorithm has still to be defined, but we believe that using the draft GP-ClinRO protocol (or some of its components) in the same standardized way together with gold standard videos, will ultimately help to develop the most optimal FOG measurement algorithm.
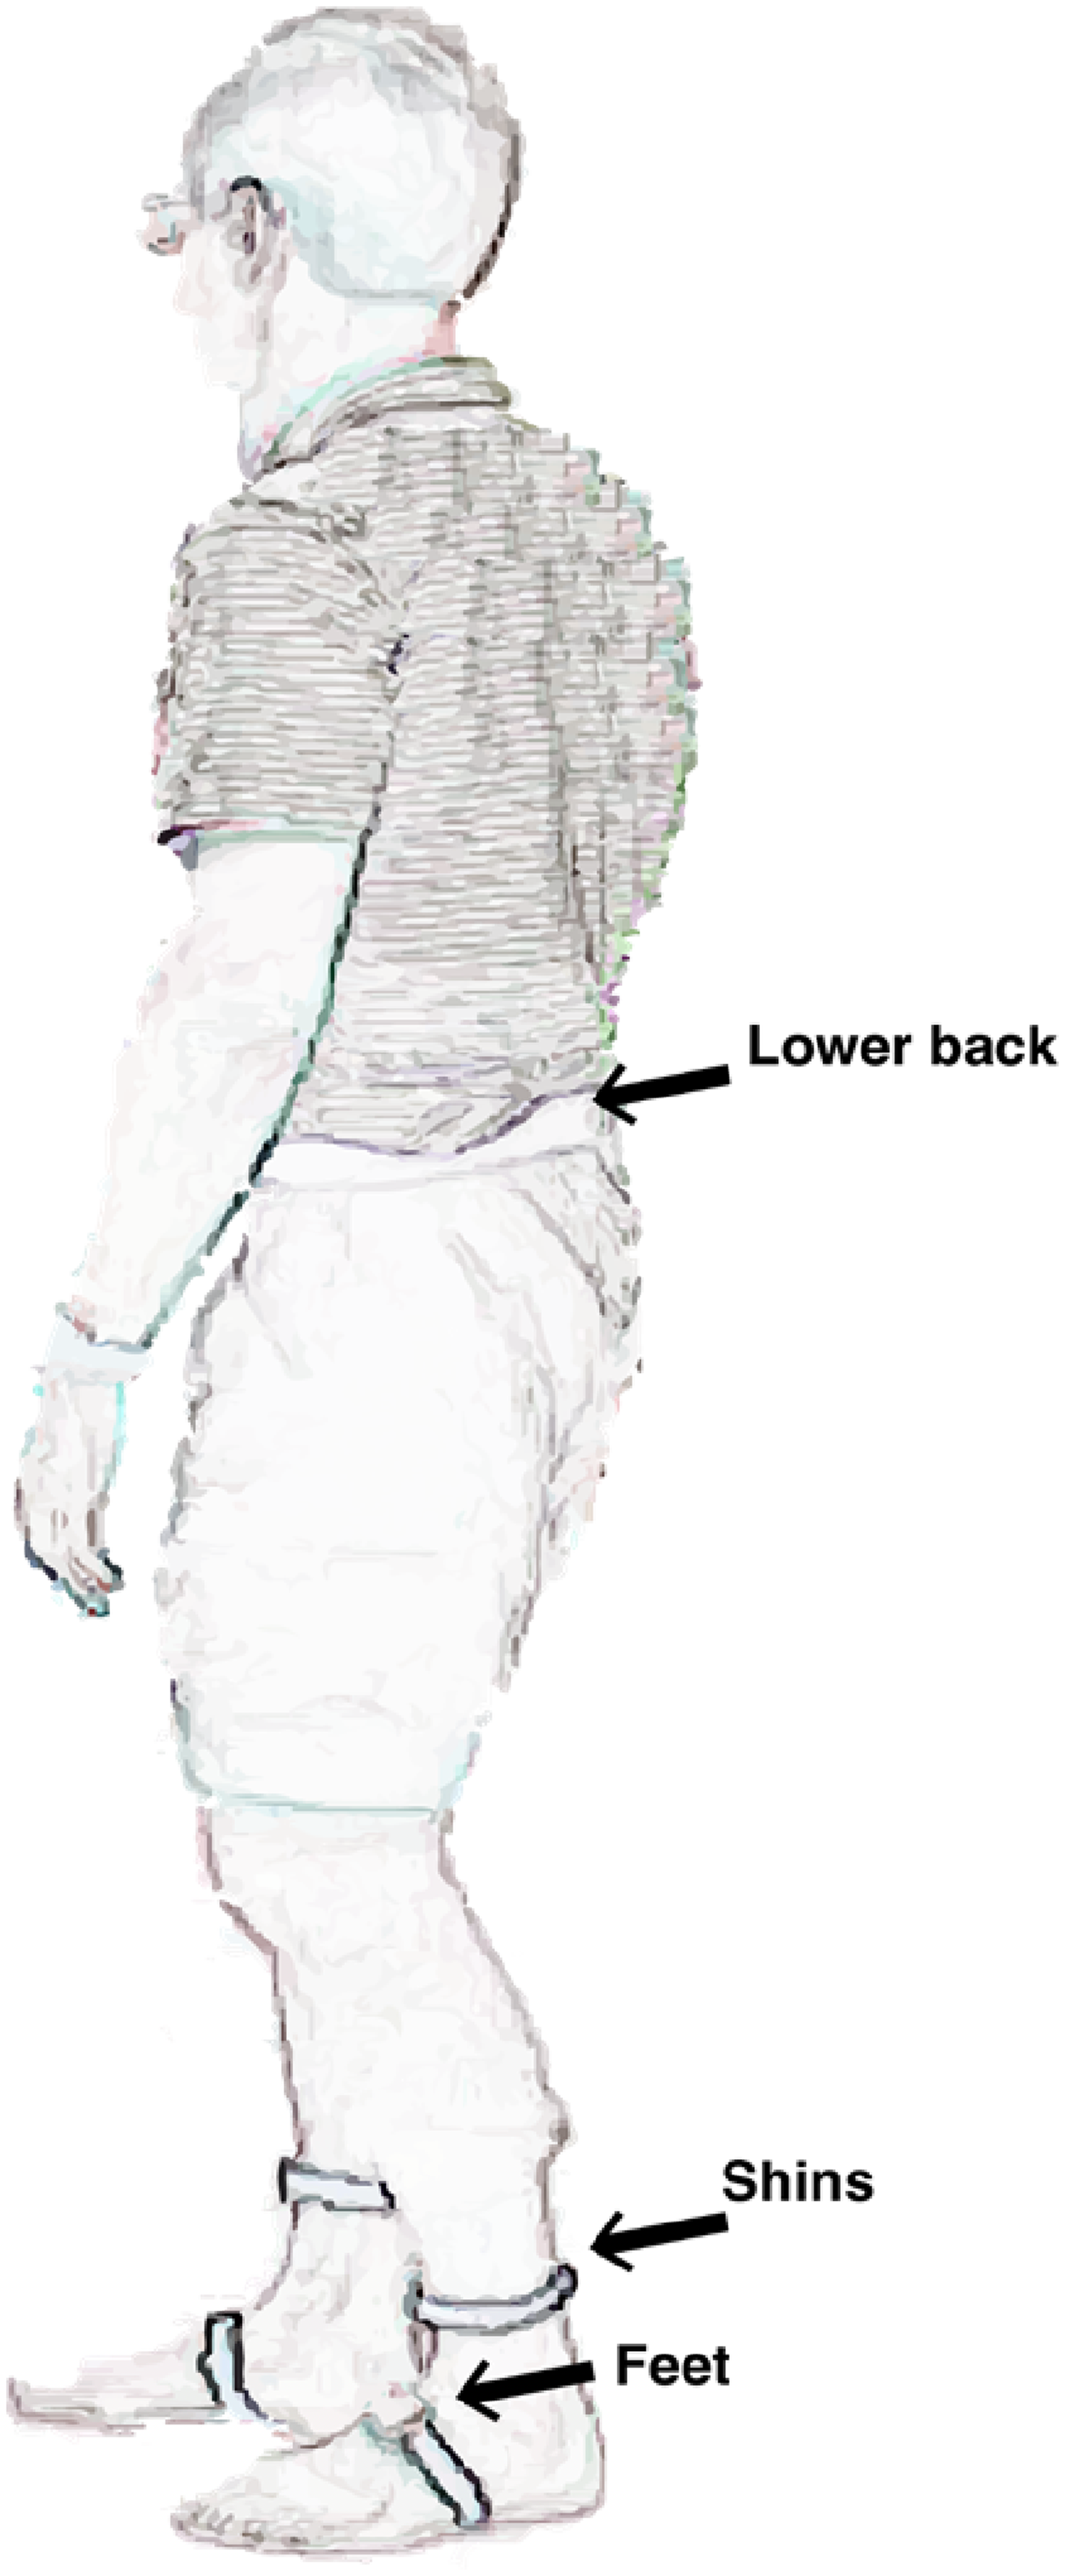
Representation of recommended position of IMU sensors on the body while performing motor tasks to assess FOG.
Algorithm evaluation
Many FOG detection algorithms have been developed in the past and most of them have been using their own specific ways to evaluate the performance of their algorithms. In the following section, we review the benefits and drawbacks of several evaluation methods and performance measures for these algorithms. Next, we warn of the potential biases that can occur when evaluating an algorithm by presenting two case studies. We finish this section by giving recommendations on how to evaluate future FOG detection algorithms.
Early implementation
Many centers have developed algorithms using data from body-worn sensors or 3D kinematic data to attempt to objectively measure FOG based on observed power within a specific frequency range, sometimes referred to as the “freeze band.”27,7677–78 During tremulous freezing episodes, sensors or markers on the lower limbs demonstrate oscillatory power around 3–15 Hz. The instantaneous amount of freeze band power can then be compared to pre-specified thresholds to determine whether FOG is present or not. This type of FOG detection has been proposed for at least 15–20 years. 79 These approaches worked well for evaluating tremulous FOG episodes, but typically were unable to assess purely akinetic freezing episodes, have difficulties to differentiate FOG from stopping, 32 and did not perform as well as other detection approaches. 80
Current performance measures
FOG assessment methods are commonly constructed as a supervised classification problem, in which the aim is to devise a method for assigning a label from a finite set of classes based on variables measured by one, or a combination of, the aforementioned technologies. The majority of FOG assessment methods focus on binary supervised classification. 27 In this approach, the finite set of classes includes two, i.e., “no FOG” and “FOG.” Some studies may include an additional class for pre-freezing behavior,44,81,82 usually with the aim to classify FOG early and trigger a therapeutic intervention (e.g., audio biofeedback), or may include additional classes for FOG manifestations.83,84
FOG assessment methods have typically been evaluated with k-fold cross-validation. In k-fold cross-validation, the dataset is either partitioned randomly into k equally sized subsets, often referred to as “folds,” or partitioned into subject-specific subsets. The latter has often been used in the extreme setting where the number of folds k equals the number of subjects, often termed “leave-one-subject-out” (LOSO) cross-validation. Of the k subsets, data from one subset is held out for testing, while the data from all other subsets are used for training the model. This step is then repeated k times for each subset in the dataset, one by one. The k performance measures are then typically averaged to provide an overall assessment of the model's performance. The choice between random or “subject-wise” k-fold cross-validation depends on whether the aim is to construct an estimate of performance on new observations from the same subjects (often also called “subject-dependent” algorithms) or construct an estimate of performance on previously unseen subjects. In the latter case, observations from one subject should only be contained in one of the folds (if the observations were in more than one k-fold, then the observations from the same subject would be in the training and testing set, leading to possible overoptimism). If the aim includes optimization of a model selection criterion, then nested cross-validation approaches should be considered, 85 so the test set remains completely separated from the training and validation sets.
No single performance measure captures all the desirable properties of a FOG assessment method, which is why several metrics are typically reported. Commonly used performance measures include sensitivity (true positive rate and recall), specificity (true negative rate), and the Area under the Receiver Operating Characteristics (ROC) curve (AUC), which considers the trade-off between sensitivity and specificity. Alternative measures such as precision (and the associated Area under the Precision-Recall (PRC) curve (AUPRC) 13 ), Matthew's correlation coefficient, and F1-score have been used less frequently. Yet, these measures may be more informative when evaluating binary classifiers on datasets with imbalanced class distribution,86,87 such as FOG. These performance measures assess the reliability of the individual “no FOG” and “FOG” classifications. The individual classifications can additionally be used to estimate FOG severity outcomes, such as the percentage of time spent frozen (%TF) and the number of FOG episodes (#FOG). Several studies did so and assessed the association between the estimated outcomes and the gold standard by means of the Intraclass Correlation Coefficient (ICC) or the Bland-Altman agreement analysis (bias, minimal detectable change, limits of agreement) or by quantifying the absolute error.
Algorithmic biases
Case study 1: Influence of label preprocessing on external validity across sites
Despite robust validation schemes, there are still factors that could bias the evaluation of FOG assessment methods if not taken into consideration. Past research in this domain typically used windowing techniques to divide a continuous data stream (e.g., sensor data from accelerometers) into smaller, overlapping, or non-overlapping segments or “windows.” Next, machine learning techniques were used to analyze the features of each window and to assign a single label to the entire window. However, FOG tasks are highly dynamic and include frequent transitions between “no FOG” and “FOG.” This behavior can be problematic because a window that covers a transition period violates the assumption that a single label can be assigned to it (Figure 6). To circumvent this problem, past research generally introduced some heuristics to determine a single, consolidated label. Most commonly, this was accomplished through majority voting, in which the label is given to the most frequently occurring class within the window. 27 Some studies further simplify the training process, for instance, by removing all windows that contain a transition period. 88 It is evident that, while it is possible to apply this simplification to the training set, this should not be performed on the testing set because it will lead to algorithmic biases and overly optimistic results. In the next few paragraphs, we show on two real-world datasets that majority voting, a commonly used label processing scheme, is susceptible to introducing algorithmic biases.
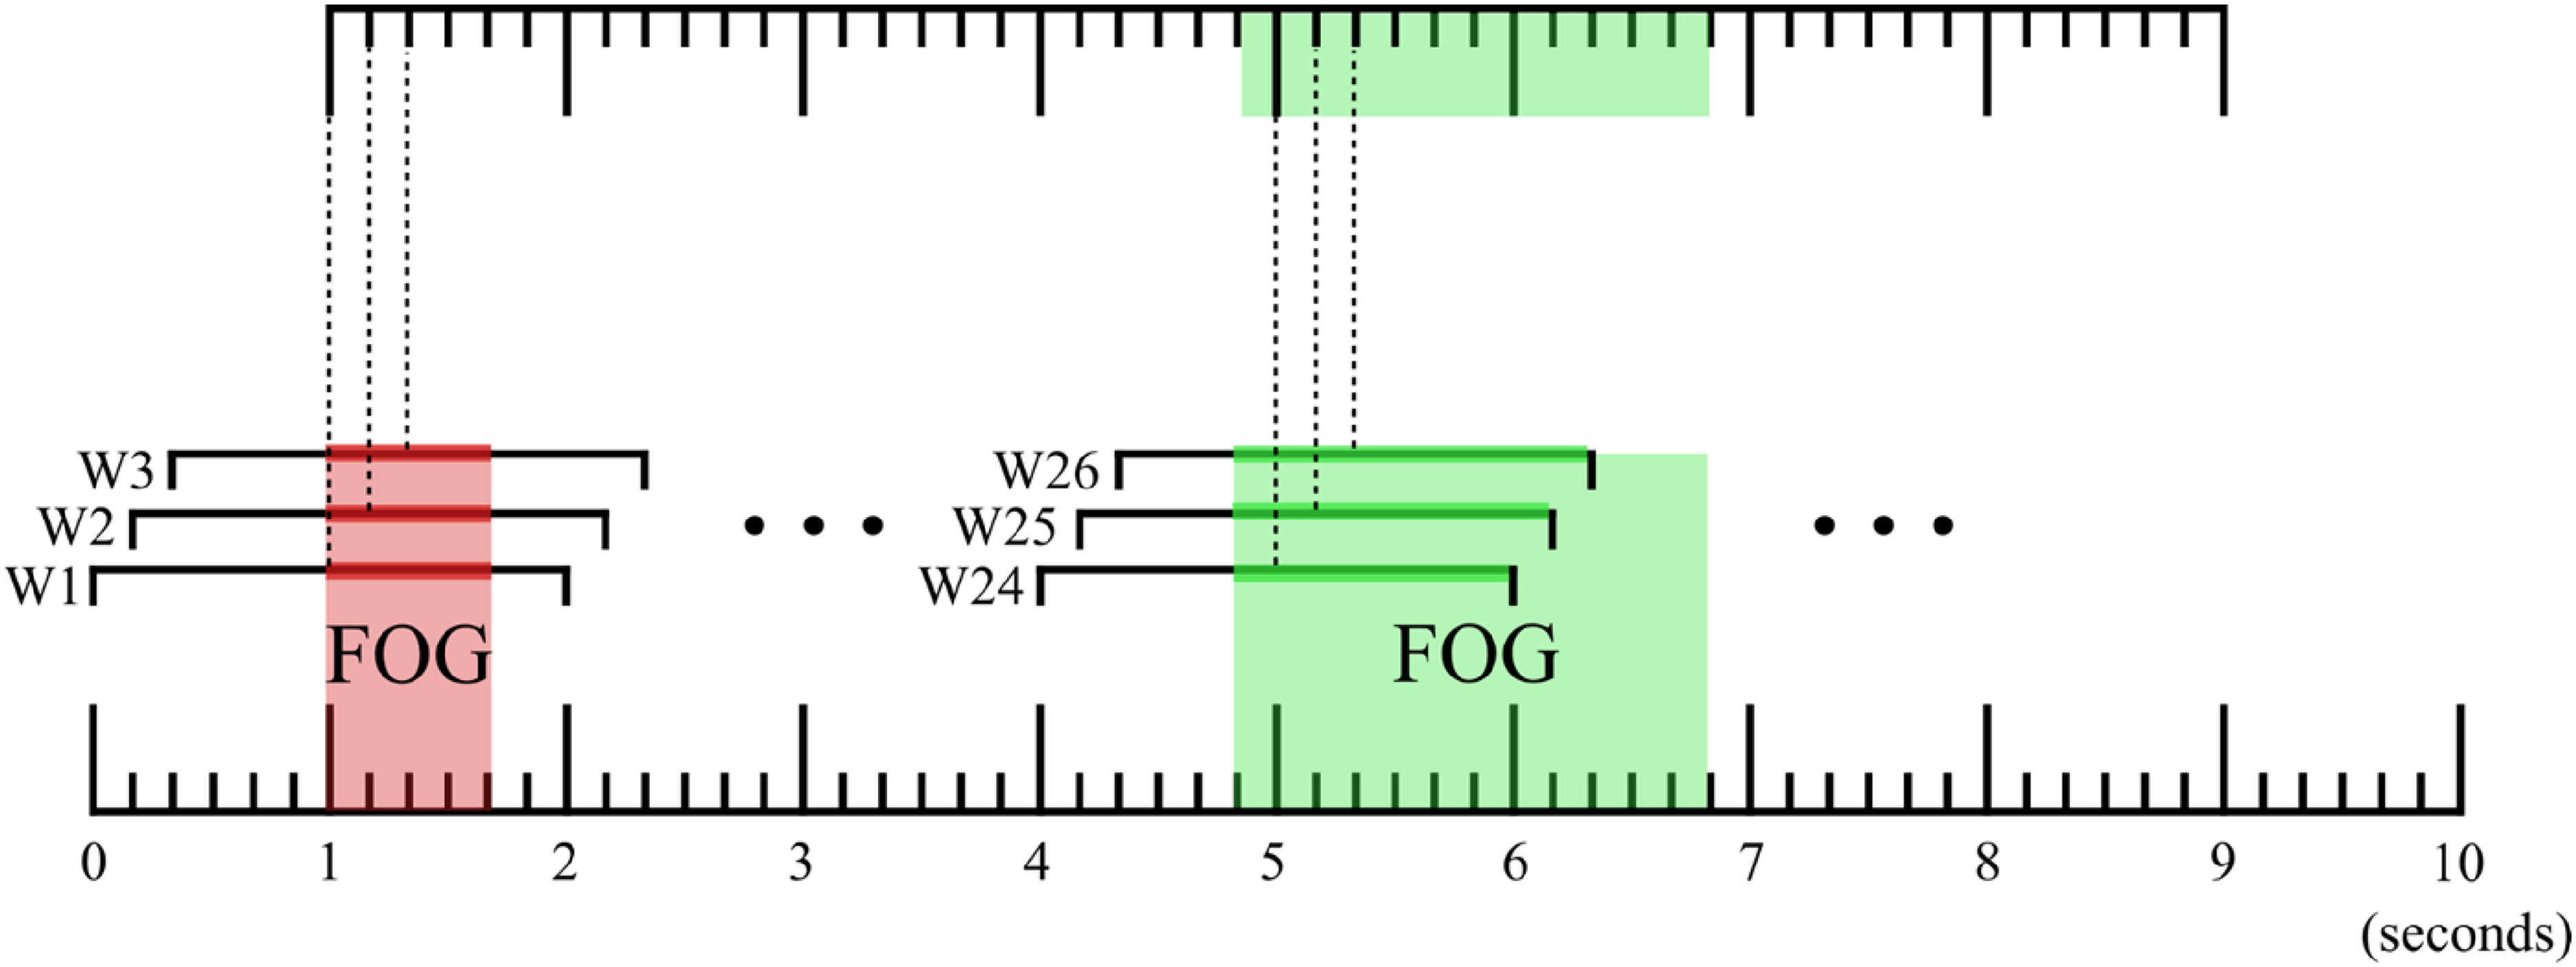
Illustration depicting the influence of preprocessing data on identified FOG start and stop times. The top timeline designates FOG episodes identified after majority voting; the bottom timeline designates expert annotations. Observe that majority voting can result in the removal of short FOG episodes, as shown in red. This effect is minimal in Dataset 1 but substantial in Dataset 2 – see the text for a detailed explanation.
We study the potential biases introduced by majority voting on two datasets, detailed characteristics are provided in Table 3. The two datasets contained a similar proportion of FOG, however FOG episodes were of shorter duration in Dataset 2.
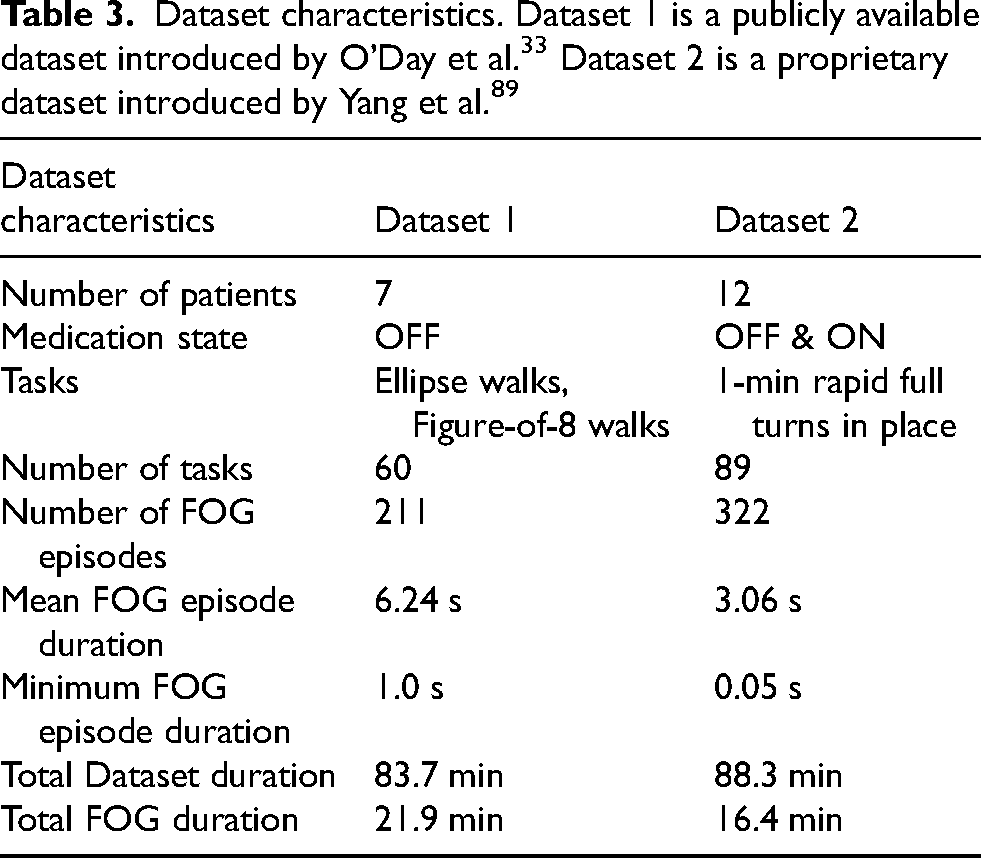
We used a sliding window of 2 s and strides of 1 sample, and re-computed the ground-truth label based on the majority label within the window (“majority voting”). The effect of it was compared with the unmodified “ground-truth” (see Table 4).
Dataset characteristics after label pre-processing with majority voting. Note the bias introduced by this pre-processing method, particularly in dataset 2, which includes a large proportion of very short FOG episodes.
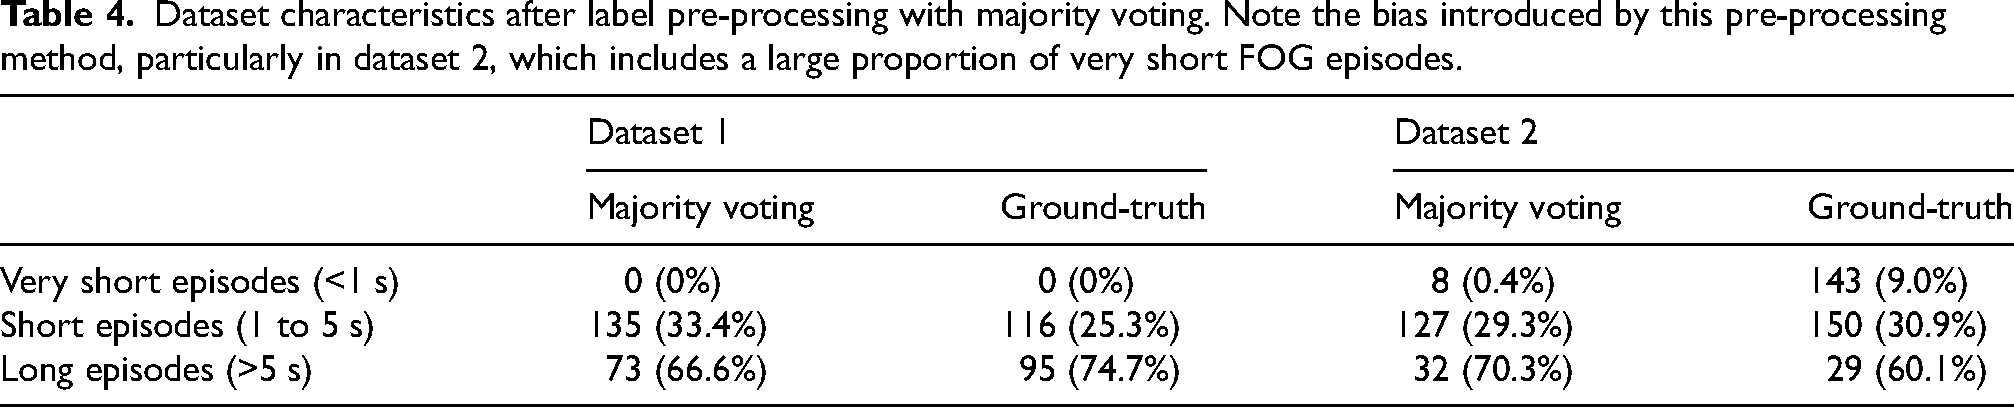
As Dataset 1 had no episodes that were shorter than half the duration of the selected 2-s window, majority voting only marginally changed the distribution of FOG episodes. On the other hand, Dataset 2 which had a higher proportion of very short and short episodes, was dramatically impacted by majority voting, which reduced the number of very short episodes from 143 to 8.
Case study 2: Performance measures and FOG durations
Performance measures are calculated based on the number of true positives, false positives, false negatives, and true negatives. For instance, the sensitivity is calculated based on the number of correctly detected FOG windows or samples (true positives) to the total number of FOG windows or samples (sum of true positives and false negatives). One drawback of these performance measures is that they do not consider that a long episode contributes substantially more windows or samples to calculate the measure. Consider a hypothetical classifier applied on Dataset 2 that correctly classifies all short and long episodes, and explicitly incorrectly classifies all very short episodes. This biased classifier has an F1-score of 0.87 with respect to the unmodified ground-truth. Despite the model deliberately misclassifying all very short episodes, which accounted for 44.4% of all FOG episodes of Dataset 2, there is only a minor difference from a perfect classifier with an F1-score of 1. There are more advanced performance measures borrowed from the computer vision action segmentation domain, such as the “overlap F1-score”, 90 which would consider consecutive FOG classifications as part of the same episode, ensuring that each FOG episode contributes only once in the performance measure calculation, regardless of the episode duration. For the aforementioned hypothetical classifier, the “overlap F1-score” was 0.70, showing a larger difference from a perfect classifier. For more details on the F1 score and why and when it should be used, please see Supplemental Material, Section 3.
Algorithm recommendations
Based on the case studies above, and in the context of the broader literature, we can make a few general recommendations regarding the implementation of algorithms for FOG detection in research or clinical contexts.
Report detailed dataset characteristics to allow the identification of potential data and algorithmic biases. Agreement tests calculated on summary FOG severity outcomes provide some insight into the clinical utility of FOG assessment algorithms compared to human raters. Nevertheless, they are insufficiently sensitive for comparing the performance of different classifiers. Consider, for instance, a TUG task during which the subject freezes once during the turning segment, but the algorithm detects the initial sit-to-stand as FOG. The #FOG would be identical even though the classifier is incorrect. Be aware that the effect of (very) short episodes may be underrepresented in traditional performance measures. FOG and dataset characteristics differ greatly across studies. Comparing the value of performance measures across different studies to evaluate the validity of FOG assessment algorithms may (if the dataset or pre-processing or validation techniques are different) not be fully informative. To have robust generalizability of results, priority should be given to test algorithms on external datasets (where no form of training was applied). Alternatively, for smaller datasets when this is not possible, subject-wise k-fold cross validation can provide a performance estimate on unseen subjects. However, it should be noted that this technique still assumes that the unseen subject is drawn from the same population. Given that the number of subjects, their inclusion criteria, and the carried-out gait tasks are often limited per study, it remains to be seen whether these algorithms can generalize across the broad subset of patients and tasks that are encountered in daily clinical practice. The domain would benefit from larger multi-center datasets with consistent evaluation protocols. Initiatives such as the recent Kaggle competition are a step in the right direction in that regard,13,89 as are publicly available FOG datasets.13,89 FOG assessment algorithms have been typically developed and validated on datasets that include standardized FOG-provoking protocols in the clinic. These protocols were designed to elicit FOG and are not necessarily a good representation of real-world behavior. If the aim is to assess FOG in real-world conditions, recent data shows that FOG assessment algorithms trained on such datasets are unable to distinguish between FOG and common real-world movements such as voluntary stops. To improve validity in the real-world, we recommend datasets to capture FOG in the real-world or include real-world movements in standardized protocols.
Lastly, also based on the two presented case studies, we want to describe two considerations. First, we acknowledge the significant limitations in Dataset 2, as previously discussed. In general, we align with the perspective of many experts in the field, who emphasize that almost all datasets and machine learning models have inherent limitations. The optimal approach is to utilize the data with an understanding of these limitations. Specifically, the concept of “model cards” has been introduced to document the recommended applications and limitations of datasets or machine learning models.
91
In developing large movement databases for conditions such as FOG, it is crucial to document the sampling biases present in clinical data collection to prevent the perpetuation of systematic inequalities prevalent in most healthcare data. Second, we note that because power analysis remains relatively uncommon in machine learning studies, many results should be interpreted with significant caution. This may be due, in part, to the fact that machine learning research is often conducted separately from data generation and hypothesis testing. Regardless of the cause, the result is that many machine learning studies are underpowered.
92
While some standardized approaches have been recommended,
93
they have yet to be universally adopted. The choice of cross-validation scheme can significantly influence model performance, particularly by either limiting or allowing overfitting.
94
The proliferation of machine learning toolboxes in standard computing packages such as Matlab or Python encourages the application of models to inappropriate data, compounding this problem further. Caution should, therefore, be applied.
Outlook for emerging trends in technology in 5 years
Research outlook
The technology described in the preceding section of this review is focused on methods to quantitatively capture the characteristics of FOG episodes, particularly those that are evoked during the GP-ClinRO. The provoking factors embedded in the current draft of the GP-ClinRO (e.g., turning, dual-tasking) are designed for the purposes of ensuring construct validity of the outcome measures, reliability within and across centers/clinics, and ease and efficiency of use. However, in real world situations, a variety of intrinsic and extrinsic factors can shape the context in which FOG is triggered and contribute to the incidence and severity of episodes. Intrinsic factors include the presence and level of stress and anxiety 95 (see the section on the capture of heart rate variability data), cognitive status, medication status, daytime sleepiness (e.g., circadian rhythm disruption) and fatigue. Extrinsic factors include static and dynamic components of the environment which can provide somatosensory, visual or auditory stimuli that either provoke (e.g., through a sense of threat; obstacle, narrow doorway), prevent, or facilitate recovery of a FOG episode. Technologies are rapidly emerging that will provide the means to capture and quantify the intrinsic and extrinsic factors associated with FOG in conjunction with the objective characterization of the FOG event itself. Mobile health technologies are already available for monitoring mobility and everyday function in people with PD,9697–98 but it is critical that kinematics/kinetic measures of FOG are captured in the context of the surroundings and state of the individual. These data will provide an increased understanding of the antecedents of FOG and will be critical for the generation of probabilistic predictions of forthcoming events and the development of real-time interventions to prevent or reduce the severity of episodes.
Lastly, sensor fusion and transfer learning techniques now make it possible to convert sensor data across domains, for example, to convert from video to simulated IMU data, 99 or to estimate precise kinematics from IMUs 100 or from IMUs with noisy video streams.101,102
Although sensor fusion approaches are not yet completely widespread, we believe that the emergence of this technology means that there is no need to recommend a single method of FOG measurement.
Emerging technology for capturing intrinsic factors
Stress and anxiety
Smartphone applications are increasingly being developed to capture mobile sensing data related to physiological metrics of stress. 103 These data can provide estimates of the exposure to, and levels of, acute and chronic stress. Smartwatch technologies are available that provide real-time estimates of heart rate, heart rate variability, blood pressure, blood flow, skin temperature and galvanic skin response, with varying degrees of accuracy. These data can potentially be used to monitor stress and anxiety levels that provoke FOG and provide real-time, closed-loop interventions that reduce the risk of an episode and help us understand what specifically triggers a FOG episode, one of the outstanding mysteries of FOG.
Cognition
Cognitive deficits are common in people with FOG and are a factor contributing to the incidence and severity of episodes. Deficits in frontal executive function, working memory, visuospatial abilities, attention and inhibitory control are particularly prevalent in FOG. 95 Recent advances in telemedicine and mobile phone apps provide the means to remotely capture cognitive capacity and function across multiple domains and thus provide information about the temporal correlation between FOG severity and variability in the expression of cognitive impairment within-individuals. This information, when combined with 24/7 capture of spatiotemporal gait and physiological (e.g., heart rate variability) data from wearables, and recording of medication status, will be critical in the phenotyping of individuals and the design of patient-specific treatment strategies to reduce FOG.
Medication status
The temporal dynamics and response fluctuations in medications (e.g., oral dopamine replacement therapies, anticholinergics, selective serotonergic reuptake inhibitors) can markedly impact the overall severity of motor and non-motor impairments in PD and, either directly or indirectly (e.g., as a sequelae of a shortened step length, cognitive slowing) affect the incidence and severity of FOG. Again, smartphone applications provide the capacity for patients to record the timing and dose of medications and their subjective impressions of the magnitude and temporal fluctuations in response. When paired with the capture of mobility metrics via wearables, patient-specific predictions of the interactions between medications and FOG can be made.
Sleep, circadian rhythms, and daytime sleepiness
People with FOG have worse overall sleep quality, increased sleep disturbances, and more daytime sleepiness compared to those without FOG. 104 They are also more likely to have disrupted rapid eye movement (REM) sleep, elevated muscle activity and dream enactment (REM sleep behavior disorder). Practical and low-cost technologies are rapidly emerging that provide polysomnographic measures of sleep physiology, metrics of circadian rhythms, sleep staging, quality and efficiency, and can track indices of alertness and daytime sleepiness headsets. 105 Wrist-worn actigraphy systems have algorithms that provide estimates of sleep stage duration, wakefulness and sleep efficiency. Day-to-day variability in sleep quality and resulting daytime sleepiness can impact FOG directly or exacerbate provoking factors such as stress and anxiety. 106
Fatigue
Fatigue is also a factor contributing to the incidence or exacerbation of FOG. 107 Wearable systems can be used for real-time monitoring of fatigue. 108 Metrics of fatigue can be derived using machine learning approaches based on wearable data from IMUs, electroencephalography, heart rate, respiration, skin temperature, electrodermal activity, electromyography and eye movements.
Emerging technology for capturing extrinsic factors
Extrinsic factors include static and dynamic components of the environment which can act as stimuli that either provoke or exacerbate episodes of FOG, or function to prevent or suppress the expression of FOG. Smart-glass technologies (e.g., Meta Ray-Ban Stories) provide the capacity to combine activity tracking with GPS-enabled capture of the environments and sensory surroundings (visual, acoustic) experienced during real-life navigation. The heads-up display function of such devices, in conjunction with advances in eye-tracking, will allow the study of the interactions of the individual with the environment stimuli and the sequelae of these interactions. These data will be critical for the design of environments that optimize mobility and minimize FOG episodes.
An increased understanding of day-to-day 24/7 fluctuations in motor function in both the awake and sleep states will be provided by data acquired using home-based video and radar systems. The advantage of these systems is that they are non-invasive and unobtrusive. Radar-based (Doppler) approaches have been developed to capture metrics of activity, gait 109 and nocturnal breathing 110 and sleep staging.
Another emerging technology for capturing extrinsic factors associated with FOG would be state-of-the-art Augmented Reality (AR) and Mixed Reality (MR) glasses, like Microsoft HoloLens 2 or Magic Leap 2, which are embedded with a sophisticated set of sensors mapping the environment and localizing the 3D position and orientation of the glasses therein, while also tracking and processing the point of gaze, the hands and speech. At the same time, the AR and MR glasses may be used to augment the real world with digital sound or visual stimuli, like AR cues111112–113 in a versatile manner. As such, AR/MR technologies will provide the capacity to explore novel hypotheses about the influence of environment factors and (augmented) sensory stimuli on FOG.
Emerging technology for capturing real-time electrophysiological data
Recent advances in systems to capture movement-related brain activity will provide the means to better characterize abnormal activity preceding and accompanying FOG episodes. Portable high-density functional near-infrared spectroscopy (fNIRS) and EEG systems are currently being used to capture cortical activity during gait under different contexts (e.g., dual tasking, obstacle clearance).114115116117118–119 Major technical challenges remain in deconvolving gait-related cortical activity from movement-related artifacts. Elegant algorithms for this process have been developed, 120 but the process currently requires the collection of data across a large number of gait cycles (due to the relatively low signal-to-noise ratio of fNIRs and EEG data). Thus, a considerable hurdle for implementing real-time closed loop EEG for predicting FOG is the capture and identification of a FOG biomarker from a short-epoch of data. Patient-specific machine learning approaches, as described in the previous section, hold the potential to provide this capability.
A major technological advance in the past decade has been the development of systems for the sensing of local field potential (LFP) activity from electrode leads implanted for deep brain stimulation (DBS). In 2020, the Medtronic Percept PC DBS system with “BrainSense” was approved by the FDA for the delivery of DBS. 121 This system provides the capacity to capture LFP time-frequency spectral data acutely in real-time (e.g., during gait), or peak spectral power chronically (every 10 min, 24/7). These leads are typically implanted either in the subthalamic nucleus (STN) or globus pallidus internus (GPi) in people with PD, but can also potentially be used to capture data from other targets such as the motor cortex. Studies using previous and current iterations of these DBS sensing and stimulation systems have been used to test the efficacy of closed-loop stimulation to gait deficits in PD.122123–124 The electrophysiological biomarker typically used to trigger stimulation is elevated power in the beta band (13–30 Hz), which has been shown to be elevated in the resting state, is suppressed by levodopa and the decrease in beta power correlated with improvement in MDS-UPDRS measures of bradykinesia and rigidity. This technology can also interface with cell phone apps (e.g., Rune Labs). Currently, considerable effort is underway using the Percept DBS system to capture and characterize the electrophysiological biomarker of FOG. In theory, the early detection of the FOG spectral biomarker can be used to trigger a tailored train of DBS that is designed to prevent the onset, or facilitate the recovery from, an FOG episode.
Clinical implementation outlook
Although there is significant potential for objective classification of FOG, as with other PD symptoms (e.g., tremor) 125 clinical uptake of these technologies remains slow. The reasons for this probably include barriers to entry related to potentially increased time to perform assessments, the need for specialized equipment, and appropriate billing, as well as questions of the additional value provided by such objective measurements. In many specialized academic centers in the United States, typical clinical visits are 60 min for initial assessment and diagnosis and 30 min for follow-up; and in European countries, this may be even shorter. Therefore, there is little time to perform the additional testing needed to accurately elicit and score FOG. Comprehensive behavioral testing with 3D kinematics can be reimbursed in the United States under Current Procedural Terminology (CPT) codes 96000 and 96004, and has been used for routine clinical testing in PD. 126 While there is limited systematic research on reimbursement frequency, our anecdotal experience suggests that Medicare and most private payers generally honor claims submitted under standard CPT codes (In the United States, Current Procedural Terminology, more commonly known as CPT®, refers to a medical code set created and maintained by the American Medical Association—and used by physicians, allied health professionals, nonphysician practitioners, hospitals, outpatient facilities, and laboratories to represent the services and procedures they perform). However, as far as we know, no reimbursement for 3D kinematic testing for people with PD exists in European countries. It is unknown whether additional objective testing will provide improved precision for FOG therapeutic trials. However, there is significant interest in the pharma community for objective measurements of gait and other domains. These objective outcomes may eventually turn out to surpass standard clinical instruments in terms of precision and reliability. Due to the necessity of optical motion capture for reimbursement under standard clinical use, it is likely this technology will remain the gold standard for model development even as we develop the next generation of body-worn sensors and video-based tools.
Conclusions
In summary, here we reviewed the literature related to the most promising technologies to measure FOG quantitatively and provided a minimum assessment to use with five IMUs and two video cameras during tasks that are known to elicit FOG in the laboratory. The use of this set-up will generate data for novel machine learning approaches to be used to automatically detect FOG and validate these approaches with the gold standard video annotations. In addition, we gave specific examples of biases of current algorithms to measure FOG and provided six recommendations for future work in this direction. Future work will also need to systematically address whether and to what degree the proposed technologies can be used to measure and distinguish different FOG phenotypes. Lastly, we provided a look at both technological and clinical implementations that could advance this field in the next 5 years.
Supplemental Material
sj-docx-1-pkn-10.1177_1877718X241301065 - Supplemental material for Technology for measuring freezing of gait: Current state of the art and recommendations
Supplemental material, sj-docx-1-pkn-10.1177_1877718X241301065 for Technology for measuring freezing of gait: Current state of the art and recommendations by Martina Mancini, J Lucas McKay, Helena Cockx, Nicholas D’Cruz, Christine D Esper, Benjamin Filtjens, Benedetta Heimler, Colum D MacKinnon, Luca Palmerini, Melvyn Roerdink, William R Young and Jeffrey M Hausdorff, in Journal of Parkinson's Disease
Footnotes
Acknowledgments
The authors thank the other participants of the 3rd International Workshop on Freezing of Gait that took place in Jerusalem (March, 2023) for their valuable input and assistance.
ORCID iDs
Funding
The authors received no financial support for the research, authorship, and/or publication of this article.
Declaration of conflicting interests
The authors declared no potential conflicts of interest with respect to the research, authorship, and/or publication of this article.
Supplemental material
Supplemental material for this article is available online.
References
Supplementary Material
Please find the following supplemental material available below.
For Open Access articles published under a Creative Commons License, all supplemental material carries the same license as the article it is associated with.
For non-Open Access articles published, all supplemental material carries a non-exclusive license, and permission requests for re-use of supplemental material or any part of supplemental material shall be sent directly to the copyright owner as specified in the copyright notice associated with the article.