
Abstract
The ubiquitous use of mobile devices in recent years has enabled learning more about human behavior. This study uses mobile phone data, point-of-interest data, and publicly available socioeconomic indicators to present an integrated analysis of individual socioeconomic and behavioral profiles in Lisbon. To effectively segment users and identify mobility patterns, we employ multiple clustering techniques tailored to different data types: varied density-based spatial clustering of applications with noise (VDBSCAN) detects meaningful places by identifying clusters of varying densities in mobile phone data, while K-Means and K-Modes cluster numerical and categorical data, respectively, to determine socioeconomic status (SES) and categorize work environments. Our analysis identifies four primary groups of individuals, each distinguished by different SES and behavioral tendencies, ranging from practical and family-oriented to lifestyle-driven patterns. The results show that SES strongly influences mobility behaviors and interactions with urban spaces, revealing disparities in housing access, services, and work environments between different population segments. These findings highlight the interaction between mobility, social habits, and economic conditions, offering key insights for urban planning and strategies to mitigate the impacts of gentrification. The proposed methodology can be applied to other cities to support inclusive policymaking, transportation planning, and spatial equity strategies, fostering more accessible and equitable urban environments.
Keywords
Introduction
Tracing users’ locations is crucial to understanding how individuals experience, navigate, and interact in urban spaces. Mobile phones play a fundamental role in acquiring location data, offering opportunities to uncover urban life patterns and dynamics (Ben-Gal et al., 2019). The insights from individual location data, such as mobility inference and profiling, are valuable for various applications, such as urban planning, public transport optimization, and even managing the spread of viruses (Rodrigues et al., 2023). Moreover, the identification of mobility patterns and user profiles based on routine locations is critical for urban management and planning. By examining how different groups—such as commuters, residents, tourists, and occasional visitors—navigate the city, urban planners can design plans and validate targeted interventions to meet the specific needs of each group.
In time and space dimensions, human movement patterns tend to exhibit regularity due to the structured nature of daily routines and spatial habits (Luo et al., 2020). Each individual typically follows a consistent travel distance over time. The return of users to a small set of locations is highly likely, despite occasional deviations (Gonzalez et al., 2008). In practical terms, people tend to revisit a limited, predictable set of points of interest (POIs), contributing to the high predictability of their movements (Ferreira et al., 2022). This regularity allows the creation of models that represent mobility patterns and identify significant locations such as home, work, and other places that are regularly visited.
In recent years, the widespread use of smartphones (Ghahramani et al., 2020) has turned mobile phone data into a prominent research topic (Blondel et al., 2015). The digital traces generated by mobile devices produce a rich and continuous stream of spatiotemporal data (Ferreira et al., 2022), widely used to obtain mobility and activity patterns (Okmi et al., 2023). In particular, call detail records (CDRs) are commonly used to infer these patterns and identify key locations (Rodrigues et al., 2022). CDRs capture interactions between individuals and the cellular network, documenting calls, text messages, and associated metadata, such as the tower ID that connects a phone, the time of communication, and the duration of the activity.
While CDRs are event-driven and depend on user activity, limiting their ability to capture continuous movement, location updates occur more frequently, as mobile phones constantly interact with nearby towers to maintain optimal signal routing. These two data sources complement each other: CDRs offer context-specific insights into users’ activity, while location updates provide more regular, continuous location tracking (Rodrigues et al., 2022). Combining these data types allows us to create more detailed geographic profiles, identifying meaningful locations and travel behaviors with more accuracy. Nevertheless, mobile phone data alone lacks contextual information about the activities taking place. Therefore, understanding the characteristics of the surrounding area and the nature of the locations is essential for the characterization of places and the overall construction of accurate profiles (Rodrigues et al., 2023).
Significant locations or meaningful places can be identified by ranking places based on the frequency and duration of visits (Çolak et al., 2015; Tongsinoot and Muangsin, 2017). Incorporating contextual information, such as the socioeconomic status (SES) of the area, from census data, can enhance the analysis of these locations. Additionally, databases such as Facebook Places or Google Places provide crowdsourced POIs, adding semantic features that allow a more meaningful classification of areas based on land use or human activity (Ferreira et al., 2022; Rodrigues et al., 2023). This data is collected through digital platforms and includes features of the geographical area, offering deeper insights into the relationship between location, event dependencies, and human behavior, contributing to the profiling of citizens (Dashdorj et al., 2014; Graells-Garrido et al., 2016).
The ability to profile human behavior is essential in the design and planning of smart cities (Steenbruggen et al., 2015). With the integration of new technologies, digital data is being leveraged to improve citizens’ well-being and reduce operational costs (Ben-Gal et al., 2019). By identifying lifestyle patterns, companies and policymakers can tailor services to different groups of citizens. For example, by recognizing frequent visits to certain places, citizens can be segmented by their lifestyle, regardless of their physical proximity, and services can be adapted to their needs.
This work uses mobile phone data, POIs, and socioeconomic indicators to profile different groups of residents in Lisbon. We propose a data mining methodology to describe behavior based on mobile data and build clusters of participants based on the similarity of their lifestyle behavior. The methodology follows several steps: (a) mobile phone data is analyzed to identify key locations such as home, work, and other significant locations, which are then classified using POIs; (b) Lisbon is classified in socioeconomic terms using census data; (c) profiles are established based on the SES of the identified home location, the types of POIs closest to the work location, and the POIs frequently visited; (d) individuals with similar profiles are grouped, and their patterns are analyzed. The profiling process does not depend on a person’s exact location or the time they visit places. Instead, it identifies people with similar lifestyles based on the types of places they go to and how often they visit them, even if they are in different geographic areas (Ben-Gal et al., 2019; Ye et al., 2009).
The proposed methodology can be described as a profile segmentation based on a feature-based clustering approach. The feature-based clustering is an unsupervised machine learning technique used to separate features of a dataset into homogeneous groups (clustering procedure, performed on features, and treating each feature independently) (Granville, 2023). The process consists of first using clustering to explore user behavior and characteristics in different fields and then using the analyzed behavior to segment clients. In other words, we use a double-clustering approach where we first cluster individual features (home and work context and lifestyle in terms of meaningful places) and then combine these clusters into a second-level clustering to find communities with similar behavior/characteristics.
Previous studies have used mobile phone data to extract meaningful places or to model mobility patterns. However, the analysis and classification of user profiles, combining the semantic meaning of locations and socioeconomic data, have been less frequently explored. The key contributions of this paper are fourfold: (a) proposing a methodology that employs multiple techniques, including clustering algorithms, to identify individual profiles and group them based on shared characteristics; (b) using a wide range of datasets to provide maximum context to the identified locations, allowing the identification of groups of citizens with similar lifestyles, even if they do not frequent the same places simultaneously; (c) the results can be used to provide an analysis of Lisbon not only in terms of resident profiles but also from socioeconomic and mobility perspectives, capturing changes in urban dynamics over time, and also giving an idea of the inclusiveness of the city; and (d) presenting a real case based on anonymized CDRs and location updates from over 1,000 Lisbon residents, with all locations identified at the antenna level. Moreover, the methodology can be applied to any geographic area, as long as the necessary data is available.
This paper is organized as follows: section 2 reviews several works that used mobile phone data to geo-profile and segment citizens; section 3 gives a brief introduction to the various types of data that are used in this work; section 4 presents the methodology applied and describes all steps necessary to achieve the results; section 5 presents the results of the home, work, and meaningful places identification, and the profiles identified, highlighting how the identification difference profiles contribute to the study of urban dynamics and inclusiveness; finally, sections 6 and 7 discuss and summarize the main achievements and conclusions of this work.
Related work
According to the literature (Bachir et al., 2019; Blondel et al., 2015; Calabrese et al., 2014), two types of Global System for Mobile Communications data can be distinguished: event-driven data, such as CDRs, which document interactions between a mobile device and the network, and network-driven data, such as location updates, which track cell tower connections. The spatiotemporal information provided by these types of data offers valuable insights into individual and community behavior, as well as group dynamics based on shared interests (Yalcin, 2017). These datasets have been widely used to identify meaningful places (Rodrigues et al., 2022), human activities and mobility patterns (Yuan et al., 2020), human dynamics (Novovic et al., 2020), commuting behaviors (Liu et al., 2020), and daily and weekly activity trends (Ferreira et al., 2022; Zinman and Lerner, 2020).
Numerous studies have analyzed individual mobility using CDR data, where location data is typically recorded at the antenna level. This means that the captured locations correspond to the cell tower most likely near the individual’s meaningful place. Many researchers infer meaningful places, especially home and work locations, using temporal constraints: assuming that nighttime CDRs represent home locations, while daytime records indicate workplaces (Isaacman et al., 2011; Luo et al., 2020; Vanhoof et al., 2018; Yang et al., 2014). However, this approach may overlook individuals with non-standard routines. To address this limitation, some studies employ data-driven methods that infer individual sleep and work schedules before analyzing CDRs within these time slots (Rodrigues et al., 2022; Tongsinoot and Muangsin, 2017).
Machine learning models, particularly unsupervised clustering algorithms, are often used to analyze CDR data and infer key locations. These methods can explore underlying data structures without prior labels (Raschka, 2015). For instance, Mamei et al. (2016) applied an agglomerative clustering algorithm to CDRs, associating clusters exceeding a weight threshold with significant locations. Other researchers (Andrade et al., 2020; Burkhard et al., 2017) used density-based clustering algorithms to identify important places based on the frequency of visits, focusing on areas where individuals generate a significant number of events. Specifically, Rodrigues et al. (2022) used the varied density-based spatial clustering of applications with noise (VDBSCAN) algorithm, which adjusts its parameters to the density of the dataset, improving the precision of the identification of meaningful places.
Beyond inferring home, workplace, and third places from CDR data, Leng et al. (2021) applied eigen-decomposition and unsupervised machine learning to extract mobility patterns. Their study introduced normalized hourly presence for temporal mobility analysis and used K-Means and fuzzy C-Means clustering to segment locations.
Andrade and Gama (2019) also used a density-based algorithm to identify meaningful places beyond home and work. Similarly, Ferreira et al. (2022) used K-Means clustering to classify locations into three categories based on visit frequency on different days: regularly visited locations, locations of occasional interest, and non-routine locations. Other researchers (Rodrigues et al., 2023) analyzed CDR registers to create trajectories, calculating the time spent at each location to identify meaningful places based on the frequency and duration of visits.
To enhance place identification, many studies integrate semantic enrichment. Since CDR-based locations lack precision compared to global positioning system (GPS) data (Ferreira et al., 2022), a common strategy is to divide urban space into smaller areas and classify them based on POI composition (Phithakkitnukoon et al., 2010; Quadri et al., 2018). Some works, such as those of Ferreira et al. (2022), also incorporate temporal dimensions, linking user activities to antenna coverage areas.
The characterization of meaningful places provides critical insight into individual mobility behaviors and movement flows in urban spaces. In recent years, multiple studies have explored the relationship between socioeconomic factors and mobility patterns to define citizen profiles. For example, Lenormand and Samaniego (2023) examined how SES influences spatial and social interactions in Chilean cities using mobile phone data, showing that individuals tend to visit places aligned with their socioeconomic background, reinforcing urban segregation. Similarly, Barbosa et al. (2021) analyzed global mobility data, revealing that cities with poor public transport accessibility and higher income segregation exhibit a stronger link between SES and mobility behaviors, while more equitable cities demonstrate weaker constraints. Wang et al. (2022) proposed DeepSEI, a deep learning model that infers the SES of users from mobility records, showing that movement diversity and preferred activity locations serve as strong SES predictors.
After defining user profiles, some studies focus on identifying similarities among individuals. Segmentation strategies often rely on clustering algorithms to group users based on demographics, SES, geographic location, and behavioral traits (Manero et al., 2018). Traditionally, paper-based surveys were used to collect this information (Rodríguez et al., 2018), but they are often time-consuming and may not always capture a representative sample. In contrast, smartphone data allows for efficient segmentation based on usage patterns, demographic attributes, and interests (Chen et al., 2019; Sharaf Addin et al., 2022).
Some studies focus on detecting communities in social networks (Takaffoli et al., 2010), while others use unsupervised clustering for segmentation. K-Means (Hung and Tsai, 2008) and K-Modes (Kamthania et al., 2018) are commonly applied, but alternative approaches such as hierarchical clustering have been used in tourism market segmentation (Rodríguez et al., 2018). Martin et al. (2023) proposed a graph-based approach for mobility profiling. The authors used unsupervised learning techniques to extract meaningful user groups. They extracted graph-based mobility features and applied unsupervised clustering to identify user groups that persist in six diverse tracking datasets (including CDR, GPS, and social network check-ins). The study found five stable mobility profiles.
Several works focus on lifestyle-based clustering to segment users based on mobility and behavioral habits. Ben-Gal et al. (2019) proposed a lifestyle clustering approach using Jensen–Shannon distances and agglomerative clustering, focusing on POI semantics while disregarding temporal and spatial dynamics. Jonietz et al. (2018) developed a data mining method to track behavioral changes, clustering individuals based on mobility adaptations over time.
Recent work, such as Bayindir (2017), provides a comprehensive overview of human behavior detection using smartphone data, focusing on activity recognition and pattern extraction using embedded sensors. Although these contributions focus on the groundwork for understanding mobile user behavior, our work builds upon these foundations by incorporating semantic context and socioeconomic factors into a layered clustering framework. In addition, the systematic review by Borges et al. (2024) highlighted the need for computational models capable of analyzing human mobility in urban settings using real-world data. Our approach addresses this gap by proposing a double-layer clustering methodology applied to anonymized mobile phone records.
Overall, many studies have used various types of mobile phone data to recognize activities, addressing the challenge of identifying patterns and consequently infrequent behaviors (Sanabria et al., 2019). Similarly, our work aims to detect less common mobility patterns in urban settings using mobile phone data, highlighting the importance of specific learning strategies for underrepresented behaviors. In general, various methods have been employed to extract human behavior features and profile users based on their habits and mobility. Unlike previous studies, this work introduces a methodology that does not rely on external data sources and infers user habits purely from mobile phone data. Our methodology integrates multiple clustering algorithms based on data type and segmentation objectives. Additionally, while most studies use POIs for location characterization, this work incorporates both semantic and socioeconomic data to enrich user profiles. Finally, location updates are used to address temporal and spatial gaps in CDR data, improving the accuracy of mobility and activity recognition.
Data
Mobile phone data
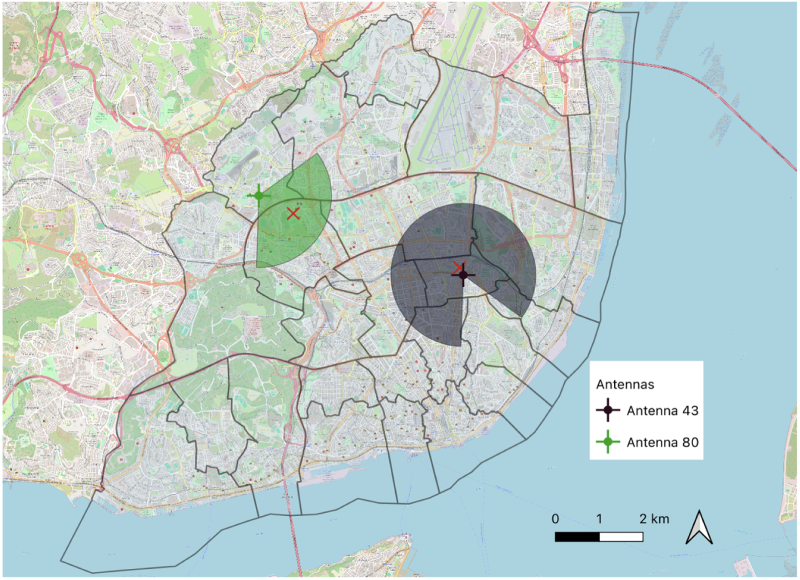
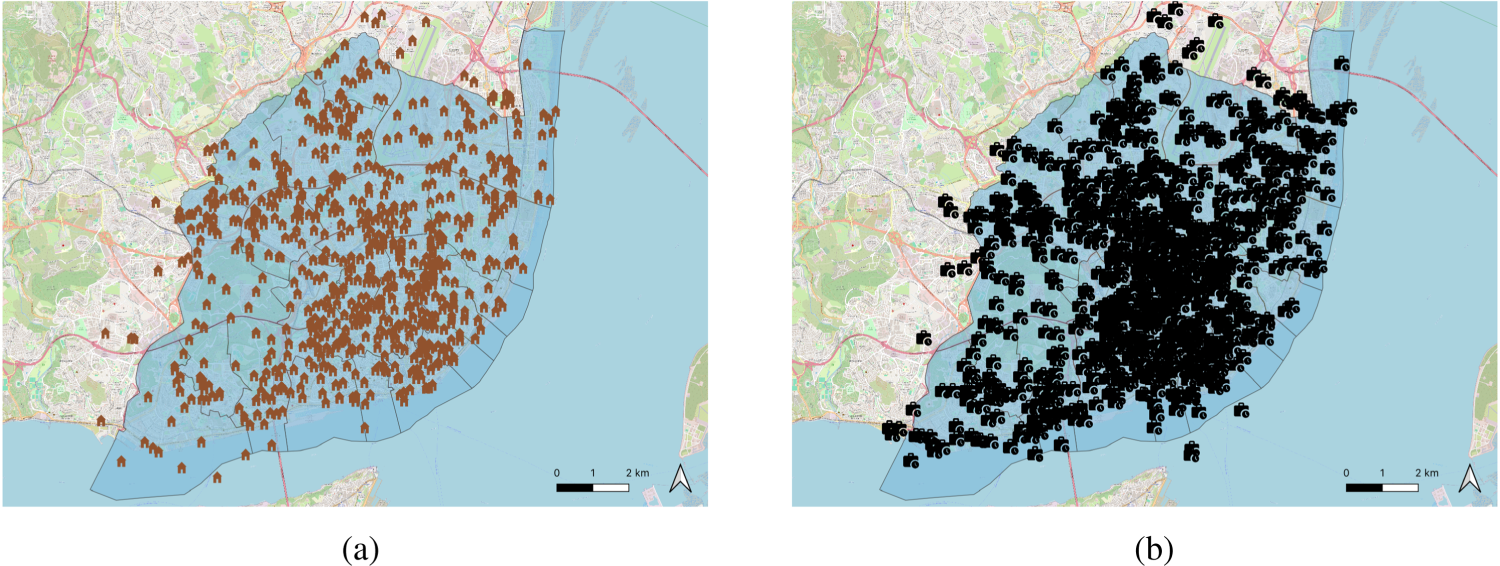
The mobile phone data used in this study comprises anonymized CDRs and location updates gathered from April to June 2024, collected by a Portuguese telecommunication company. These records were generated from 1,226 individuals identified by the mobile phone operator as residents of Lisbon. The operator maintains approximately 8,000 antennas in the city, each with varying coverage areas. Figure 1(a) shows the antenna distribution in Lisbon. Figure 1(b) shows examples of the coverage area of several antennas in the city. As shown, antennas present different coverage shapes that often overlap, resulting in load sharing depending on traffic demand. This means the network may redirect traffic from overloaded antennas to neighboring ones to ensure service continuity for all clients.
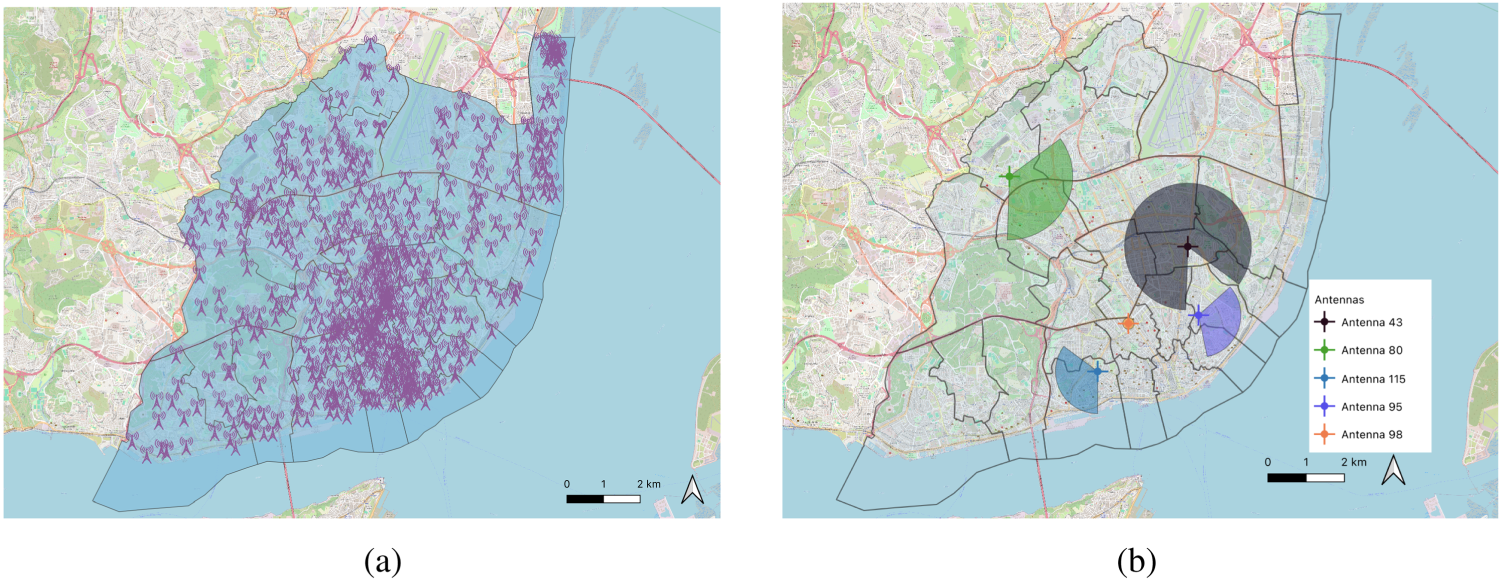
Antennas located in the city of Lisbon. (a) Antennas in the city and (b) example of the coverage area of antennas in Lisbon.
In terms of activity, each individual produced on average 169 CDR events over the three months. As presented in Figure 2, most of the CDRs were registered during the daytime. Regarding the location updates, on average, a mobile phone produced 32,830 records during the three months. Concerning the physical locations captured, CDRs registered an average of 14 different locations visited by each user. On the other hand, with the location updates, the mean number of different locations captured increased to 490 per user.
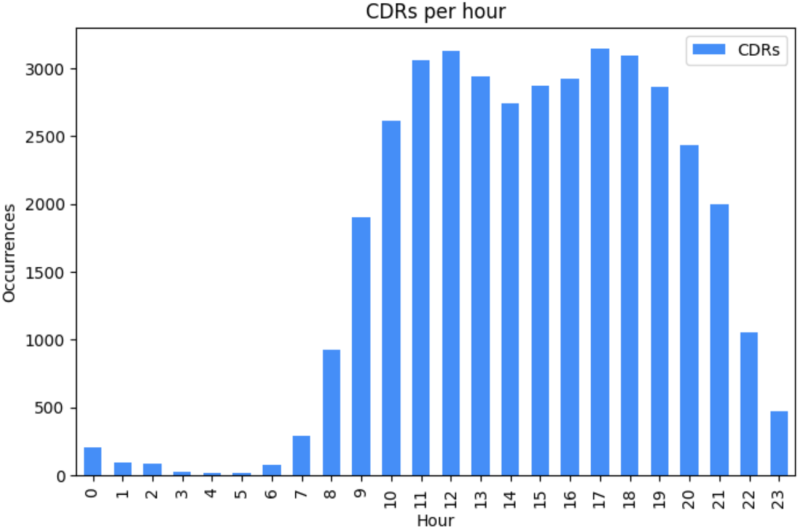
Call detail record (CDR) events registered per hour.
Lisbon is the capital and largest city of Portugal, recognized as a developed urban center divided into 24 parishes, with a population of approximately 548,000 inhabitants. However, due to its significant commuting population, the number of users increases by more than 70% each day (Observatorio de Lisboa, 2020). The city boasts a diverse and robust economy, with multiple main sectors, such as finance, commerce, arts and entertainment, education, and tourism. Lisbon’s population is characterized by its diversity, in terms of residents, immigrant communities, and expatriates (World Population Review, 2024). In recent years, the city has emerged as a hub for young professionals, digital nomads, and affluent expatriates attracted by its growing tech development and favorable living conditions. The demographic and socioeconomic diversity is reflected in its neighborhoods, with some areas undergoing rapid gentrification, while others struggle with challenges related to economic vulnerability, housing affordability, and social issues.
The SES is typically measured through a combination of education, income, and occupation. However, indicators related to household resources can serve as effective proxy measures of income, such as housing tenure, car access, and various household amenities. Common attributes used to determine SES include average home value, percentage of single parents, poverty rate, homeownership rate, health indicators, age, and unemployment rate (Berzofsky et al., 2014).
The socioeconomic indicators used in this study were collected from the Instituto Nacional de Estatística (INE) Census database (INE , 2021) (conducted in 2021) and contain social and economic information at the parish level. The data was extracted in multiple files and encompasses information about the education, age, and work situation of the citizens of Lisbon and also the situation on housing tenure and rent values in the city. In total, around 545,000 participants lived in Lisbon when the census was conducted.
The socioeconomic datasets used in this study contain only numerical variables. To facilitate SES characterization, the original education data for each parish was grouped into three categories: low education (up to the first cycle of studies or lower), medium education (completed between the second cycle of studies and high school), and high education (degree holders).
Similarly, the age distribution dataset was classified into young adults (under 19), adults (ages 20–59), and seniors (ages 60 and older), with values indicating the number of residents in each group. The structure of the work situation dataset was maintained and includes the unemployment rate for each parish, while the housing tenure dataset provides the number of owned and leased properties. Finally, the housing rents dataset contains numerical data on average rent values in parishes.
POIs data
The dataset of POIs used in this study was obtained from the Google Places API at the beginning of 2024. This dataset offers detailed information about various POIs, including restaurants, cafes, museums, parks, shops, and more. It encompasses comprehensive data such as names, categories, addresses, geographical coordinates, user reviews, and photos. Besides its comprehensive coverage and extensive information, the platform does not provide the opening hours of the venues, which, in this case, is essential to analyze mobility behavior and urban dynamics. To address this, we merged this dataset with POIs from Facebook Places collected in 2019, using the name and location of POIs as the basis for integration, and added the opening hours of the venue to the Google Places information. In total, 1,100 POIs were identified in the city. Figure 3 illustrates the geographic distribution of these POIs.
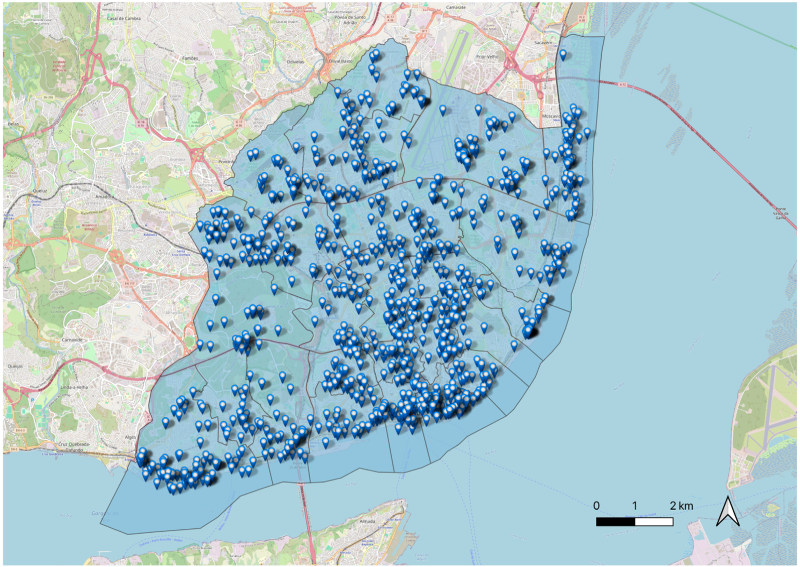
Points of interest (POIs) from Google Places located in the city of Lisbon.
A total of 105 distinct POI categories were identified in the city. However, since some categories are linked to the same sector, several were consolidated into broader macro-categories. These associations were established based on the relationships between the categories and their taxonomy. After this preprocessing step, the initial set of categories was converted into 75 macro-categories. Some examples of the macro-categories are “food_drinks_cafe,” which includes categories such as bars, cafes, food, and restaurants; store, which includes all kinds of stores, from electronic stores to jewelry and clothing stores; and school, which comprises primary and secondary schools.
At the antenna level, data can reveal where people live, work, and frequently visit. By associating these locations with publicly available socioeconomic indicators and the semantics of specific regions, a detailed user profile can be constructed. For instance, the SES of the users’ home location can provide information on their living conditions, while their work location and nearby POIs can offer insights into their professional and social environments. To achieve this, the methodology is divided into several phases. In the initial phases, information about the user’s geo-profile is collected from mobile phone data. Subsequently, the user profile is built, and similar profiles are grouped.
Since the datasets contain several types of attributes, including geographical, numerical, and categorical, we employ multiple clustering techniques suited for different data types. VDBSCAN is used to analyze geographic data and identify meaningful places, as it can handle varying densities and noise in location-based data. For the analysis of numerical attributes, such as socioeconomic variables, K-Means is used, and K-Modes is used for analyzing categorical variables, such as the classification of the work environment. This ensures that each data type is clustered appropriately, enhancing the accuracy of user profiling.
Home and work locations
To identify home and work, we use an approach from Rodrigues et al. (2022) (Figure 4) which determines these locations user-by-user using CDRs and location updates.
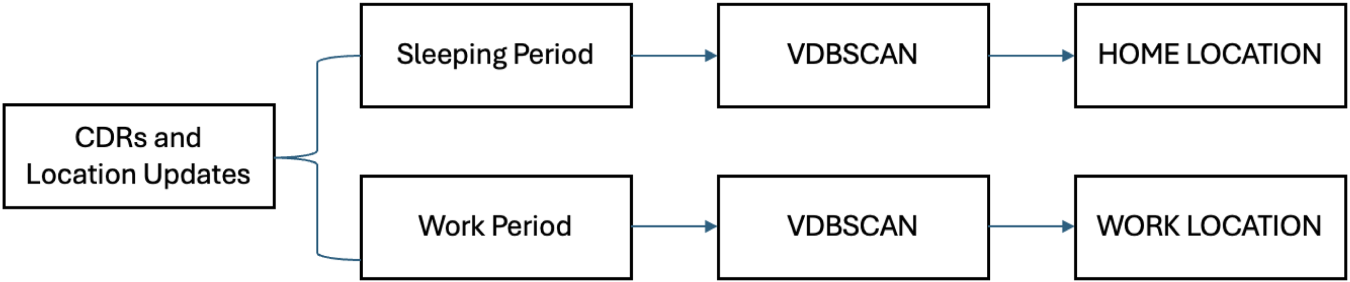
Methodology to detect home and work.
The process starts with the inference of minimum activity periods to infer sleeping and work periods. The sleeping period approach operates on the assumption that individuals are likely to sleep at home and exhibit minimal activity during that period. To identify the sleeping period, the days of the week are divided into 24 sliding slots of 5 hours each (e.g. 12 to 4 AM, 1 to 5 AM, etc.). For each slot, we count the number of CDRs and the number of distinct locations visited. The slot with the lowest activity (in terms of both CDRs and locations visited) is designated as the sleeping period.
Similarly, given the assumption that most citizens work regular hours in fixed locations and are generally not on their phones during work, we identify work hours by finding a period of reduced activity in the afternoon on weekdays. This involves identifying a 4-hour slot from 1 to 8 PM (e.g. 1 to 4 PM, 2 to 5 PM, etc.) that shows minimal activity. The time slots were defined to include complete hourly intervals. For example, the 1 to 4 PM slot covers four full hourly periods: 1 to 2 PM, 2 to 3 PM, 3 to 4 PM, and 4 to 5 PM (until the next slot begins). The period in the afternoon was defined to encounter both day and night workers.
Next, to the events in the identified slots, the VDBSCAN clustering algorithm is applied, and the antenna or the centroid between multiple antennas that most likely represents the required meaningful place is returned. VDBSCAN is effective in identifying places where users have a significant number of events (Ester et al., 1996). It also accommodates outliers and datasets with varying densities by adapting the epsilon parameter based on the distribution of CDRs.
The other meaningful places are identified solely based on location updates, as this data captures all locations visited by the individuals. To accomplish this, we adapted an approach from Ferreira et al. (2022) to pinpoint places that each individual frequently visits. The methodology employed is illustrated in the schema presented in Figure 5.
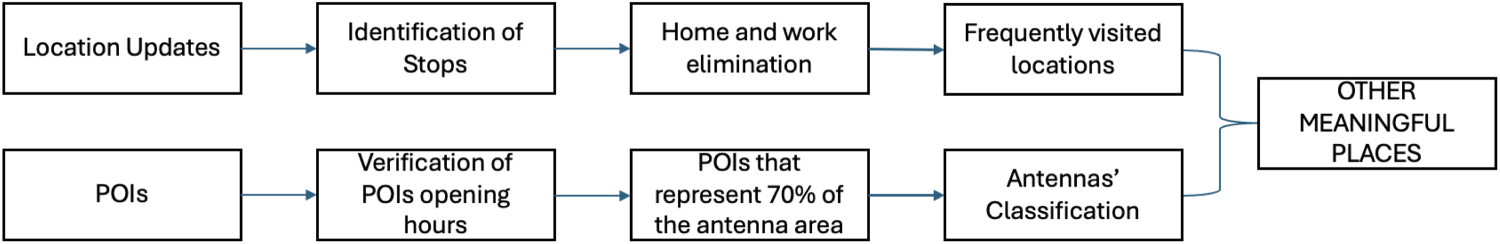
Methodology to detect other meaningful places.
We first identify stop locations to distinguish between places visited in passing and where users spend time. Normally, these stop points are significant in a trajectory and are determined by the time spent in a particular area. For each individual, a stop is defined as a location where more than 20 min are spent (Willberg et al., 2020), within an area of 1,150 m. This distance accounts for the mean coverage radius of the antennas in Lisbon and may represent a single antenna or multiple antennas within the specified radius. Stops also identified as home and work locations are removed from the dataset.
After the remaining stops are categorized based on the number of unique visit days: most visited places for regularly visited locations, occasionally visited places for locations visited sporadically, and exceptionally visited places for non-routine locations. This classification utilizes a relevance metric, calculated based on the number of unique days that users visit each location during specific time intervals on different days, relative to the total number of activity days.
Days are divided into weekdays and weekends, and each day is segmented into eight time slots: 12 to 3 AM, 4 to 6 AM, 7 to 9 AM, 10 AM to 12 PM, 1 to 3 PM, 4 to 6 PM, 7 to 9 PM, and 10 to 11 PM. The K-Means clustering algorithm is then applied with k=3 to identify the three distinct groups. K-Means is a partitioning algorithm that divides the dataset into k predefined, non-overlapping clusters, where each data point belongs to a single group (Hartigan and Wong, 1979).
Simultaneously, the classification of each antenna is determined based on the day of the week and the percentage of open POIs of each category within the region. First, the boundaries of each antenna’s coverage area are calculated based on its radius and coverage angle. Unlike the original approach, which relies on the proportion of open POIs during specific time slots to associate only one macro-category to the antenna based on the number of check-ins in each macro-category, our approach considers multiple macro-categories to represent the antenna and does not take into account the check-ins. Instead, we select the summary of macro-categories of POIs open during the slot that collectively represent the majority of the antenna’s activity. To ensure that the macro-categories representing an antenna capture both dominant and relevant secondary categories, we selected a threshold that covers 70% of the antenna activity. A lower threshold, such as 50%, could risk the under-representation of important categories, while a higher threshold, such as 90%, might overemphasize less significant categories due to the large coverage areas of some antennas and the diverse variety of POIs in Lisbon. This results in a vector of macro-categories ordered by their proportion in the area, which is then associated with the antenna. Given the varying sizes of coverage areas, using a single macro-category for classification could overlook significant functions representative of the area.
After classifying all antennas and identifying all frequently visited places for all users, antennas identified as meaningful places are merged with their classification.
The profile of each user is defined by three primary characteristics: the SES of their residence, the three nearest POIs surrounding the antenna identified as their work location, and their visiting habits regarding specific POIs. The individual analysis of these variables allows us to comprehend not only the behavior and patterns of each individual, but also the different dynamics in the city. To perform the analysis, clustering is initially applied separately to each variable, and users are grouped solely based on their similarities within each variable. After, labels are combined (creating a final numerical dataset), to perform a second layer of clustering. This second layer groups users based on their combined feature-based clusters, allowing the segmentation into higher-level categories that account for multi-dimensional patterns across SES, work environment, and POIs visited.
The methodology for building the profiles starts with the socioeconomic characterization of parishes of Lisbon (Figure 6), allowing users to be assessed based on the socioeconomic characteristics of their living areas.
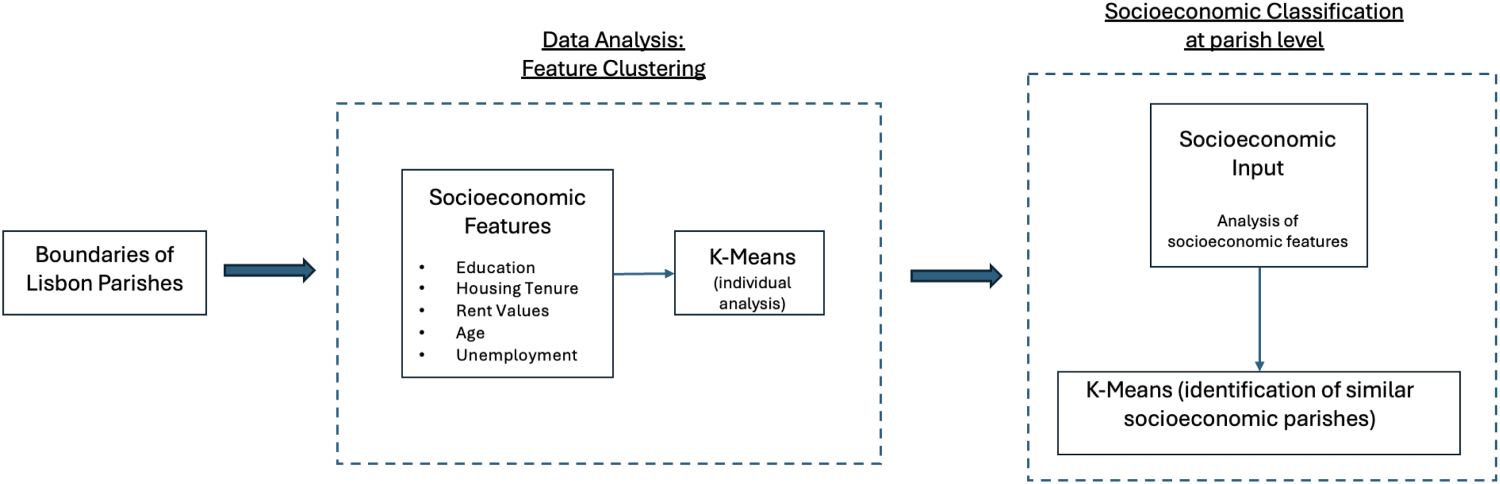
Methodology for socioeconomic characterization.
As mentioned in section 3.2, in this study, five socioeconomic indicators from the census database (INE , 2021) are used to assess SES: education, housing tenure, rent values, age, and unemployment. The approach starts with a data analysis process, where the parishes are clustered within the space of each single variable, using K-Means and treating each variable independently. After the primary analysis, the algorithm is applied once more, combining the previous groups to identify parishes with similar socioeconomic characteristics. This results in clusters of similar parishes in socioeconomic terms, which are then classified according to attributes associated with low, medium, and high SES.
To provide context for the identified work location, the three nearest POIs to the selected antenna are determined. Figure 7 illustrates the methodology used to characterize and segment profiles based on the input variables. As mentioned, users are segmented based on a feature-based clustering approach, where the home location contextualized in socioeconomic terms, the work environments, and frequently visited POIs are analyzed individually without considering interactions or dependencies between features. Thus, K-Modes and K-Means algorithms (depending on the data type) are applied to discover homogeneous groups of individuals.
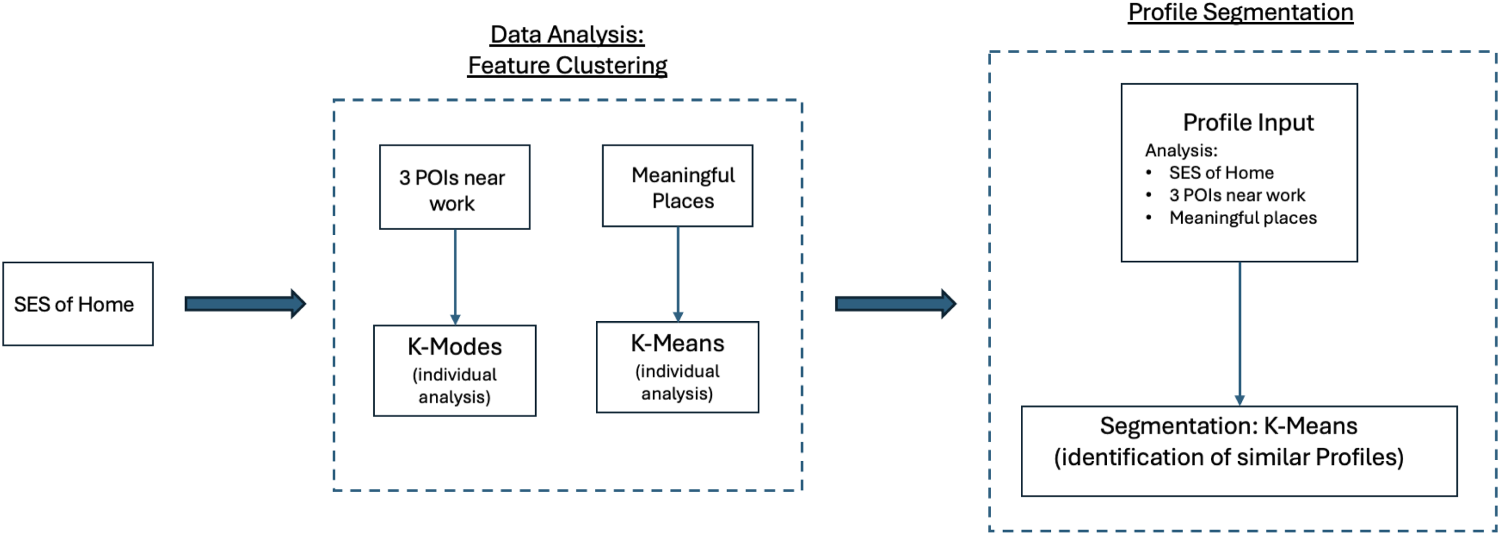
Methodology for the profiles characterization.
From the identification of the POIs closest to the work location, a dataset with categorical attributes is generated. Therefore, K-Modes is used to group individuals based on these attributes. This algorithm is an extension of K-Means, specifically designed for categorical data (Abdul-Rahman et al., 2021). While K-Means minimizes variance within clusters for numerical data, K-Modes applies a different dissimilarity measure, making it more suitable for clustering categorical variables (Huang, 1997). Given the categorical nature of work-related data, K-Modes is applied to classify individuals based on the macro-categories of POIs surrounding their identified work locations and identify clients with similar job titles.
Conversely, K-Means is used to analyze user profiles in terms of meaningful places, as this dataset consists of numerical variables. Specifically, it contains the number of times each POI was visited by the user. Since some antennas are associated with multiple macro-categories, the proportion of macro-categories per antenna is considered. These categories are then ranked according to their significance within the dataset, ensuring that the clustering process captures the most relevant behavioral patterns. This approach allows for a more accurate representation of user tendencies, highlighting which individuals frequent specific types of locations more often.
This process results in the identification of groups within each specific data dimension: SES, work environment, and routine locations. Once completed, the resultant clusters are analyzed and linked to the individuals. Finally, a second level of clustering is applied to cluster the resulting labels using K-Means and identify similar profiles based on the groups to which users belong. The concluding step involves the analysis of different user profiles within the city of Lisbon.
Experimental setup
To analyze different patterns and create user profiles, a structured experimental setup was applied, consisting of data collection, preprocessing, clustering techniques, and validation methods. The preprocessing steps included data cleaning, normalization of numerical variables, and categorical encoding in the second phase to ensure compatibility with clustering algorithms.
For location analysis, VDBSCAN was used to identify meaningful places by detecting clusters with varying densities and filtering out noise. This algorithm automatically adjusts its parameters based on dataset density. In this study, only the minimum samples parameter was defined: for users with more than 1,000 events recorded during the sleeping period, the minimum sample was set to 1,000; otherwise, a minimum sample value of 500 was applied.
For individual profile segmentation, a two-phase clustering approach was implemented. In the first phase, K-Means was applied to numerical socioeconomic attributes, while K-Modes was used for categorical variables, such as work environment classification. The elbow method (Tomar, 2024) was used to determine the optimal number of clusters—evaluating inertia for K-Means and categorical dissimilarity for K-Modes. The resulting numerical cluster labels represent the SES characteristics of a user’s home location, the types of meaningful places they frequent, and the environment of their work, forming three key features: “Cluster SES Home,” “Cluster Meaningful Places,” and “Cluster Work Context,”
In the second clustering phase, K-Means was applied exclusively to group users based on combinations of the inferred cluster labels from the first phase. K-Means++ initialization was consistently used in all applications to enhance convergence stability and ensure robust clustering results.
To validate the clustering quality, intra-cluster results were assessed using quantitative metrics (e.g. silhouette scores) and qualitative analysis, examining the socioeconomic and behavioral characteristics of each cluster.
Home, work, and other meaningful places identification
To enhance the accuracy of the results, the centroid of the polygon formed by the antenna coverage area was used to identify home, work, and other meaningful places, rather than relying on the exact location of the antenna (Figure 8).
Examples of the location that represents the antenna.
Figure 9(a) and (b) illustrates the detected home and work locations, respectively. In total, 1,125 home and 1,344 work locations were identified. As anticipated, most home and work locations are within city limits. However, it is noticeable that more work locations were detected outside of the Lisbon boundaries compared with home locations.
Antennas representing (a) home and (b) work locations.
In the identification of other meaningful places, each antenna was initially classified according to the macro-categories that dominate their coverage area. These macro-categories were ranked based on their prevalence, with the most prominent macro-category listed first. Figure 10 presents a brief analysis of the results and shows the POI macro-categories most frequently recognized as meaningful places and the corresponding number of visits over various time slots. As observed, during the daytime, stores are the most visited places, followed by lodging and POIs related to dining.
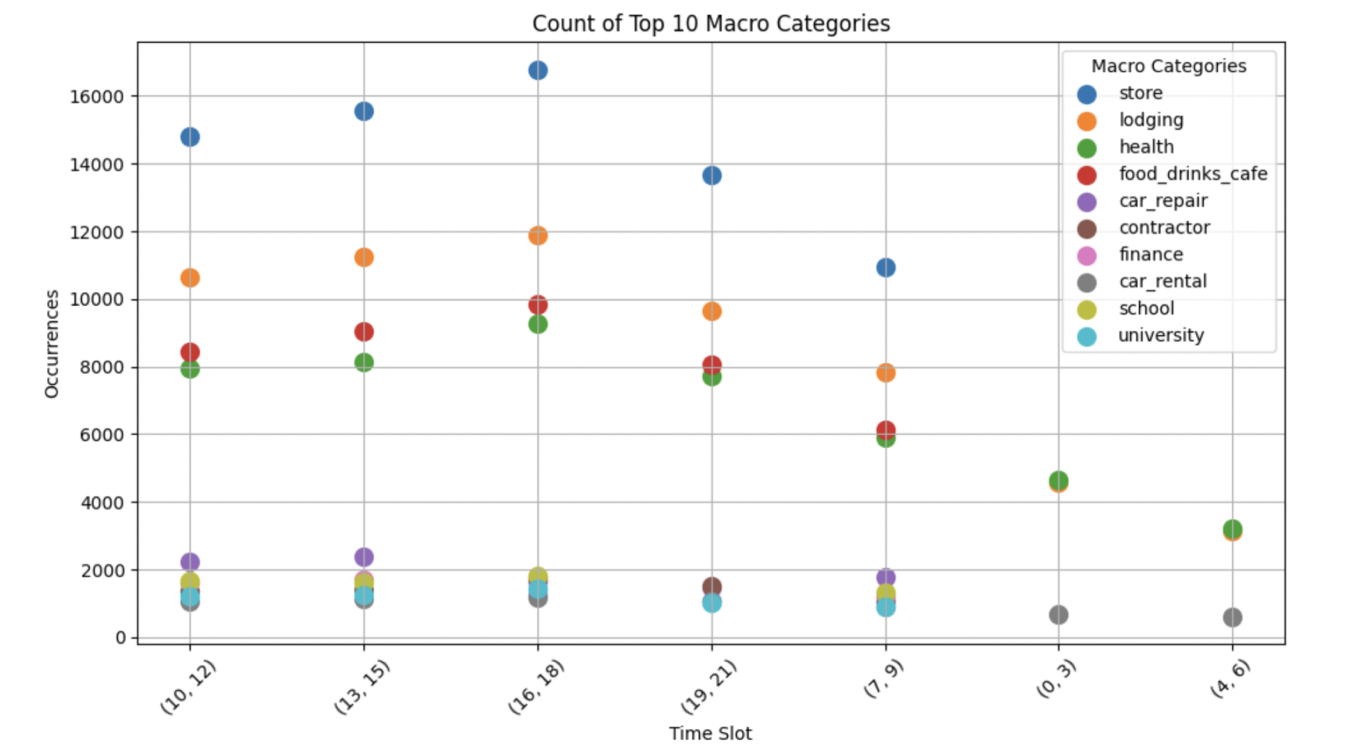
Number of visits in different time slots to top 10 meaningful places frequently identified.
Home: SES
Using K-Means clustering to classify the city of Lisbon based on the socioeconomic indicators (outlined in section 4.3), four distinct groups with varying socioeconomic characteristics were identified. Figure 11 illustrates the distribution of homes identified across parishes with different SESs.
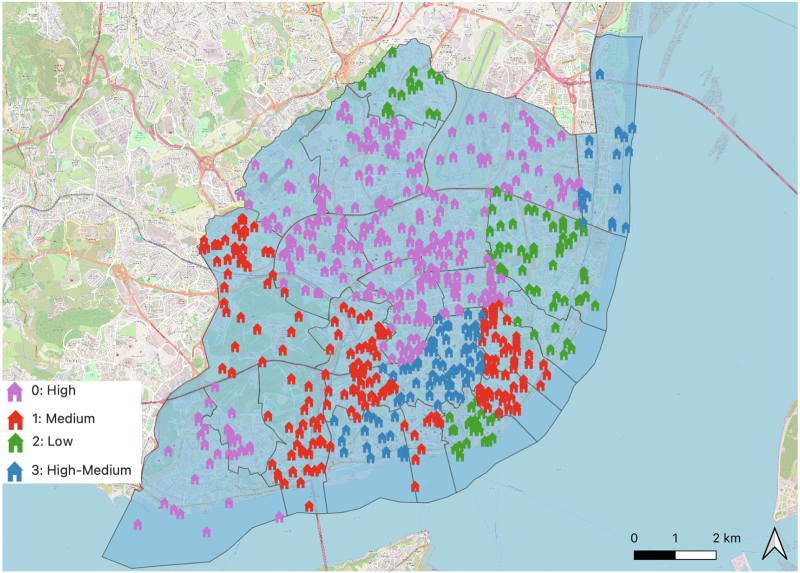
Homes classified in socioeconomic terms.
Individuals residing in areas marked in purple (Cluster 0) are characterized by high-medium education levels, high property ownership, elevated rent values, a significant proportion of seniors, and a low unemployment rate, indicating a relatively high SES.
In contrast, the parishes represented in red (Cluster 1), feature medium–high education levels, with a balanced mix of leased and owned properties, although leasing is more prevalent. These areas also exhibit moderate rent values and a dominant senior population, along with a medium unemployment rate. These characteristics indicate a medium SES.
The individuals living in parishes marked in green (Cluster 2) demonstrate a lower SES compared to the other groups. This is reflected in their medium–low education levels, along with moderate rates of property leasing and ownership, likely associated with lower rent values. These areas also have a significant senior population and a high unemployment rate.
Finally, the individuals indicated in blue (Cluster 3) exhibit a mixed socioeconomic profile, leaning toward a higher status. They present high–medium education levels, predominantly leased properties with some ownership, and high rent values. In summary, Groups 0 (purple) and 3 (blue) represent higher socioeconomic levels; Group 1 (red) occupies a moderate position; and Group 2 (green) reflects lower socioeconomic conditions.
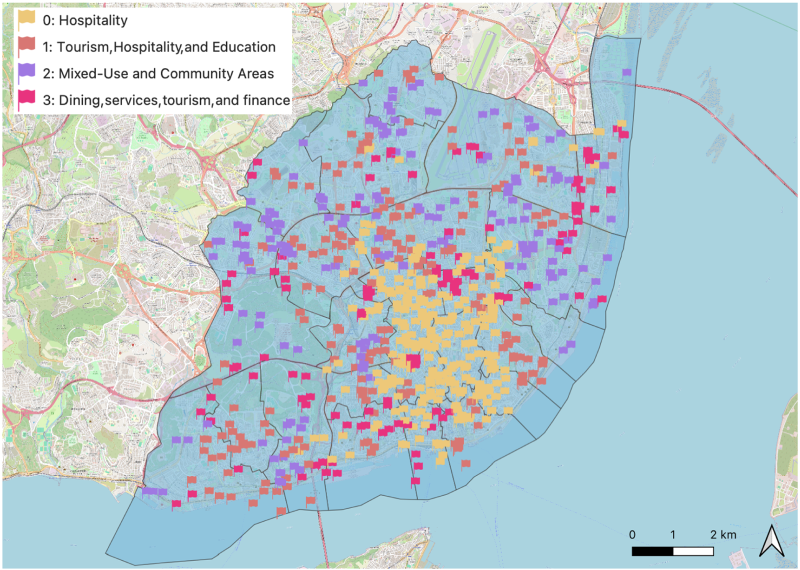
Regarding the classification of work environments based on the macro-categories of the three nearest POIs around the antenna identified as the work location, the K-Modes algorithm identified four distinct groups. Figure 12 illustrates the geographic distribution of these groups, each representing different work profiles.
Different work locations.
The graphs in Figure 13 present the five most prevalent macro-categories in each cluster, highlighting the different profiles of workers identified.
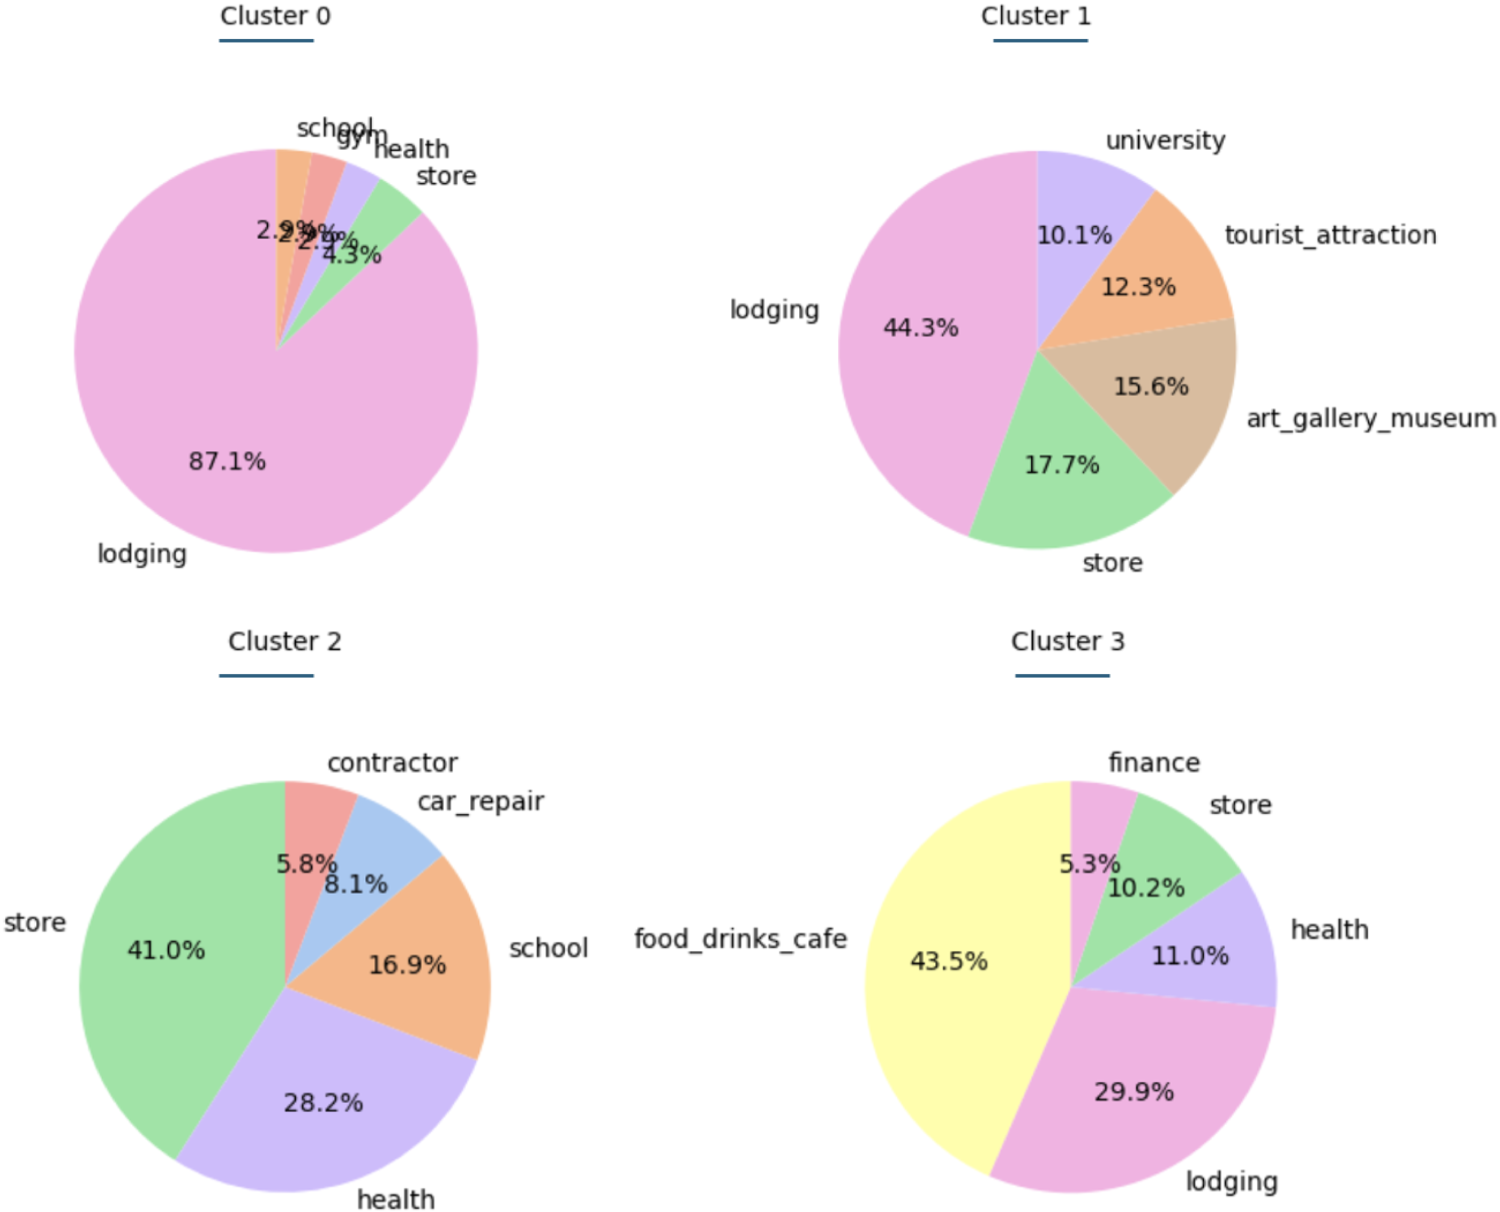
Characterization of the work locations.
Cluster 0 (yellow in Figure 12) is predominantly characterized by lodging establishments, suggesting areas near hotels or accommodations. The low percentages of stores and health facilities indicate that these work locations are primarily located in tourist-heavy or business districts. In addition, the presence of gyms and schools may indicate that this area provides amenities to both tourists and residents.
Cluster 1 (red in Figure 12) also shows a significant presence of lodging, indicating a tourism area, but with a stronger emphasis on culture and education. This is evident from the notable percentages of art galleries, museums, and universities. The inclusion of stores and tourist attractions highlights an environment that can serve both locals and visitors.
Cluster 2 (purple in Figure 12) emphasizes stores and health facilities, suggesting a mixed-use area that may include shopping centers, clinics, and schools. The presence of car repair services and contractors indicates that this cluster can represent regions with light industrial or service-oriented businesses.
Cluster 3 (pink in Figure 12) is marked by a high percentage of food and beverage establishments, indicating a possible lively area centered on dining and social interactions. The notable presence of lodging suggests that these areas might also attract tourists. Additionally, the inclusion of health and finance categories signifies that this cluster offers essential services, making it a well-rounded area for various business activities.
In summary, Clusters 0 and 1 are heavily focused on tourism, characterized by lodging, tourist attractions, and cultural sites. Cluster 2 represents a mixed-use community area that supports retail and essential services, suitable for everyday work environments, including health services and educational institutions. Finally, Cluster 3 highlights areas centered on dining, indicating both tourism and finance-related activities.
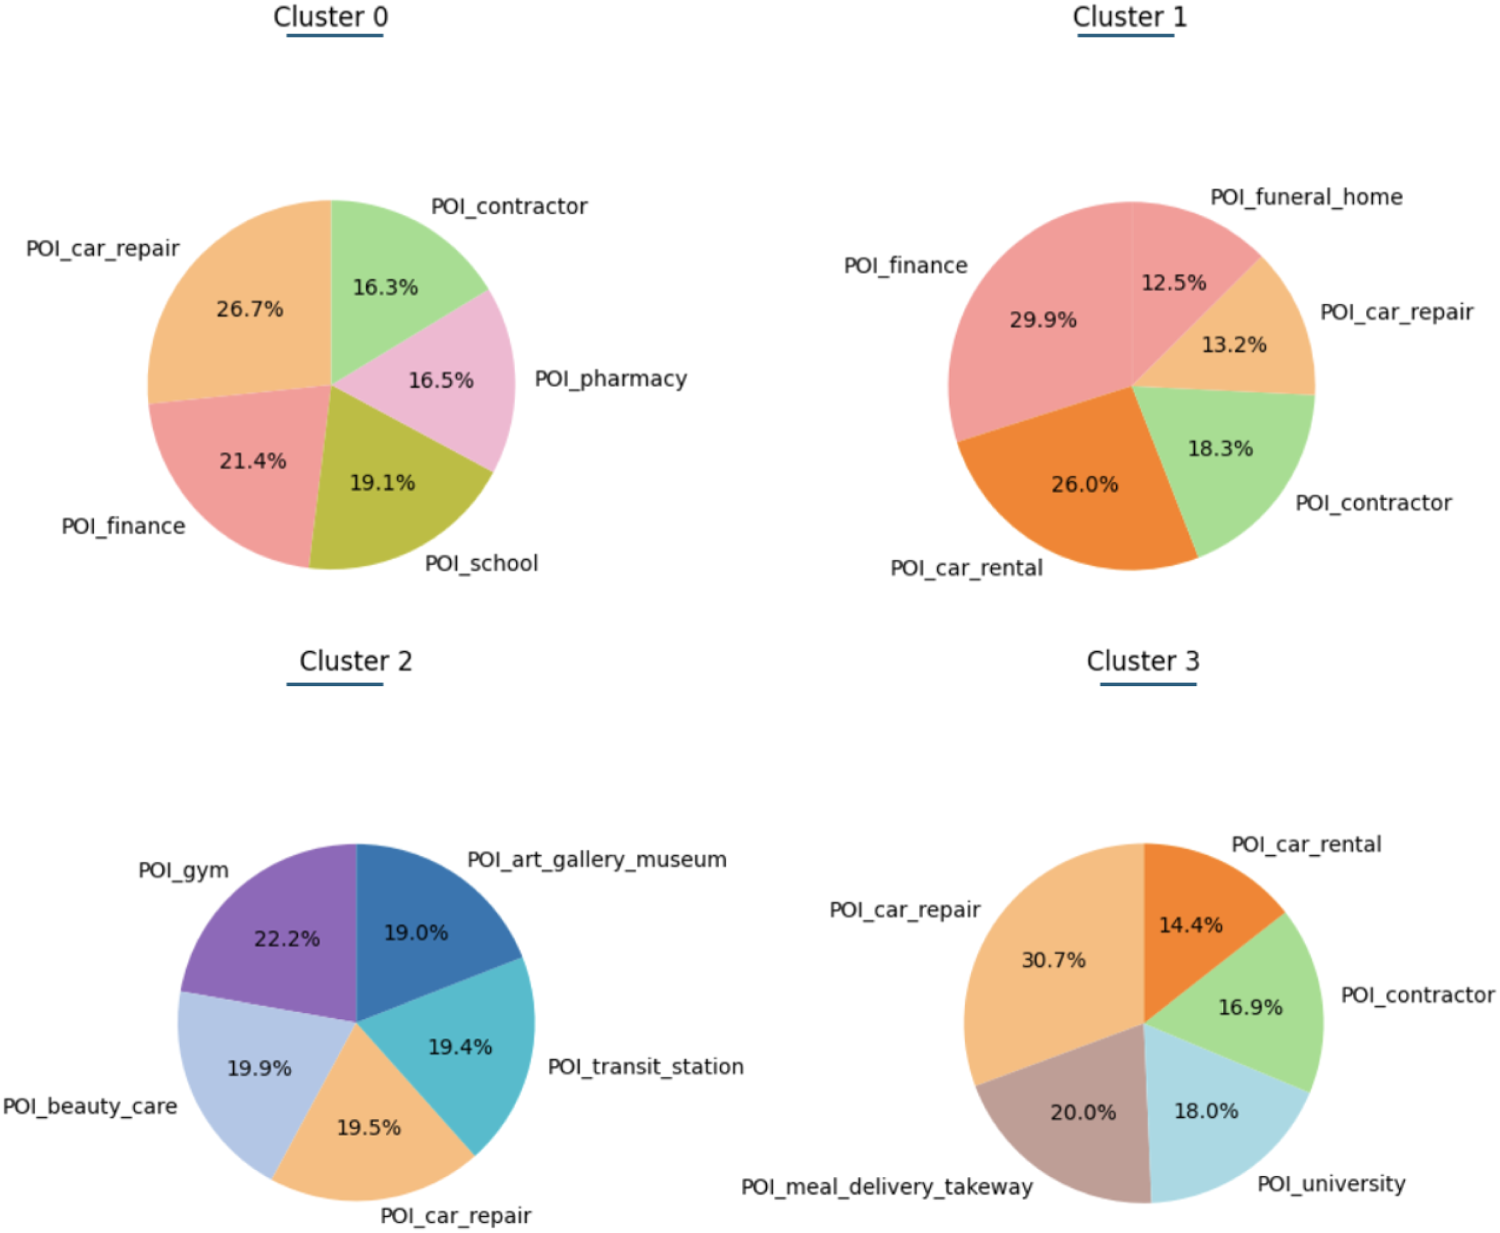
Regarding meaningful places, four distinct user profiles were identified using the K-Means clustering algorithm. Before the clustering process, the number of visits by each individual to each macro-category was determined based on their ranking. To improve the distinction between profiles, dominant macro-categories, common across all users, were excluded from the dataset. The aim was to reduce noise, as these categories overshadow more subtle differences among individuals, making it harder to distinguish meaningful patterns.
Specifically, the macro-categories “store,” “food_and_drinks,” “lodging,” and “health” were removed from the clustering and the characterization process. Previous experimental results indicated that these macro-categories were overly represented in all clusters, which hindered the ability to recognize distinct profiles. By excluding them, the clustering process was able to capture nuanced variations in individual behavior.
Figure 14 illustrates the distribution of the top 5 most visited POIs for each group of individuals, highlighting the distinct patterns that emerged in the analysis.
Characterization of individuals in terms of meaningful places.
The characteristics of Cluster 0 indicate that the associated individuals can be classified as “Practical Maintainers.” These individuals are probably adults or families that focus on daily maintenance and stability, frequently visiting car repair services, contractors, pharmacies, schools, and financial services.
Individuals in Cluster 1 can be described as “Financially Savvy Movers.” These clients show strong engagement with financial services, use car rentals often, and deal with a mix of life events. These characteristics indicate that they value mobility and proactive financial management.
The analysis of Cluster 2 indicates that it likely represents lifestyle-oriented clients and can be described as “Active Urbanites.” These clients are health-conscious and culturally engaged, frequently visiting gyms, museums, transit stations, and beauty services, reflecting an active and well-rounded lifestyle in urban settings.
Cluster 3 can be termed “Busy Convenience-Seekers.” They balance education (university visits), rely on car repair and rentals, and frequently use meal delivery services, indicating a fast-paced lifestyle that values convenience.
Clusters 0 and 1 seem to represent individuals who are more engaged in family-oriented and financially responsible behaviors. Cluster 0 reflects a focus on stability and practicality, often associated with families managing everyday responsibilities and making decisions that support their household needs. Cluster 1 aligns with individuals navigating significant life events, possibly as parents or caregivers, who prioritize financial management and mobility. In contrast, Clusters 2 and 3 appear to represent younger adults or individuals more focused on personal interests and lifestyle choices. Cluster 2 captures the lifestyle-oriented behaviors of younger adults who prioritize health, culture, and social engagement, typically found in urban environments. Meanwhile, Cluster 3 suggests a fast-paced lifestyle characteristic of younger professionals or students who value convenience and efficiency in their daily activities.
The profile segmentation process consists of using the clusters resulting from the socioeconomic, work context, and social habits divisions. Table 1 presents a sample of the input used to segment clients, using K-Means, based on their profile characteristics.
Profile input.
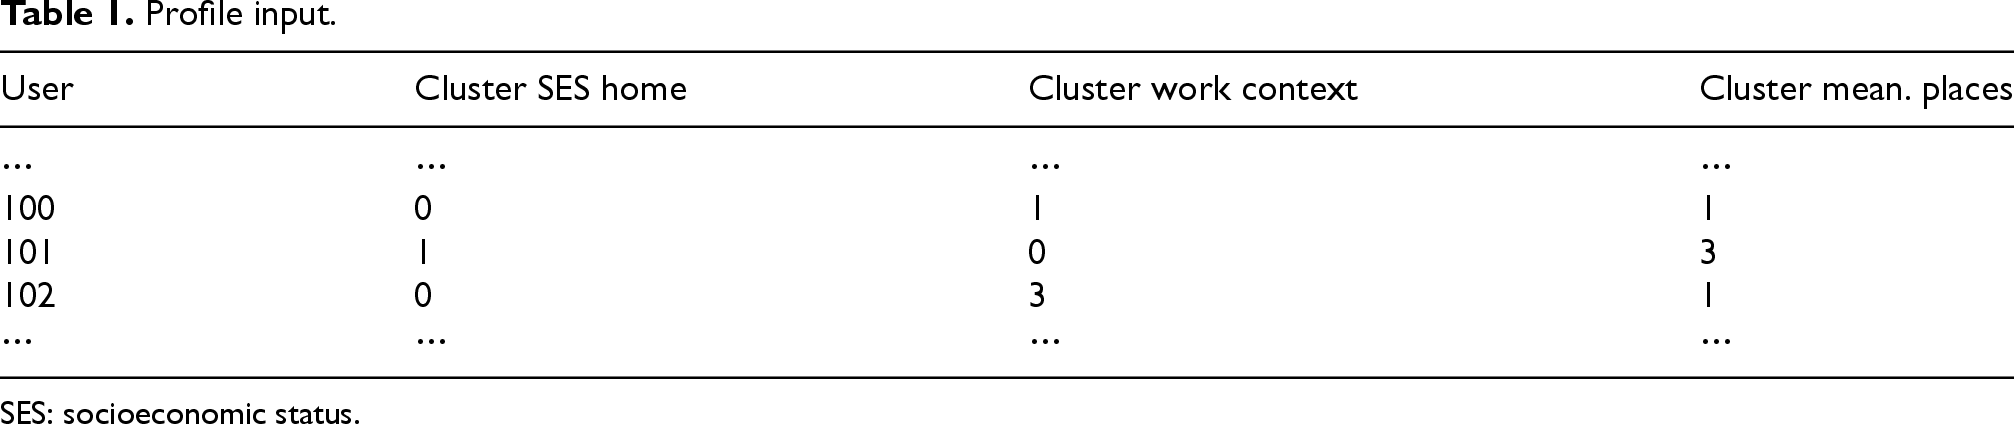
Profile input.
SES: socioeconomic status.
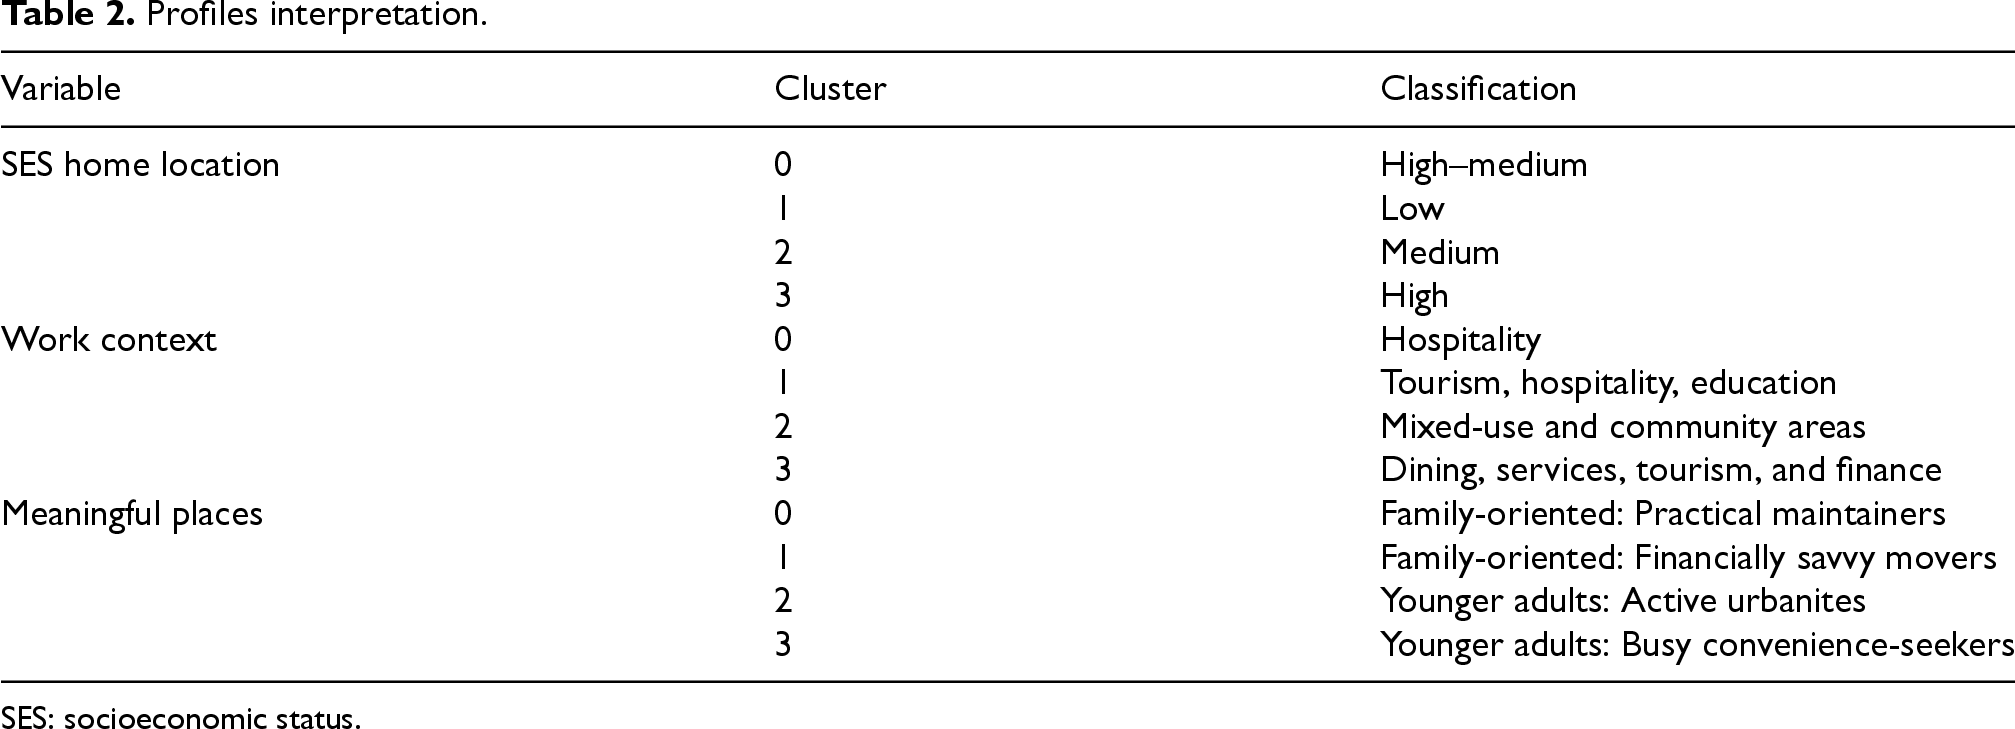
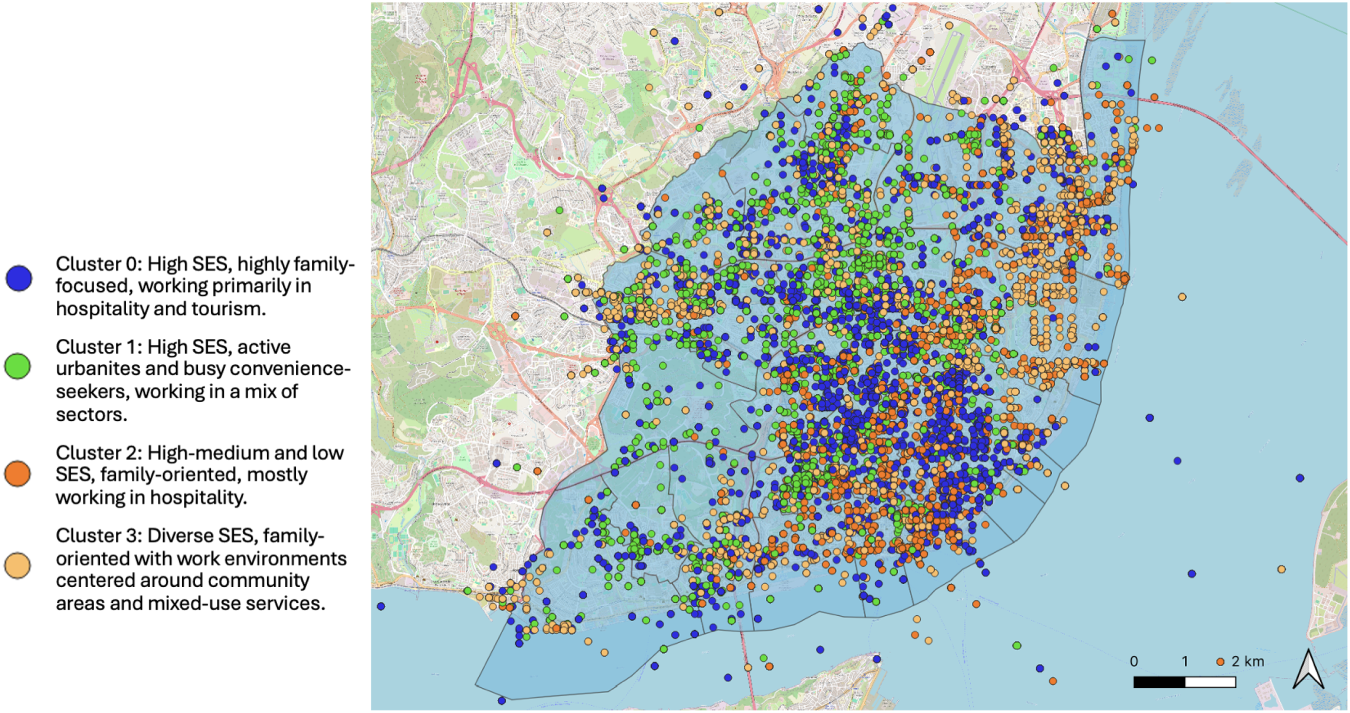
After analyzing the attributes of the profiles of each user, four groups of individuals were identified. Figure 15 presents the different groups identified. Although groups present broader characteristics, clear boundaries separate their attributes. Table 2 helps with the interpretation of the profiles.
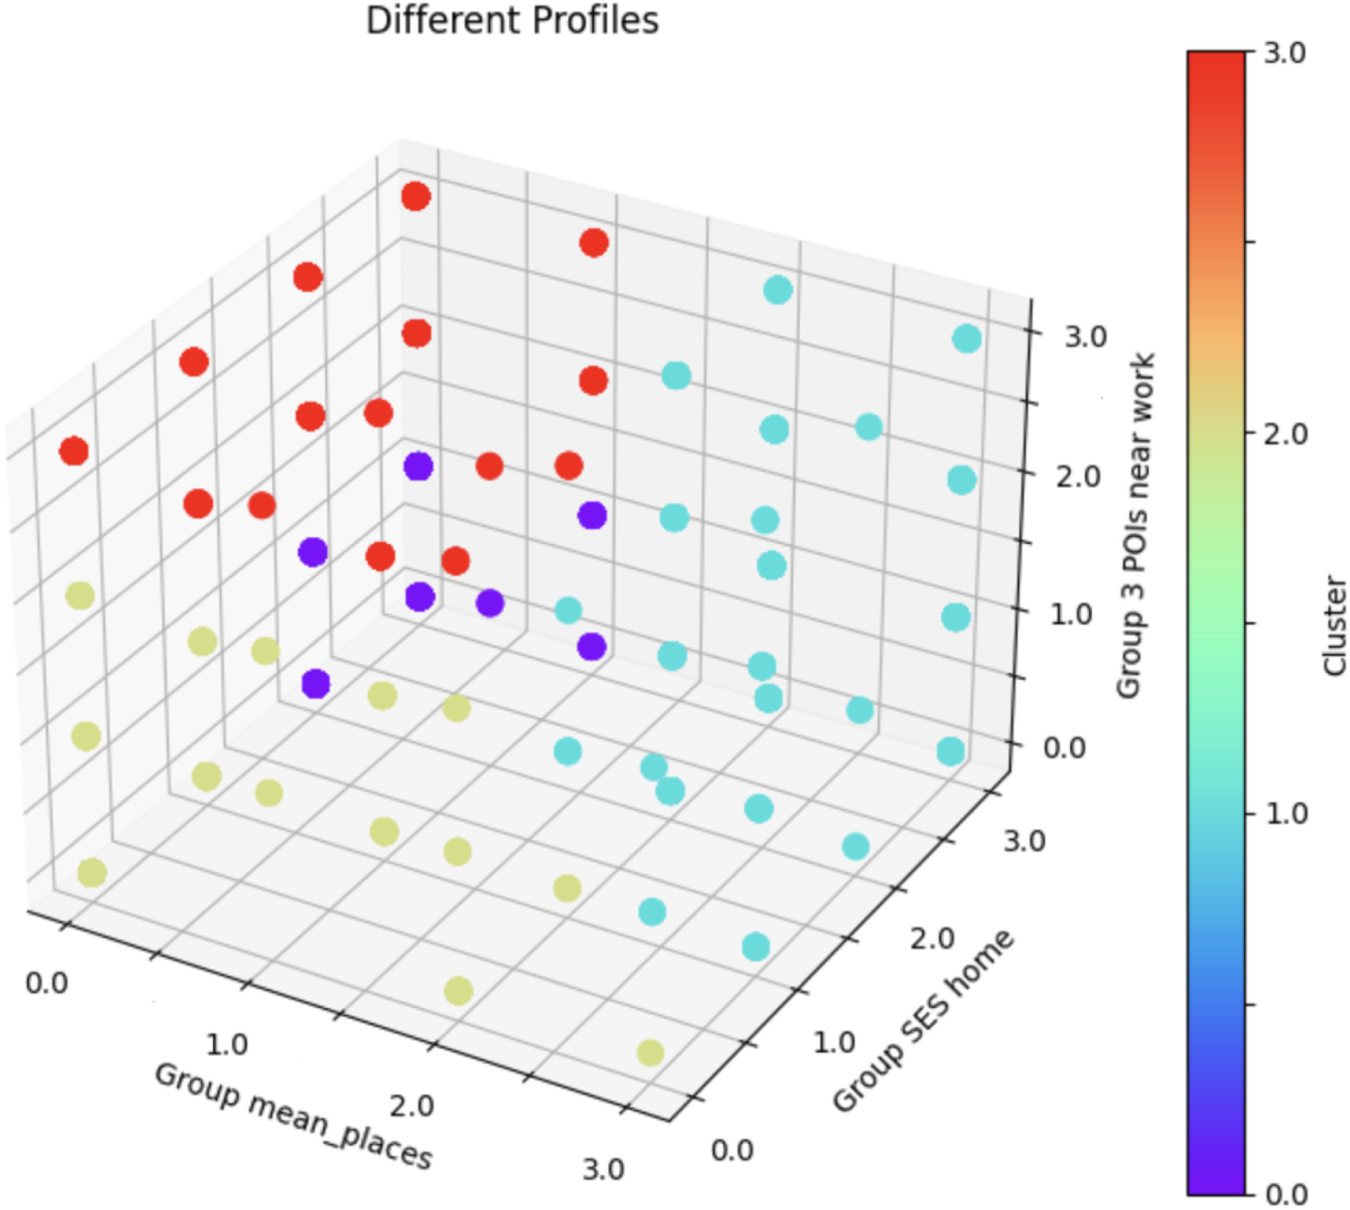
Profile segmentation.
Profiles interpretation.
SES: socioeconomic status.
Cluster 0 consists of individuals from high and medium SES backgrounds, with no representation from low SES. The majority of these individuals seem to exhibit a strong focus on family and practical stability, being almost exclusively classified under the “Family-oriented: Practical maintainers” group. This group likely enjoys a stable and well-off lifestyle, with their work environments primarily centered around hospitality and tourism. Their SES and lifestyle suggest a well-balanced life focused on routine and family security.
Cluster 1 is predominantly composed of individuals from high-SES areas. Many in this group are classified as young adults who lead fast-paced urban lifestyles. Possibly, they could be active urbanites and convenience-seekers, working in diverse environments ranging from tourism to community areas. This dynamic group seems to value urban amenities, efficient living, and maintaining a strong work–life balance.
Cluster 2 includes individuals from high–medium SES backgrounds, with a substantial proportion from low SES. Generally classified as family-oriented, these individuals primarily work in hospitality-related sectors. While this group presents to prioritize stability, they may face economic constraints, given the presence of individuals from lower socioeconomic backgrounds.
Cluster 3 represents a diverse range of SES, with a strong representation from high and medium SES backgrounds. The group is characterized by individuals with family-oriented, practical lifestyles, many of whom work in mixed-use or community-focused environments. This reflects a balance between work, family, and community involvement.
Each group highlights different socioeconomic and lifestyle patterns. Individuals in Cluster 0 live in areas of high SES, are highly family-focused, and work primarily in hospitality and tourism. Cluster 1 also has a high-SES background, with individuals classified as young adults, living active urban lifestyles, and working in a variety of sectors. Cluster 2 represents a mix of high–medium and low SES individuals, who are family-oriented and predominantly work in hospitality. Finally, Cluster 3 features diverse SES backgrounds, with family-oriented individuals working in community-centric and mixed-use environments.
Figures 16 and 17 show the geographic distribution of users across Lisbon at different hours. Figures illustrate the stops of individuals with different profiles from 7 to 8 AM and from 1 to 2 AM. Although there are zones that are highly represented with certain profiles, regardless of the time of the day, in a general context, it is possible to identify zones where the dynamic distribution of profiles varies in the two slots. Such an analysis allows us to interpret how the dynamics of a zone can be influenced by its visitors. For example, individuals from Cluster 2 were associated with working in hospitality (e.g. lodging POIs) and it is verified that at night, this group is a predominant visitor in zones of high concentration of this type of POI (Figure 12). It is also notorious that individuals classified with profile 1, appear geographically more dispersed and at the same time very concentrated in some areas of the city at night.
Distribution of profiles across the city in the morning.
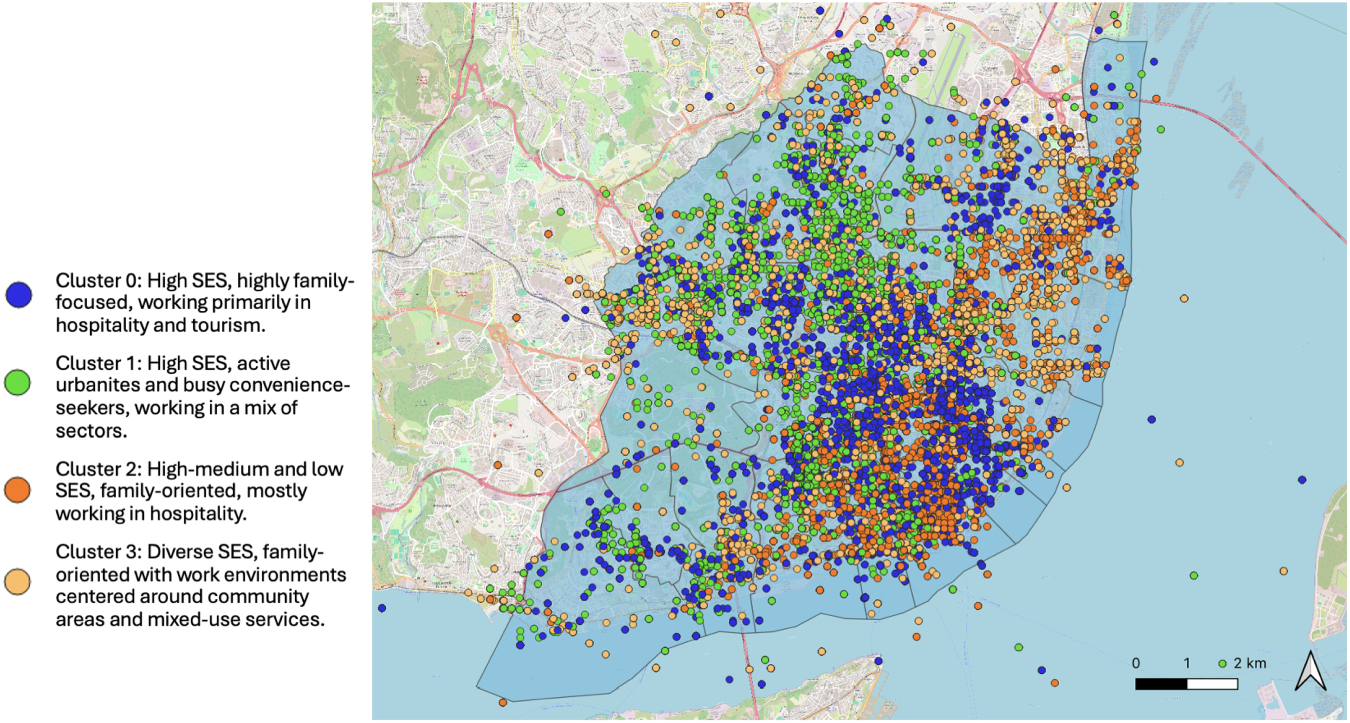
Distribution of profiles across the city at night.
The spatial distribution of individuals with different profiles provides important information about Lisbon’s urban dynamics. Across neighborhoods with varying SES, there is a clear distinction in the types of jobs, services, and visitors that dominate each area. For future reference, the geographic distribution of the parishes of the city can be observed in Figure 18.
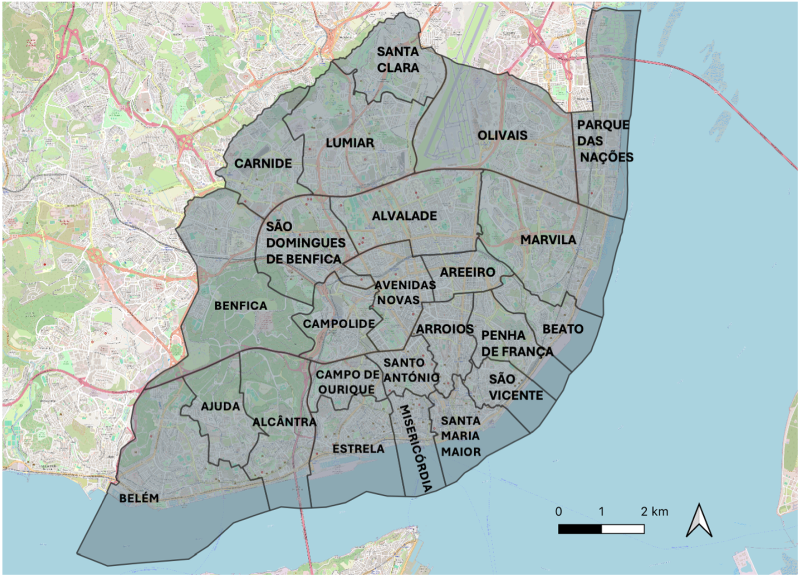
Parishes of Lisbon.
Our results show that high-SES areas, such as Parque das Nações, Avenidas Novas, Estrela, and Belém (Figure 18), are strongly associated with workers in tourism, hospitality, education, and community services. In contrast, lower-SES groups tend to reside in peripheral areas, particularly along the riverfront, aligning with previous research on suburbanization in Lisbon. While central and historic districts continue to be renovated, attracting affluent visitors and residents, the eastern riverfront (e.g. Marvila and Beato) appears more disconnected from the overall economic dynamics of the city (FCSH+LISBOA, 2017). Rising housing costs and gentrification further push lower-income residents away from the city center, a trend reflected in our results, highlighting SES-based disparities in work and mobility patterns.
Furthermore, our analysis reveals that central parishes such as Santo António, Arroios, Avenidas Novas, and Santa Maria Maior (Figure 18) show a high concentration of lodging services and are frequently visited by individuals in profiles 0 and 2, which are typically associated with employment in hospitality and tourism. Interestingly, individuals classified as profile 0 (high SES) are highly concentrated in these areas at night, suggesting a connection between these areas and their residential locations. This pattern mirrors broader gentrification trends in Lisbon, aligned with recent reports on housing pressures. According to Cunha and Raposo (2024), the expansion of short-term rentals has resulted in the loss of permanent residents in historic neighborhoods due to rising housing costs, leading to a depopulation of central parishes and a transformation of local commerce toward tourism-focused businesses.
Furthermore, our findings indicate that high-SES individuals tend to live and frequent urban centers more often, reflecting a preference for central living despite rising housing costs. This is consistent with the concept of post-suburbanization, where certain groups return to the city center not out of economic necessity but due to lifestyle preferences (Xerez, 2008).
The results of this study align with previous findings on socioeconomic influences on mobility. The observed tendency of lower-SES individuals to reside in peripheral areas and to face mobility restrictions supports the conclusions of Barbosa et al. (2021), who highlighted the role of urban infrastructure in shaping mobility inequalities. Furthermore, the clustering of individuals with similar SES in specific urban zones, as shown in our study, mirrors Lenormand and Samaniego’s (2023) findings on spatial segregation patterns in Chile. The strong correlation between work environments and SES in our study is also supported by Wang et al. (2022), who demonstrated that job titles can be significant indicators of socioeconomic conditions.
Understanding where, when, and why people move is crucial for urban design and planning. Grouping individuals based on the locations they visit has applications in environmental monitoring, urban development, and community engagement. This study presents a comprehensive analysis of urban mobility patterns in Lisbon by integrating mobile phone data, POI information, and socioeconomic indicators.
While CDR-based location tracking offers a large user base and ubiquitous coverage, alternative location-tracking methods, such as GPS-based systems, provide higher precision, but face limitations in power consumption and data collection complexity. However, combining CDR data with passively generated location updates enriches mobility analysis, allowing for a more detailed understanding of urban dynamics. This study highlights that the integration of mobile phone data with socioeconomic and semantic data can serve as a key resource for understanding urban mobility and inclusion.
By applying VDBSCAN, K-Means, and K-Modes clustering techniques on the varied datasets, we successfully identified four distinct population clusters, each reflecting unique socioeconomic, work, and lifestyle preferences. The results indicate that higher SES individuals tend to exhibit stability and family-oriented behaviors, while lower-SES individuals face economic constraints, but maintain strong practical family-focused routines. Additionally, younger and more dynamic individuals are concentrated in urban areas, exhibiting a focus on personal interests and lifestyle choices, where convenience and accessibility shape their mobility patterns. The analysis of meaningful places further highlights differences in social behaviors and lifestyle choices, demonstrating the strong link between socioeconomic background and urban mobility.
The application of socioeconomic indicators, such as education, housing tenure, rent values, age, and unemployment rates, has been essential in characterizing the SES of the city’s parishes. This approach not only offers valuable information on the living and working conditions of individuals but also provides a deeper understanding of the socioeconomic landscape of Lisbon. Additionally, the analysis of meaningful places highlights the diversity in social behaviors, with individuals frequenting specific types of POIs that align with their lifestyles and SES profiles.
Notably, clusters representing individuals with higher SES tend to be associated with stability and family-oriented behaviors, while lower-SES individuals seem to face economic challenges but also exhibit practical, family-focused lives. In contrast, younger and more dynamic individuals are concentrated in urban areas, where convenience and efficiency are crucial in shaping their routines.
Although this study demonstrates the potential of integrating multiple data sources to derive clear user profiles and urban lifestyle patterns, certain limitations must be acknowledged. K-Means assumes convex clusters and is sensitive to outliers, which could affect clustering results. To mitigate this, K-Modes was applied for categorical attributes, and K-Means++ initialization was used to reduce centroid sensitivity. Additionally, CDR data, while valuable for mobility analysis, does not provide fine-grained movement trajectories, as it captures mobile network events rather than continuous tracking. Even though location updates were incorporated to address spatial and temporal sparseness, both methods rely on antenna-level positioning, which introduces challenges in precisely identifying visit purposes. Future work could explore alternative data sources, such as GPS traces or survey-based validation, to improve clustering accuracy and spatial resolution.
Beyond providing information on urban mobility, this methodology has potential applications in multiple sectors, including crime prevention, transportation planning, housing policy, retail strategy, and emergency response. By understanding how different socioeconomic groups interact with urban spaces at different times, city planners can design safer and more inclusive environments. For instance, overlaying these patterns with crime data can help identify areas where safety limits inclusion, promoting targeted interventions such as improved lighting or surveillance. Similarly, this approach can support affordable housing policies, optimize commercial services, and improve disaster response planning, making cities more adaptive and equitable, and minimizing the impact of gentrification.
This work also responds directly to the challenges and research opportunities previously identified in the literature. In particular, it complements previous studies, such as Bayindir (2017), which focused on the recognition of activities using smartphone sensors, and Borges et al. (2024), which highlighted the need for real-world, data-driven mobility behavior models. By combining behavioral clustering with socioeconomic and semantic contextualization, this work provides a practical and scalable framework to understand human mobility patterns in smart urban environments.
Moving forward, this methodology can be extended in several ways. For instance, future research could integrate temporal dynamics, analyzing how user behaviors evolve over time and how they respond to external factors. The results can be used to improve policy applications, collaborating with urban planners to optimize infrastructure and improve accessibility. Regarding the real-world application, some additional datasets could be incorporated, including public transportation usage, real estate data, or consumer spending patterns, to provide a more comprehensive view of urban behavior. Moreover, results from this analysis could be used to examine how the density of local amenities influences transportation choices, indicating if a higher density of amenities correlates with increased walking and reduced driving among wealthier or poorer residents, highlighting disparities in urban mobility behaviors.
Overall, this study demonstrates the potential of combining different types of data to understand daily dynamics and create detailed user profiles that reflect both economic and behavioral patterns. The proposed methodology can be adapted to other urban contexts, offering a valuable tool for urban planners, policymakers, and researchers to understand the interaction between SES, urban mobility, and individual behaviors. The results provide insights into urban inclusiveness, helping policymakers design cities that are more accessible, livable, and equitable for all citizens.
Footnotes
Funding
The authors disclosed receipt of the following financial support for the research, authorship, and/or publication of this article: This work was financed through national funds by FCT—Fundação para a Ciência e a Tecnologia, I.P., in the framework of the Project UIDB/00326/2025 and UIDP/00326/2025. This research was supported by the doctoral grant PRT/BD/154266/2022 financed by the Portuguese Foundation for Science and Technology (FCT), and with funds from the State Budget, European Social Fund (ESF), through the Regional Operational Program of the Center (Centro 2020), and under the MIT Portugal Program.
Declaration of conflicting interests
The authors declared no potential conflicts of interest with respect to the research, authorship, and/or publication of this article.