
Abstract
The construction industry faces persistent safety challenges despite technological advancements. While previous research has examined Building Information Modelling (BIM) and Internet of Things (IoT) applications in safety management separately, the systemic influence of their integrated implementation on construction safety culture remains insufficiently investigated. This study introduces the first application of dynamic Fuzzy Cognitive Mapping (FCM) to model complex interrelationships between fourteen key BIM-IoT integration advantages and sixteen construction safety culture components across psychological, organizational, and behavioral dimensions. Unlike previous FCM applications focusing on static relationships, this research captures both direct causal relationships and indirect reinforcing feedback loops through a novel six-scenario simulation framework. The methodology uniquely quantifies amplification effects through FCM augmentation analysis, revealing how indirect causal pathways significantly enhance the overall influence of specific advantages beyond direct impacts static and dynamic FCM analyses comprehensively quantify both direct and indirect impacts across implementation scenarios. Findings reveal that advantages such as regulatory compliance support, real-time decision-making, and improved safety inspections exert strong direct influence, while hazard visualization, safety training, and near-miss reporting have significant indirect effects through reinforcing feedback loops. Novel clustering-based scenario simulations reveal that proactive safety management and safety communication clusters have highest impact on strengthening safety culture, while intrinsic psychological factors like personality traits remain less influenced by technological interventions. This research offers the first system-oriented dynamic perspective on how BIM-IoT integration systematically transforms construction safety culture, providing strategic tools for decision-makers to forecast outcomes and prioritize interventions. The developed framework advances FCM methodology by combining multi-scenario dynamic analysis with augmentation quantification, enabling comprehensive technology-culture interaction assessment. Future research should explore field validation and cultural adaptability of the model in large-scale and multicultural construction environments.
Keywords
Introduction
The construction industry is widely recognized as one of the most hazardous sectors (Lingard & Rowlinson, 2005), due to its complex, dynamic, and often confined work environments, the use of heavy equipment and diverse materials, and the inherently high-risk nature of its operations (Forteza et al., 2020). Despite decades of regulatory, governmental, and professional interventions, the industry continues to report alarming rates of injuries, fatalities, and work-related illnesses (Azhar, 2017). For instance, according to the available data, there are more than 60,000 fatalities yearly in construction projects around the globe (Mohandes et al., 2020). These persistent issues have motivated both scholars and practitioners to explore more innovative and effective strategies for improving Occupational Safety and Health (OSH) performance on construction projects (Adaku et al., 2021).
In recent years, the concept of safety culture has gained prominence as a critical factor in enhancing safety performance and preventing incidents (Fang & Wu, 2013). Evidence suggests that a well-established safety culture in the construction industry significantly contributes to better safety performance, whereas the presence of various organizational and human factors may result in substandard safety performance and increased site accidents (Khalid et al., 2021). However, the construction sector continues to suffer from a poor safety culture, necessitating the development of more proactive and adaptive approaches to transform safety practices and outcomes (Blockley, 1996).
To address these challenges, researchers have increasingly turned to digital technologies such as Building Information Modelling (BIM), the Internet of Things (IoT), wearable sensors, LiDAR, and immersive technologies (Zhang et al., 2017). Although several of these emerging technologies are currently being applied to improve safety performance and reduce accident rates on construction sites, relying on a single technology often falls short of achieving the stringent safety standards required in complex project environments (Wang et al., 2021). Among these innovations, the integration of BIM and IoT has shown significant promise in improving safety outcomes by enabling real-time hazard detection, dynamic visualization of risks, and data-driven decision-making (Tang et al., 2019). Nevertheless, most existing BIM-IoT research has prioritized technical implementation and quantifiable outcomes (e.g., hazard detection accuracy, compliance rates), while systematically overlooking how these technologies interact with cultural and behavioral aspects of safety (Hong & Guo, 2025). This neglect stems partly from the difficulty of measuring cultural change with conventional engineering metrics and from an implicit assumption that technological improvements will automatically translate into cultural transformation (Manzoor et al., 2025).
To effectively advance construction safety culture, leveraging the integration of BIM and IoT offers substantial opportunities. While previous studies have examined the advantages of BIM and IoT separately and primarily focused on the technical implementation and early-stage adoption of BIM-IoT systems, limited research has explored how their combined integration can specifically foster a proactive and sustainable safety culture (Amiri et al., 2024). Addressing this overlooked dimension is essential, since empirical evidence shows that safety culture strongly mediates the effectiveness of safety technologies and acts as a leading indicator of long-term safety performance (Olugboyega & Windapo, 2019). This study addresses this critical research gap by exploring the following key question: What are the main advantages of BIM-IoT integration, and how do these benefits contribute to the development and long-term sustainability of a positive safety culture in the construction industry?
By focusing on cultural aspects, this research provides a deeper understanding of the impacts of BIM-IoT integration and highlights how these technologies can both improve safety performance and reinforce safety values and practices across construction environments. The study aims to capture the causal linkages between technological benefits and cultural dimensions, enabling a systematic exploration of how BIM-IoT integration reinforces safety values, promotes safe behaviors, and fosters a safety culture within construction environments. The resulting dynamic model provides nuanced insights into the collective pathways through which digital innovations can sustainably strengthen safety culture outcomes.
By identifying the most influential advantages of BIM-IoT integration, this study seeks to offer both theoretical insights and practical guidance for enhancing safety performance, minimizing rework, promoting stakeholder collaboration, and strengthening overall safety culture. The next section presents a review of the literature on construction safety culture and the emerging role of BIM-IoT integration in improving safety outcomes. This is followed by a detailed explanation of the research methodology, the results of the FCM modeling, and a discussion on the implications for industry and future research.
Literature Review
Recent technological advancements have significantly reshaped safety management practices within the construction sector. In particular, the integration of BIM and IoT offers transformative opportunities to strengthen construction safety culture. To fully leverage these benefits, it is critical to first understand the underlying dimensions of construction safety culture. Accordingly, this section initially discusses the core concepts and dimensions of construction safety culture, followed by an exploration of the advantages brought by BIM-IoT integration in enhancing safety management.
Construction Safety Culture
Safety culture refers to the collective attitudes, beliefs, values, perceptions, and behaviors toward OHS shared by individuals and groups within an organization, including employees and stakeholders (Fang et al., 2006; Hale, 2000). Due to the unique characteristics of the construction industry—such as the construction process, management practices, organizational structure, transient workforce, and temporary multi-organizational project teams- a distinct safety culture is required, differing from general organizational safety cultures in both scope and key components (Andi, 2008).
Construction safety culture, a vital element of organizational culture within the construction sector, embodies the collective attitudes, values, and beliefs of employees regarding the organization's safety approach (Choudhry & Masood, 2011). It encompasses individual and group-level beliefs, norms, attitudes, and technical practices designed to reduce risks and mitigate unsafe acts and conditions affecting both workers and the public in the construction environment (Zou et al., 2007). Construction safety culture is a dynamic and evolving phenomenon, continuously influenced by various factors within the construction safety management landscape, including the safety attitudes and behaviors of all involved parties (Bansal, 2011).
Key Dimensions of Construction Safety Culture
Understanding safety culture in construction has been the focus of extensive academic inquiry, resulting in the development of various conceptual models. Among the most prominent frameworks are the “layer models” and “triad models.” While layer models (e.g., Guldenmund, 2000; Reason, 1997) initially shaped early discourse on safety culture, their utility has been called into question. These models are often criticized for offering limited objectivity in measuring safety-related cultural attributes and failing to account for the dynamic and evolving nature of organizational culture (Choudhry et al., 2007; Cooper, 2000). As a result, their influence on current safety culture research has diminished.
In contrast, triad models provide a more robust and multidimensional perspective by emphasizing the interdependence of psychological, behavioral, and contextual factors. Geller (1994) introduced the “Total Safety Culture” model, which highlights the interaction between the person, environment, and behavior. Building on this foundation, Cooper (2000) developed a reciprocal model that links employees’ internal perceptions and attitudes, their actual behaviors, and the organizational or situational factors shaping those behaviors. Extending these theoretical advancements, Choudhry et al. (2007) proposed a safety culture model specifically tailored to the construction industry, unifying Geller's “environment” and Cooper's “situation” constructs into a single dimension—“situation/environment”—to better reflect both project-specific and organizational realities in construction settings.
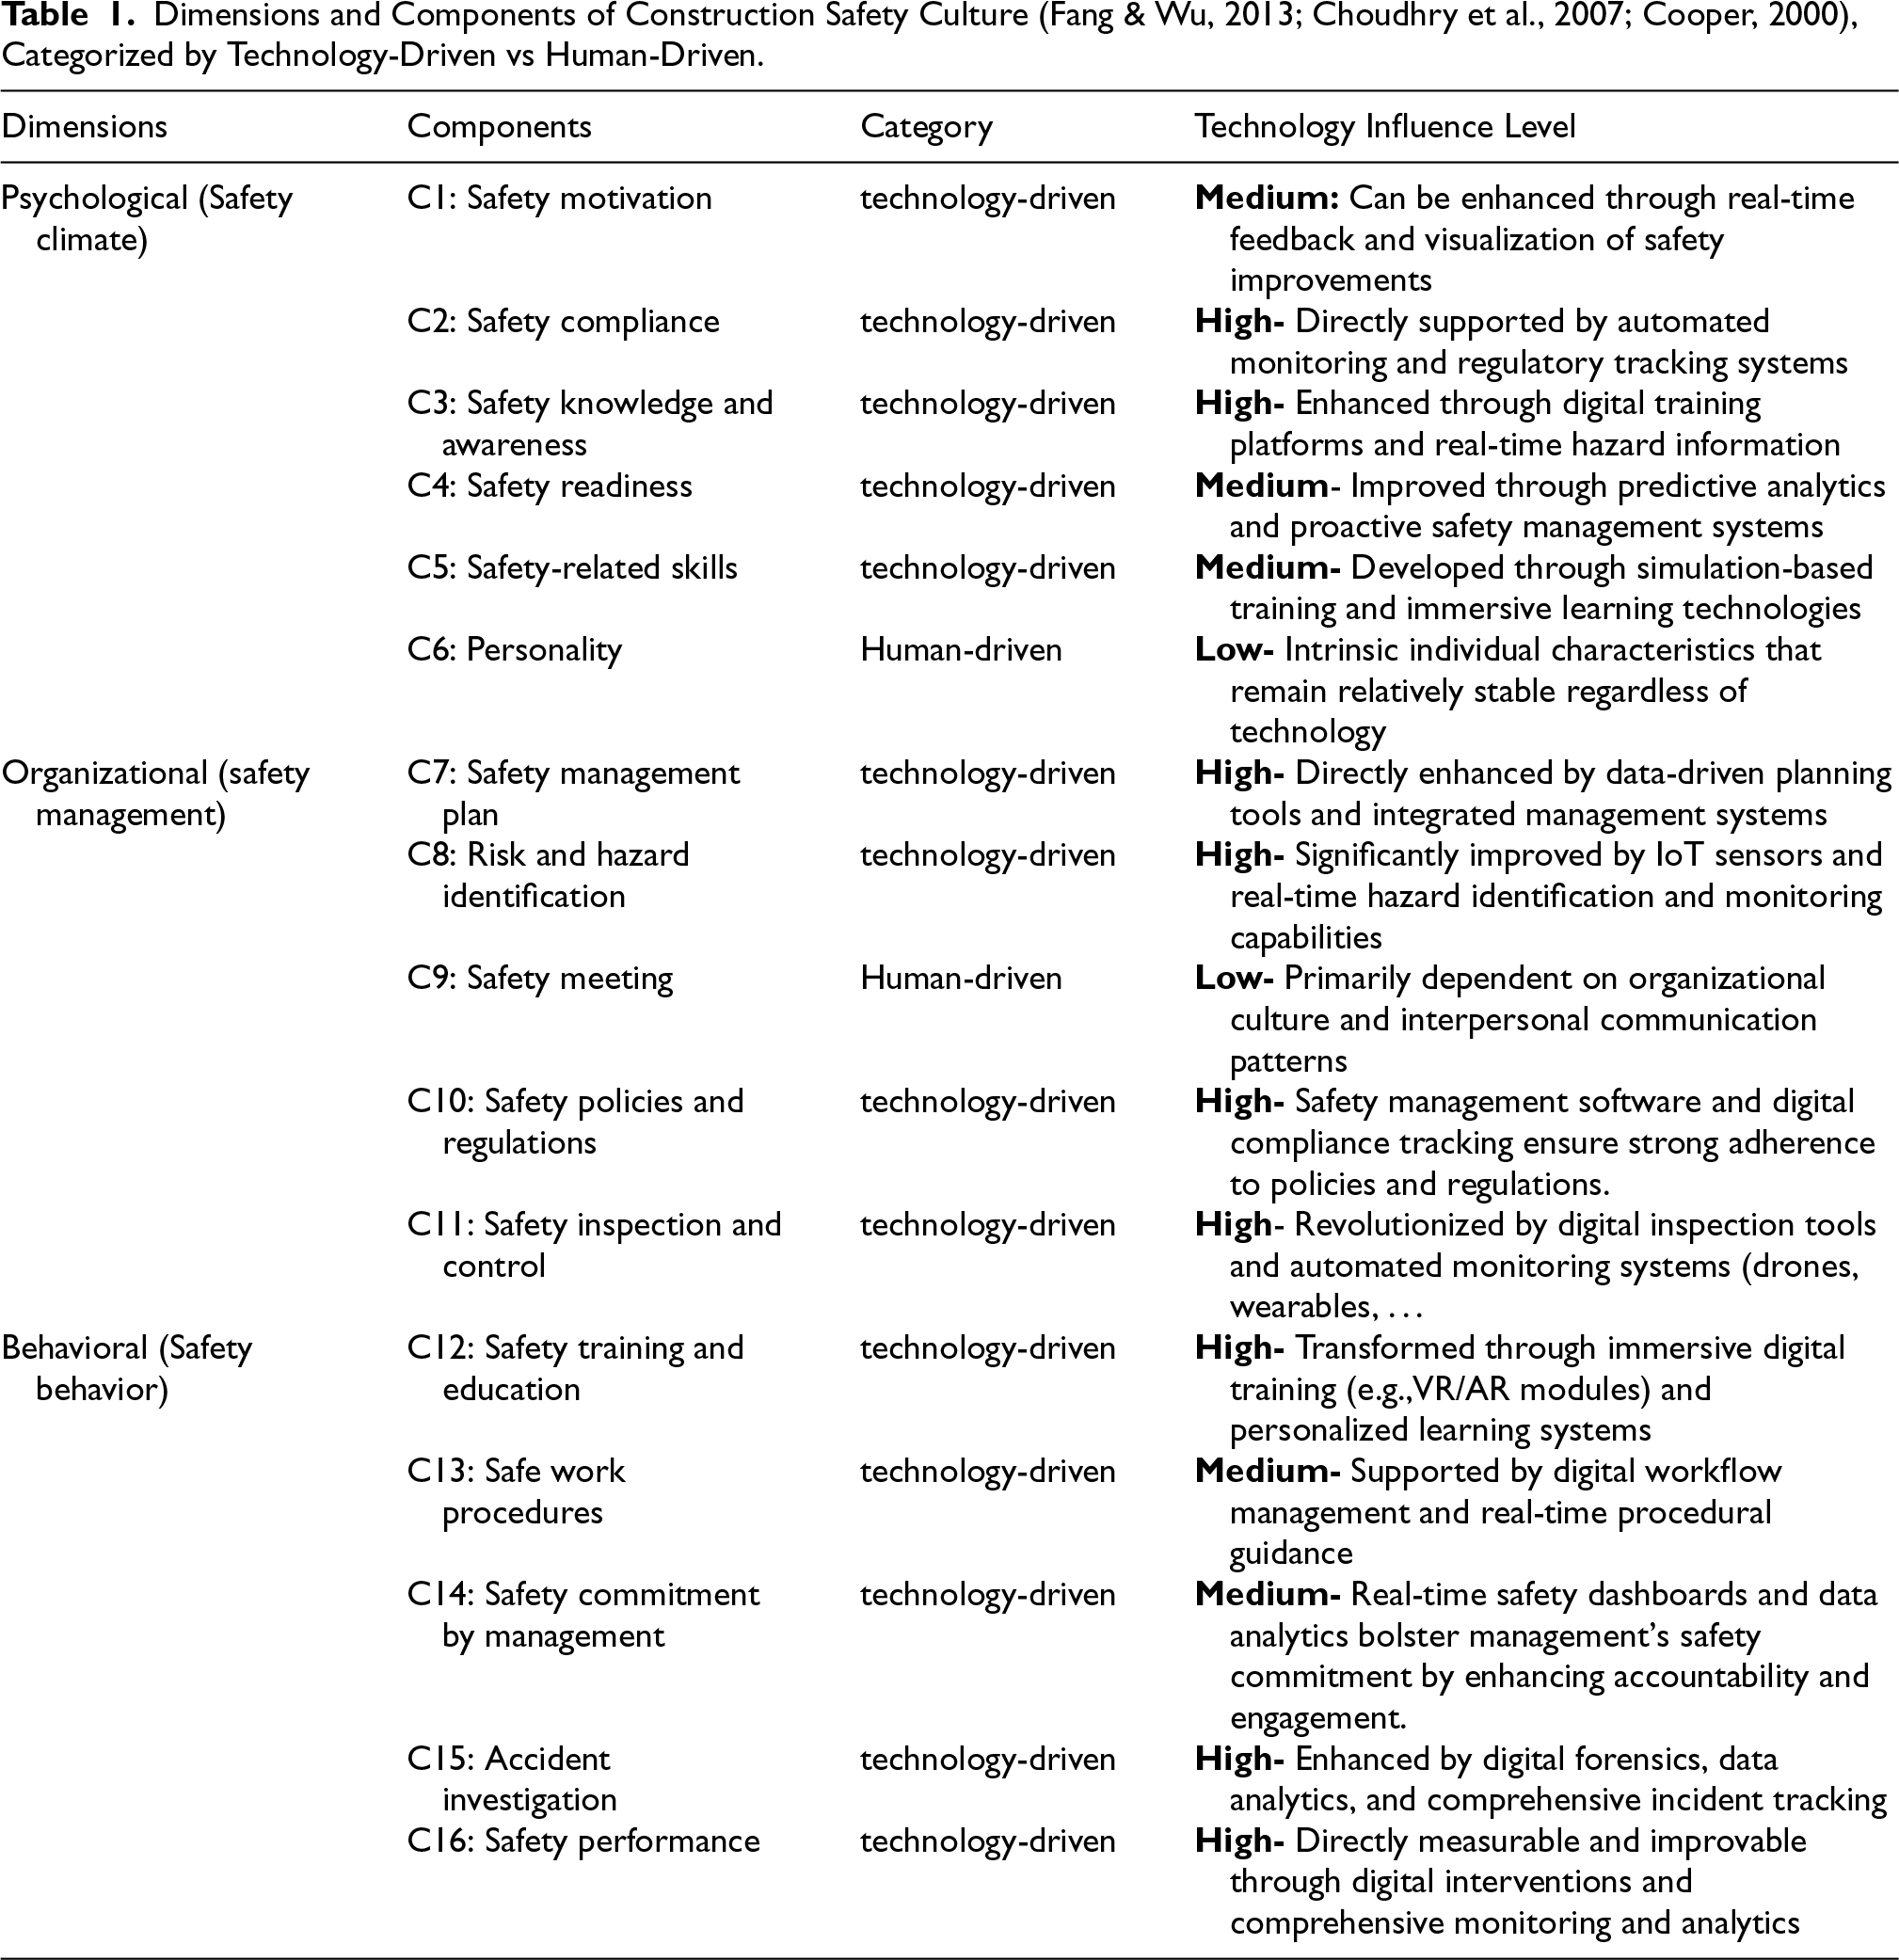
This study adopts a focused lens by selecting a subset of influential models that apply the triad approach to construction safety culture. Notably, the frameworks developed by Cooper (2000), Choudhry et al. (2007), and Fang and Wu (2013) are utilized due to their systematic representation of safety culture dimensions and their practical relevance to the construction domain. Each of these models articulates safety culture through three interlinked dimensions- psychological, behavioral, and organizational- offering a structured foundation for understanding, assessing, and ultimately improving safety performance. The key components associated with each dimension and level of technology influence (High/Medium/Low) for each component, as highlighted by these models, are summarized in the Table 1.
Dimensions and Components of Construction Safety Culture (Fang & Wu, 2013; Choudhry et al., 2007; Cooper, 2000), Categorized by Technology-Driven vs Human-Driven.
Dimensions and Components of Construction Safety Culture (Fang & Wu, 2013; Choudhry et al., 2007; Cooper, 2000), Categorized by Technology-Driven vs Human-Driven.
This analytical framework distinguishes between technology-responsive components, which show high sensitivity to BIM-IoT integration, and human-driven components that require complementary organizational and interpersonal interventions. Technology-driven elements (e.g., hazard identification, procedures, compliance) typically demonstrate stronger causal links with BIM-IoT advantages, while human-centered elements such as personality traits (C6) and safety meetings (C9) show limited direct influence but can benefit indirectly through strengthened organizational systems and improved safety environments. This categorization guides practitioners in designing targeted strategies, directing technological investments toward high-impact components while addressing human-driven aspects through organizational development initiatives.
In addition, the classification of safety culture dimensions into psychological, organizational, and behavioral categories provides a systematic approach for evaluating safety practices in construction. It enables a deeper understanding of the interplay between individual, organizational, and operational factors influencing safety outcomes. Within this research, these dimensions form the foundation for analyzing BIM-IoT advantages and contribute to a model that reflects the complex nature of safety performance, offering a structured basis for prioritizing intervention efforts.
The integration of BIM and IoT creates a robust framework for improving safety management in construction. Health and safety are critical concerns in construction due to legal and health risks for workers and occupants. By combining BIM's detailed visual models with IoT's real-time and recordable data, this synergy addresses the limitations of each technology, enhancing hazard identification, risk assessment, and safety compliance (Mohammed et al., 2020, 2022). According to Tang et al. (2019), Key applications of BIM-IoT integration in health and safety (H&S) management include H&S training and On-site monitoring for H&S.
Several studies have referred to the application and advantages of BIM-IoT integration in H&S management. Teizer et al. (2013) introduced an innovative training method for construction workers, combining real-time location tracking and 3D visualization to enhance safety and productivity education. Tested on steel-erection tasks, the system improved safety awareness, training engagement, and performance assessment while reducing visibility-related risks. Li et al. (2015) developed the Proactive Construction Management System (PCMS), combining real-time location tracking and data visualization to enhance worker training. Tested in Hong Kong, it improved safety awareness, efficiency, and proactive risk management, with potential for global application in addressing workforce challenges.
Riaz et al. (2014) develops an integrated solution using BIM and wireless sensor technology to improve H&S in confined spaces on construction sites. It presents a conceptual model, refined through industry feedback, and a prototype that uses real-time sensor data for intelligent monitoring. The system enhances visualization of hazardous environments, aiding proactive safety management. Kiani et al. (2014) proposes a prototype system integrating BIM and Wireless Sensor Networks (WSN) to enhance real-time environmental monitoring, visualization, and notification for construction health and safety management. Focused on mitigating heat stress and atmospheric hazards, the system, integrated with Autodesk Revit, offers seamless usability and persistent data storage via an SQL Server. It supports proactive safety management without additional user training. Cheng and Teizer (2013) developed a framework that streams real-time data from construction resources to a VR platform for visualization. Tested in simulated, outdoor, and training environments, the system enhances situational awareness, safety, and decision-making through real-time insights into construction activities. Ding et al. (2022) developed an IoT sensor-based BIM system to create smart safety barriers for managing hazardous energy in petrochemical construction. Implemented on a large-scale Sinopec project, the system effectively isolates hazardous energy, enhances worker safety, and supports site visualization, personnel management, and hazardous area monitoring. Qian (2021) introduced an automated tunnel monitoring system integrating BIM, IoT, and GNSS for real-time monitoring of mountain tunnels. Sensors collect data on deformation and groundwater levels, which is transmitted to a cloud platform. BIM visualizes the data in a 3D model, improving construction management, safety, and reducing accidents.
Zhang and Bai (2015) introduced a BIM-integrated structural condition monitoring system using RFID-based BT strain sensors to detect structural deformation non-contact. The system identifies damage, such as buckling or yielding, by highlighting affected elements in BIM models, enabling quick post-hazard inspections. Validated by large truss structures, it provides real-time visualization of structural health, improving safety, maintenance planning, and decision-making. Sakr and Sadhu (2023) proposed integrating BIM and IoT for real-time Structural Health Monitoring (SHM). IoT sensors collect structural data, stored in a web-based database for continuous monitoring. Validated through experiments on a bridge and building model, the system aims to create an early-phase Digital Twin for visualizing real-time data within the BIM database. Scianna et al. (2022) integrated IoT sensors with BIM for real-time monitoring of bridge deflection. The system links the physical structure to its digital twin via an RDBMS, enabling real-time risk assessment. Tested on a scaled model, it offers a low-cost, continuous monitoring solution for infrastructure, with plans for sensor enhancements and broader bridge monitoring applications.
Liang and Liu (2022) developed a safety risk warning system for underground construction, integrating BIM and IoT to address challenges like high investment, long durations, and complex environments. The system includes a safety risk indicator and real-time monitoring platform with a circular, 3D risks warning model for dynamic risk control. The study demonstrates the system's effectiveness in predicting risks and reducing accidents. Chen et al. (2021) developed a framework integrating BIM, IoT, and AR/VR to enhance situational awareness during high-rise building fire emergencies. A pilot test simulating a fire scenario demonstrated that the system aids firefighting teams in quickly locating fires and enhances trainee awareness through VR gamification.
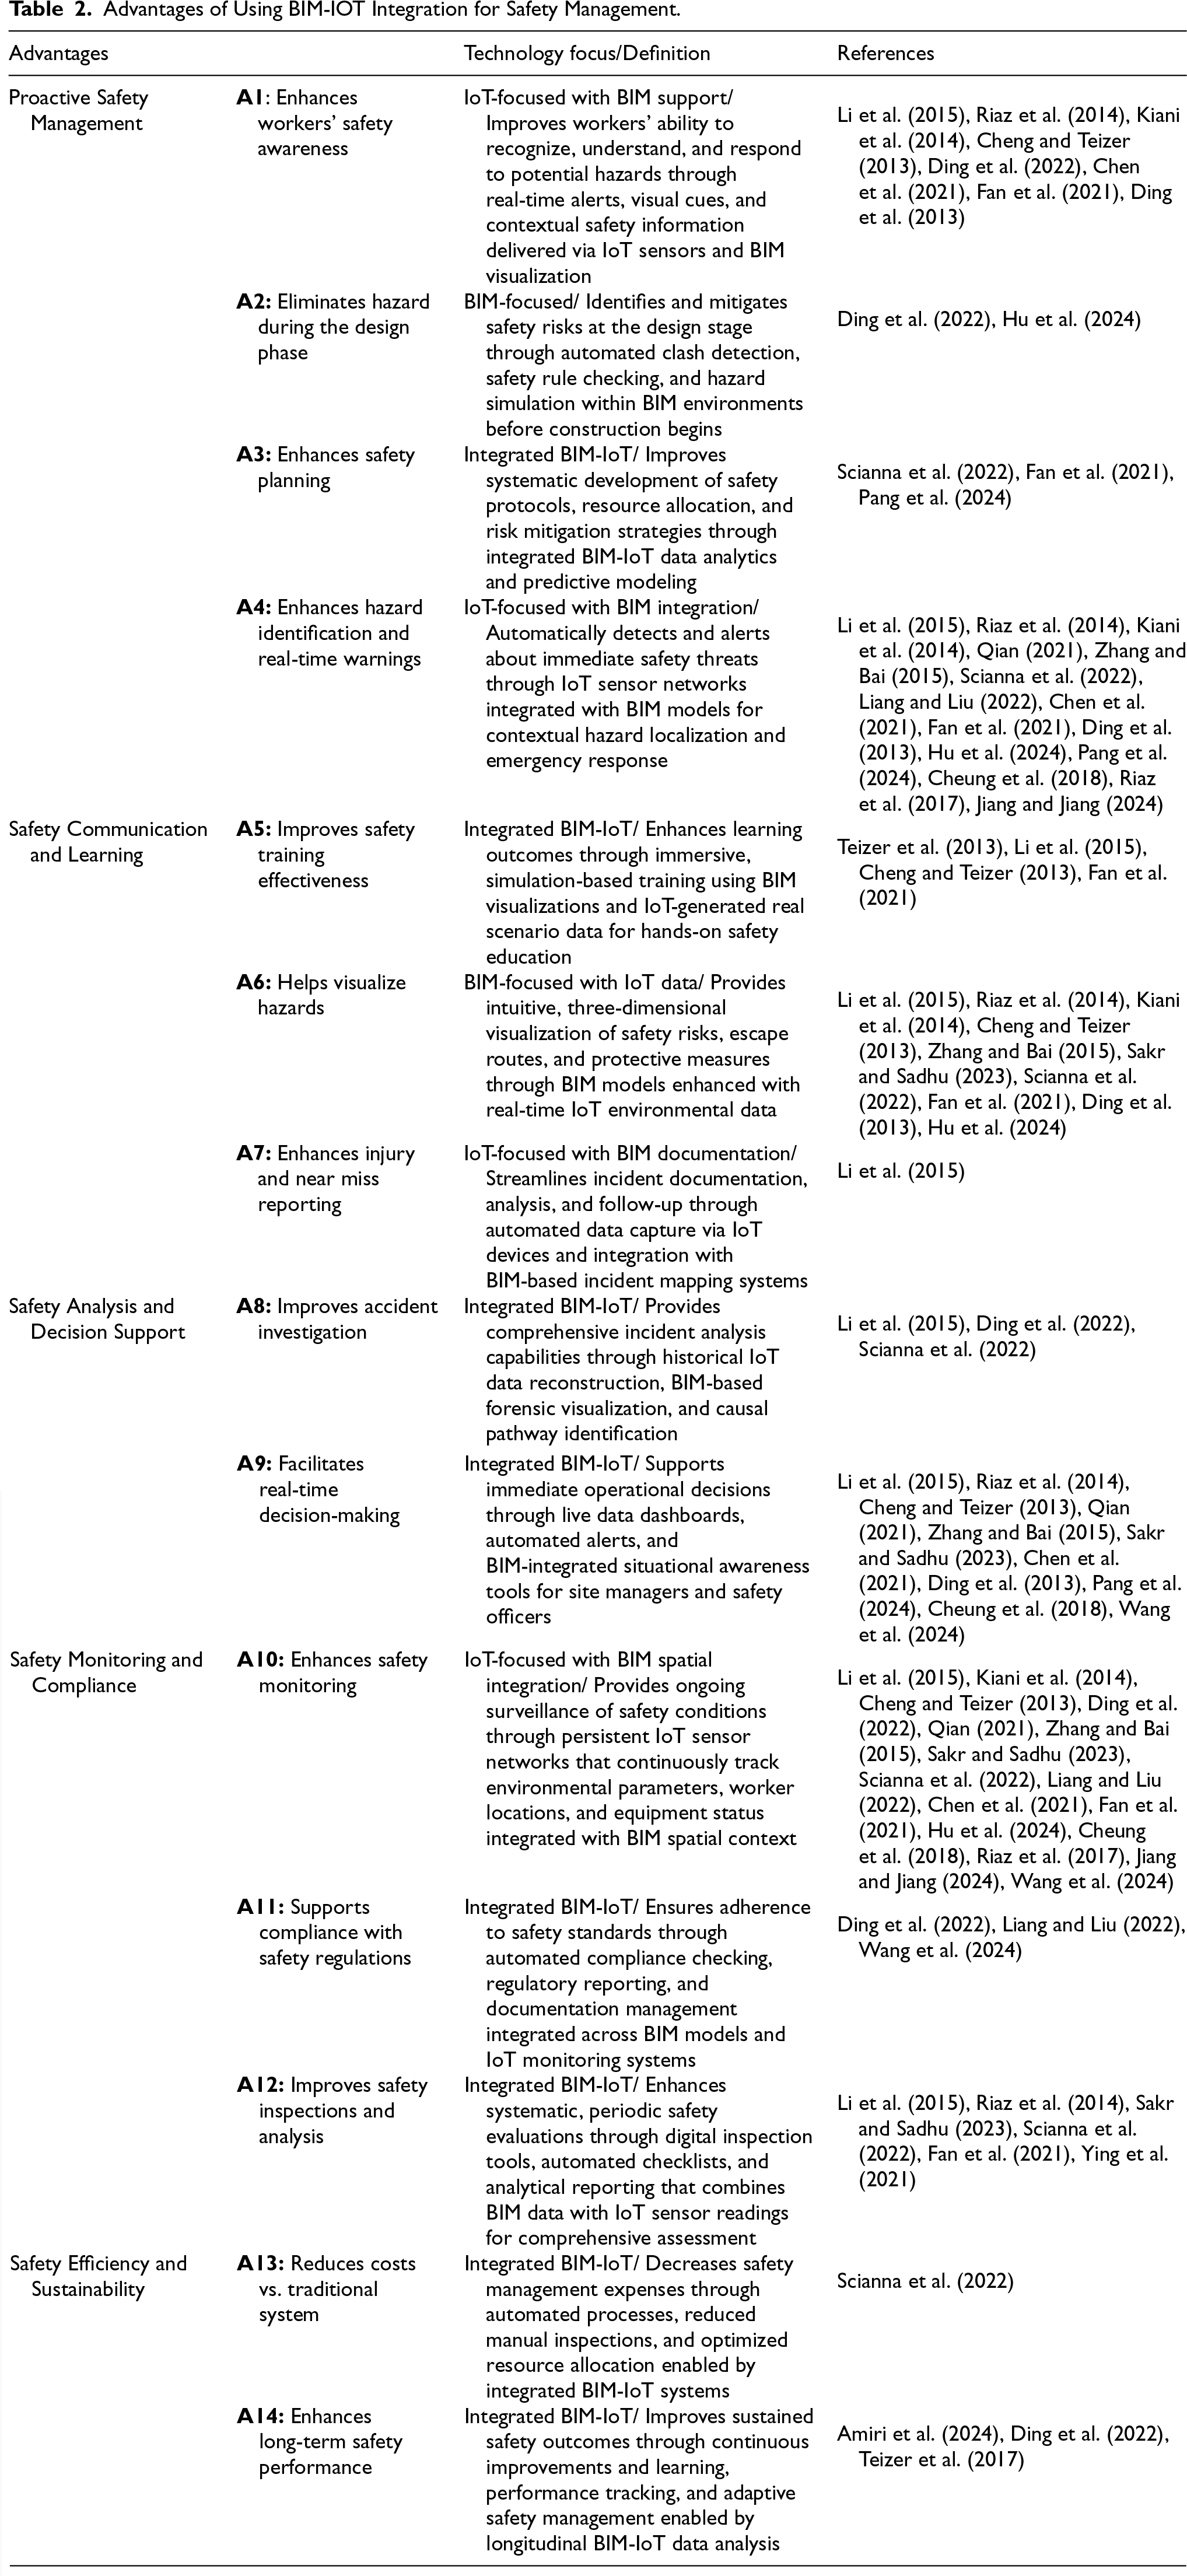
In conclusion, BIM-IoT integration delivers a comprehensive framework for modern safety management, providing capabilities for predictive analysis, immersive training, specialized hazard monitoring, and real-time decision-making. Table 2 summarizes advantages of using BIM-IOT integration for H&S management, referencing key studies that illustrate the impact of these technologies.
Advantages of Using BIM-IOT Integration for Safety Management.
Advantages of Using BIM-IOT Integration for Safety Management.
The comprehensive advantages of BIM-IoT integration highlighted in the Table 2 collectively underscore its transformative potential for construction safety management. By enabling proactive hazard identification, enhancing communication and training, supporting real-time monitoring, and facilitating informed decision-making, this integrated framework addresses critical gaps inherent in traditional safety approaches. Importantly, these benefits operate synergistically within complex safety culture systems, amplifying positive outcomes through feedback mechanisms and dynamic interactions. Therefore, a systematic and quantitative investigation into the multi-dimensional impacts of BIM-IoT integration is essential to optimize intervention strategies and guide effective implementation in diverse construction environments. This study employs advanced modeling techniques to capture these interdependencies, providing a robust foundation for evidence-based enhancement of safety culture.
The purpose of this study is to conceptualize and systematically analyse the dynamic interrelationships between BIM-IoT integration advantages and their causal influence on construction safety culture components through dynamic modeling techniques. This research adopts an analytical approach to understand how technology-enabled advantages systematically reinforce and transform safety culture dimensions across psychological, organizational, and behavioral levels.
To achieve this research objective, a Fuzzy Cognitive Map (FCM) dynamic modeling approach is employed as an analytical framework. FCM methodology is specifically selected because: (1) it accommodates the inherent complexity and reciprocal causality within safety culture systems where multiple factors interact dynamically; (2) it integrates expert knowledge to capture qualitative causal relationships alongside quantitative relationship strengths; (3) it enables dynamic scenario-based forecasting for evidence-informed decision support in technology implementation planning; and (4) it reveals both direct causal pathways and indirect reinforcing feedback loops that static analytical models cannot capture, thereby providing a more comprehensive understanding of how BIM-IoT advantages collectively influence safety outcomes.
The FCM method serves as a powerful tool for understanding and analyzing complex systems with multiple interrelated concepts by capturing expert beliefs and allowing analysis even with limited information (Glykas, 2010). FCMs are widely recognized in research, with applications across business, information technology, engineering, environmental science, and social sciences. The method allows decision-makers to analyze causal relationships while accommodating ambiguous degrees of causality between concepts, making it particularly suitable for modeling emerging technology-culture interactions where relationships remain incompletely understood.
Figure 1 presents the comprehensive research framework detailing the complete procedures for: (1) model conceptualization and refinement through literature review and expert validation; (2) causal relationship elicitation from heterogeneous expert panels; (3) static analysis to evaluate cumulative direct and indirect effects; (4) dynamic analysis through iterative scenario simulations; and (5) validation procedures to ensure model reliability and appropriateness as a representation of the studied phenomenon (Kleijnen, 1995).
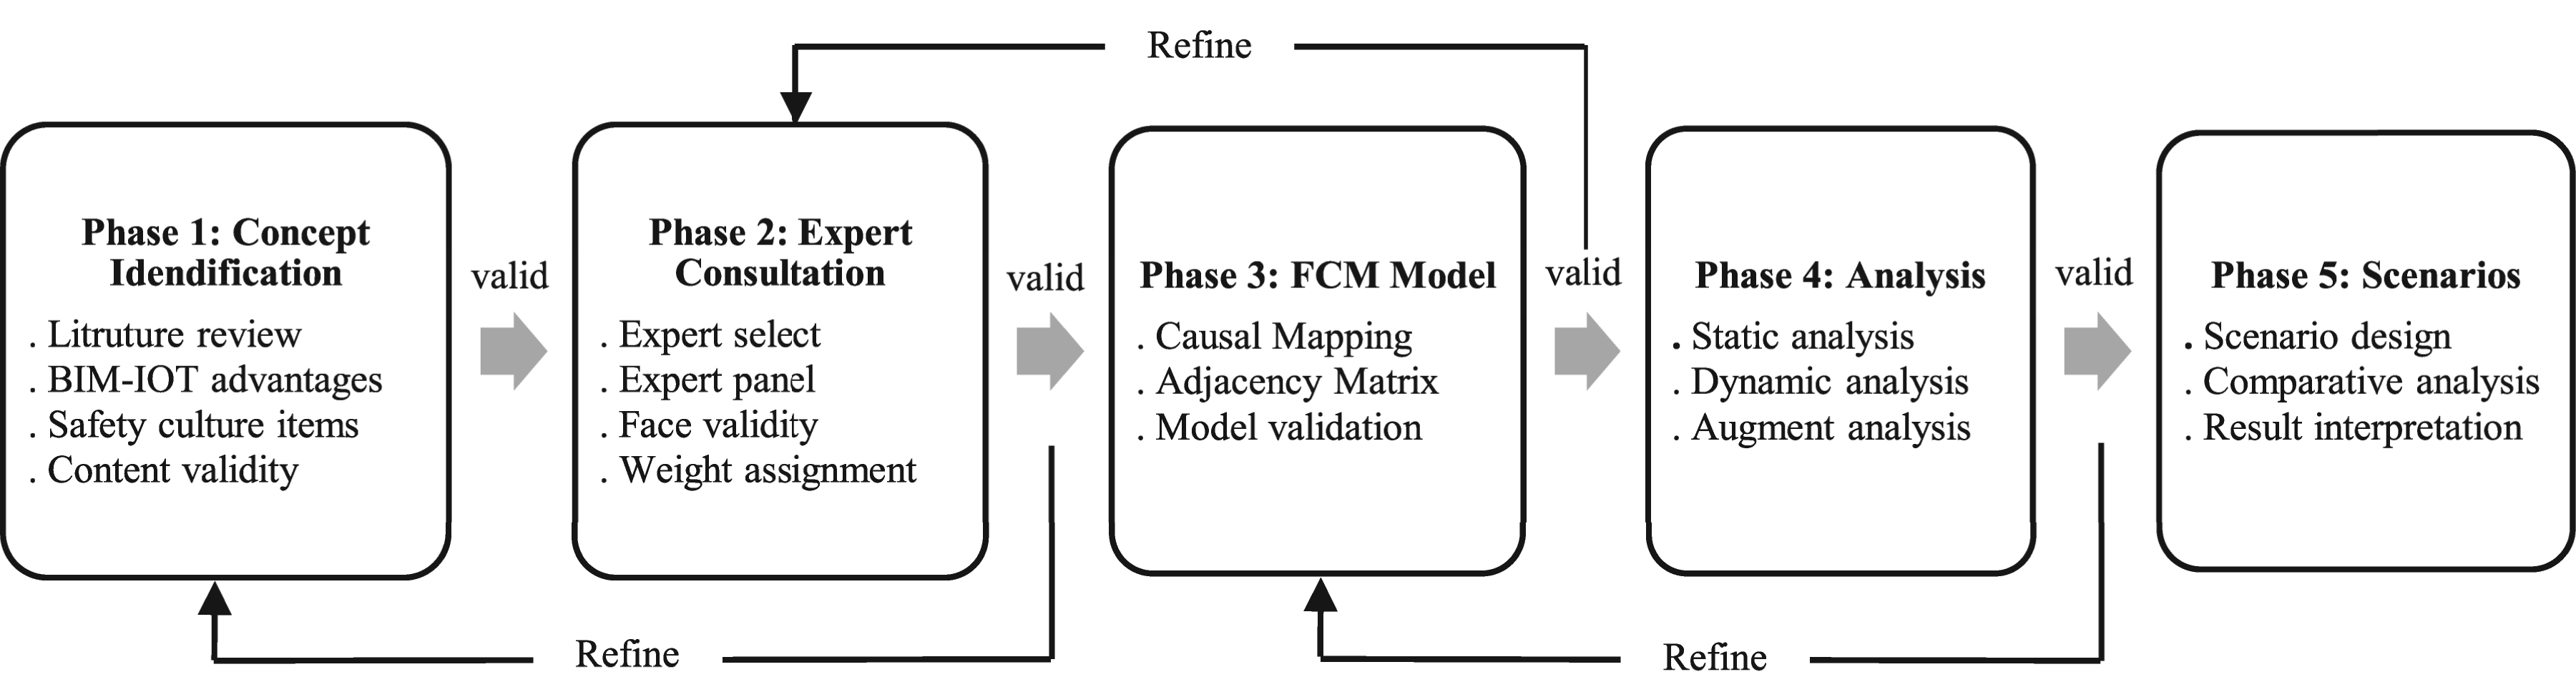
Comprehensive research methodology framework.
The FCM method, introduces as an extension of cognitive maps, serves as a powerful tool for understanding and analyzing complex systems with multiple interrelated concepts (Kosko, 1986). The FCM model, with its interdependent concepts, serves as a system dynamics tool where concept values evolve iteratively. While sharing similarities with Artificial Neural Networks (ANN), FCMs exhibit distinct behavior requiring alternative analytical approaches (Yegnanarayana, 2009). They are effective for modeling real-world problems, offering advantages such as simplicity, minimal resource needs, instant responsiveness, and ease of understanding (Christoforou & Andreou, 2016). FCMs capture expert beliefs and human perceptions, addressing uncertainty in construction projects and allowing analysis even with limited information or sample sizes, supported by a single expert or panel of domain experts (Lopez & Salmeron, 2014).
An FCM model is composed of concept nodes (Ci), which represent essential attributes, and weighted arcs (Wij) that define the causal relationships between these nodes (Salmeron et al., 2019). The relationships are classified as: 1) positive causality (Wij > 0), 2) negative causality (Wij < 0), and 3) no causality (Wij = 0). The magnitude of Wij indicates the strength of the impact that Ci exerts on Cj.
This section explains the two types of analyses performed in FCMs: static and dynamic. Static analysis evaluates the overall influence of input and intermediate concepts on output concepts within the model. To conduct static analysis, a causal path from one concept node (Ci) to another (Cj) is identified as a sequence, such as Ci –∼ Ck1, Ck1–∼… Ckn, Ckn–∼Cj. The indirect effect of Ci on Cj is determined by the causality Ci imparts to Cj through this path. The overall impact of Ci on Cj is then calculated by combining all indirect causalities affecting Cj (Kosko, 1986).
A simple fuzzy causal algebra is employed by interpreting the indirect effect operator (I) as a minimum operator (t-norm) and the general effect operator (T) as a maximum operator (s-norm) on a partially ordered set of causal values (Peláez & Bowles, 1996). Formally, let ∼ represent a causal concept space, and let e: ∼ x ∼ P denote a fuzzy causal edge function. Assume there are m causal paths from Ci to Cj, denoted as (i, k∼…. k∼, j) for 1 ∼< r ∼< m. The indirect effect of Ci on Cj through the rth causal path is represented as Ir (Ci,Cj), and the general effect over all m paths is denoted as T (Ci,Cj). This is mathematically expressed as:


To demonstrate the application of Eqs. (1) and (2), an example is provided by calculating the indirect effect of A1 (Safety Awareness) on C1 (Safety Motivation) (see Appendix IV).
Dynamic analysis, in contrast, begins with an extracted model, as previously mentioned, along with an initial state of the corresponding system. This initial state is represented by the weight matrix W and the initial vector A0, where A0 reflects the current states of each concept within the modeled system.
The main objective of dynamic analysis is to estimate the final state of the concepts, considering the causal and effective relationships within the model. To achieve this, an iterative process is initiated, with each step used to calculate the updated values of the concepts, as outlined in Eq. 3 (Groumpos, 2010).
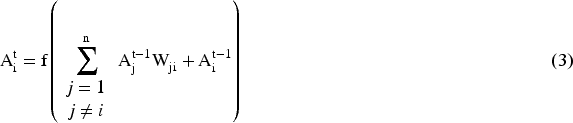
The iterative process continues until the system reaches convergence, defined by the following criterion:


The parameter ω = 1 was selected based on established FCM literature recommendations (Groumpos, 2010) and pilot testing with our expert panel. This value provides optimal balance between sensitivity and stability for this application. A comprehensive sensitivity analysis was conducted to establish result robustness (detailed in Section 4.3).
Fuzzy Cognitive Mapping (FCM) models are typically developed using expert knowledge to capture complex causal relationships among system components (Rodriguez-Repiso et al., 2007). Since the reliability and validity of the final FCM graph depend significantly on the quality of expert input, forming a panel of knowledgeable individuals with relevant experience is highly recommended (Yaman & Polat, 2009). For this study, the expert panel was established to model the dynamic interrelations between BIM-IoT integration and construction safety culture components.
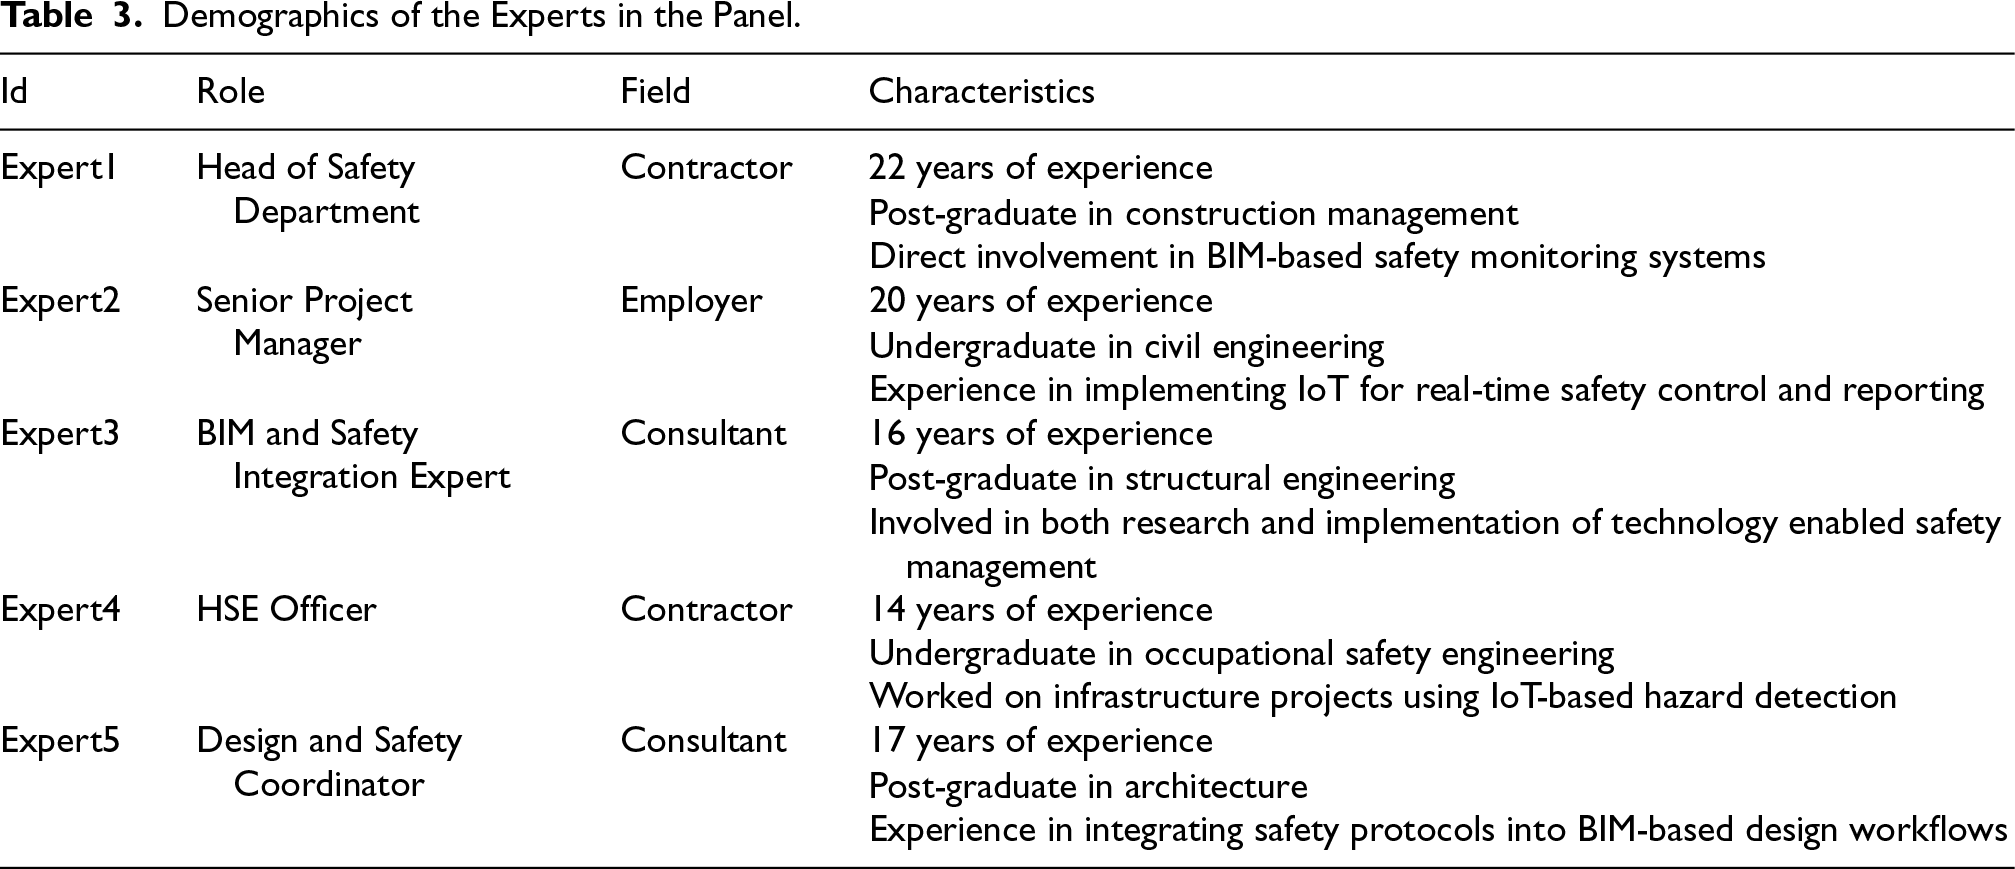
A heterogeneous expert panel-defined as a group of professionals with shared domain knowledge but differing roles, perspectives, or organizational affiliations (Ravasan & Mansouri, 2014) -was deliberately assembled. The ideal number of participants varies based on the research characteristics. Nonetheless, a higher level of panel heterogeneity allows for a smaller number of participants. The panel included professionals from various segments of the construction industry, such as project managers, employers, designers, safety consultants, and contractors. Given the diverse professional backgrounds of the experts and the breadth of experience required to address both technological integration and cultural dimensions of safety, a large panel size was not targeted (see Table 3 for expert demographics). Instead, consistency with previous FCM studies and methodological recommendations for heterogeneous panels (Lopez & Salmeron, 2014) justified selecting a sample size of five experts.
Demographics of the Experts in the Panel.
Demographics of the Experts in the Panel.
The experts were selected based on their direct involvement in construction projects where BIM and IoT technologies were implemented in safety-related processes. This ensured they possessed deep understanding of both technological and organizational aspects of BIM-IoT integration, as well as insight into safety planning, monitoring, training, and cultural transformation. To encompass the multidimensional nature of safety culture, participants were selected to reflect a range of functional roles across planning, design, execution, and safety management. The selected experts also had substantial professional tenure, with each having at least 14 years of experience in the field, and most holding dual academic and practical qualifications. This combination of perspectives facilitated meaningful interpretation of FCM methodology and accurate assessment of causal weightings among variables.
As the first step to create the FCM model, the BIM-IoT integration advantages are identified and conceptualized along with safety culture components. An FCM model is specifically built for predicting the joint influences of advantages by categorizing them as proactive safety management, safety communication and learning, safety analysis and decision support, safety monitoring and compliance, and safety efficiency and sustainability advantages.
Then, the conceptual validity of the created model is assessed. We thus sought to corroborate whether the concepts (advantages, components) underlying the conceptual framework are correct and enough to model the impact of advantages on the components of safety culture.
In doing so, first in the literature review, every relevant concept into the model are identified, following the idea of theoretical saturation (Breckenridge & Jones, 2009), so that at the end of the review, we were not able to find any new concept to add the model. This process assures the content validity of the concepts. Second, all panel experts are asked the following question: “Is this research looking at the study of BIM-IoT integration advantages from an appropriate perspective, and do you think we have a complete list of concepts?” The whole set of panel experts answered affirmatively. In addition, they approved the identified advantages and safety culture components of construction projects.
Through the process, a list of 14 advantages is identified and validated as the model's first layer and 16 safety culture components as the second layer (see Figure 2). Regarding many nodes and underlying interconnections, only a partial representation of the model is provided (See Appendices I, II, III).
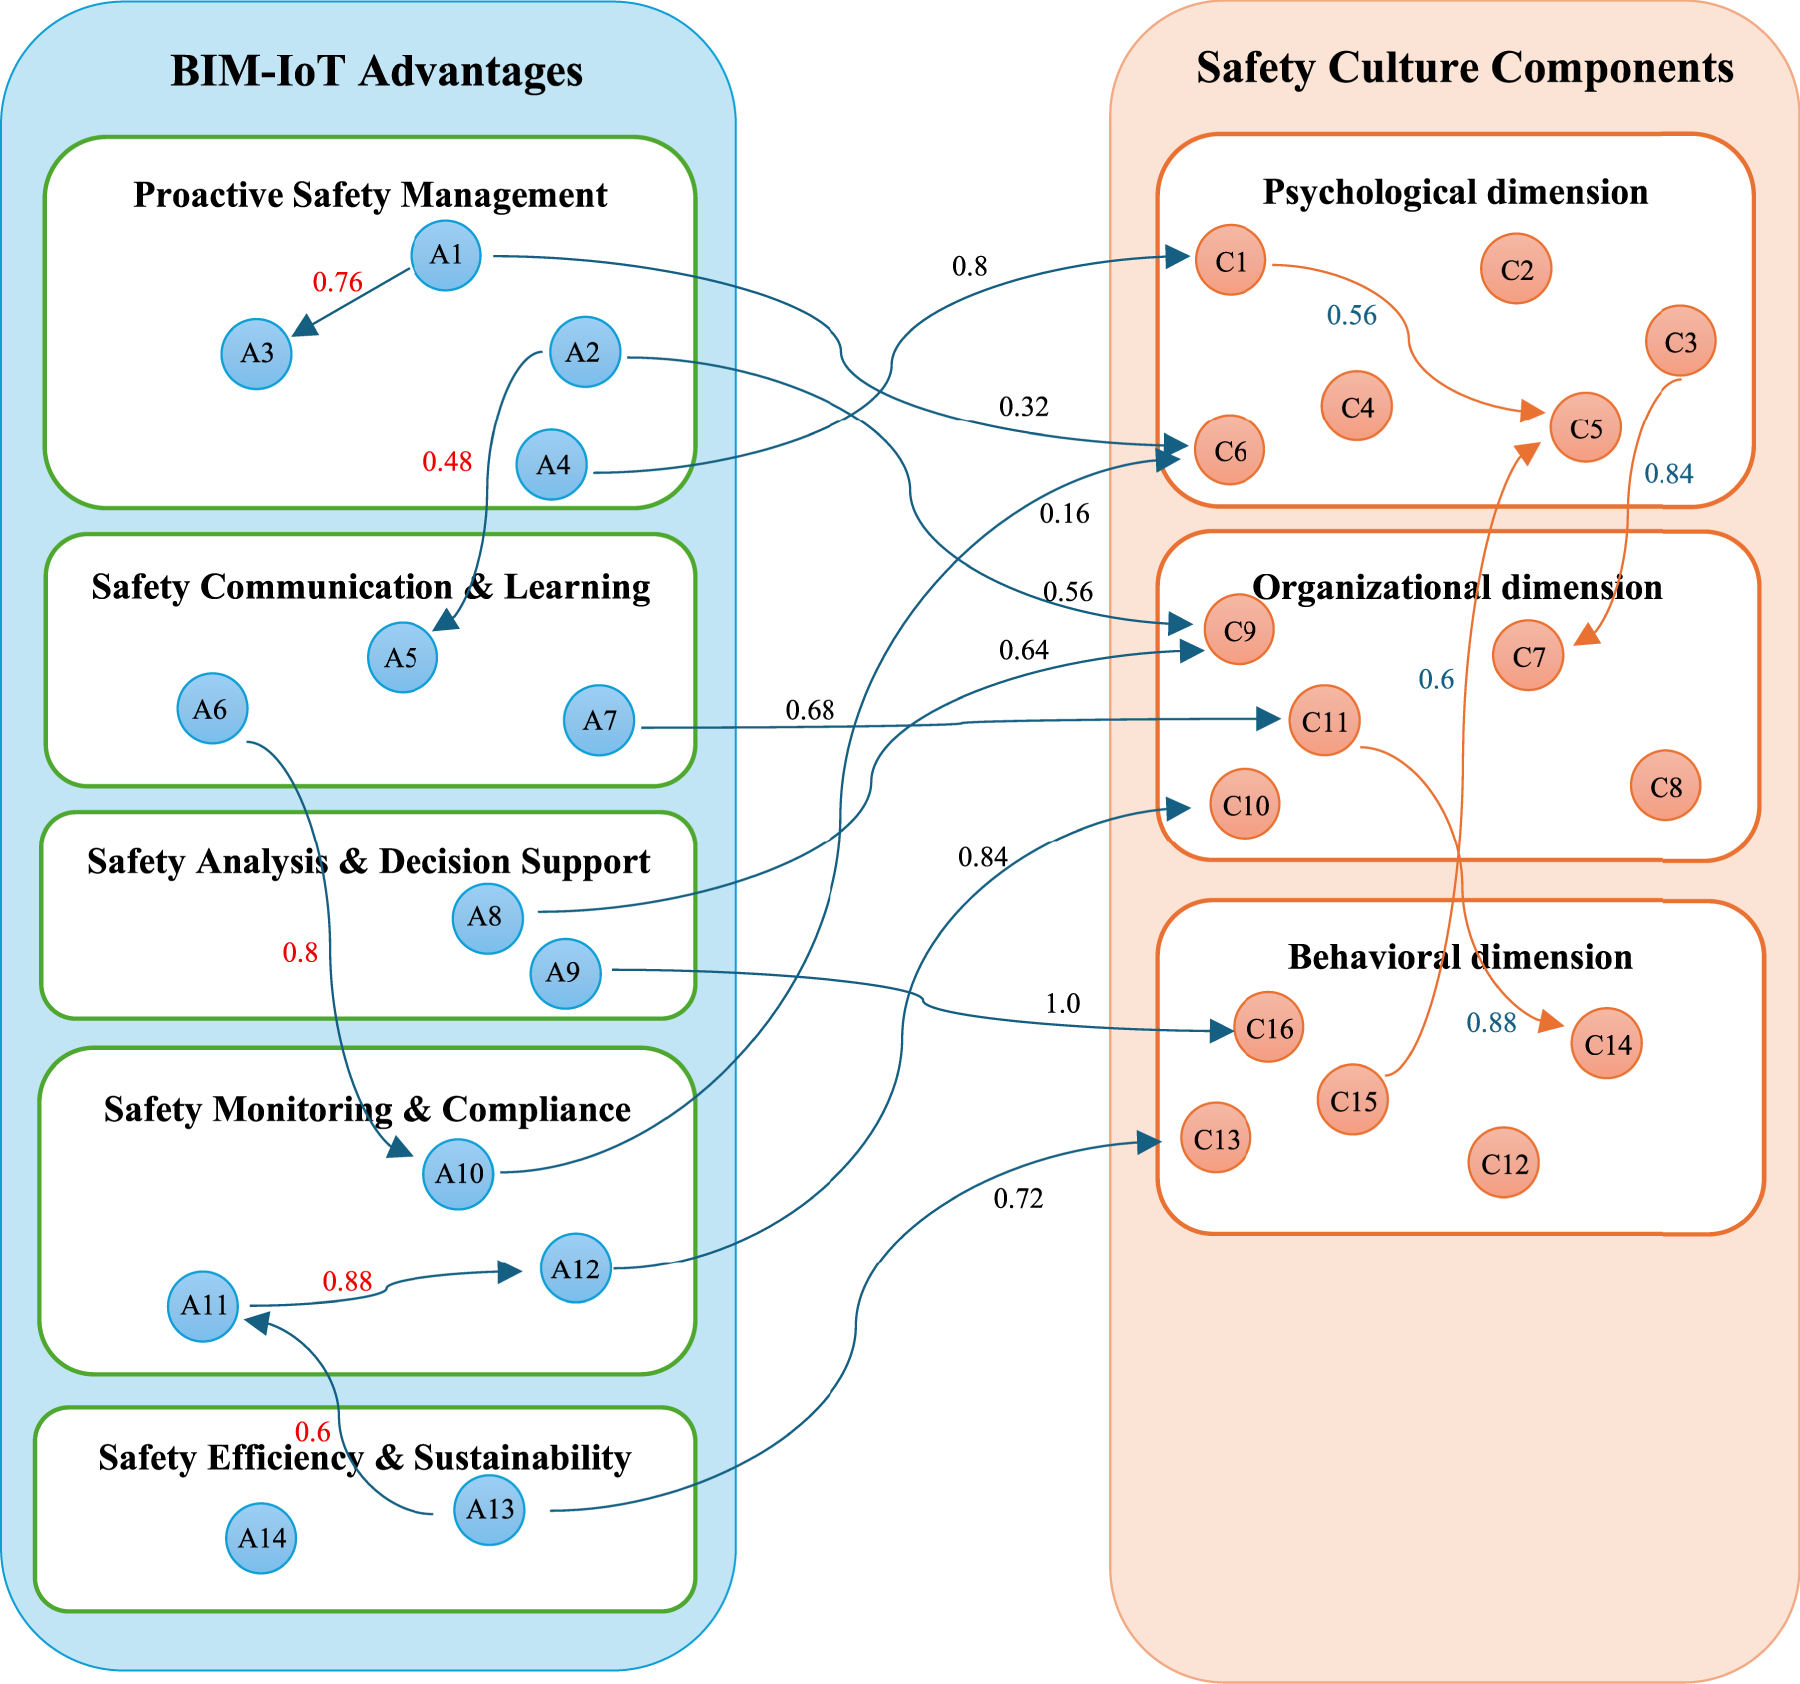
BIM-IoT integration advantages and safety culture components modes.
The FCM methodology incorporates two distinct analytical approaches: static and dynamic analysis. Static analysis is employed to assess the aggregated influence of individual concepts on the output variables, offering a comprehensive understanding of causal relationships within the system. In contrast, dynamic analysis is used to approximate the system's equilibrium state over iterative computations. Furthermore, dynamic simulations enable the examination of various “what-if” scenarios by initializing the model with different state vectors. For the purposes of this study, the entire computational framework, including model implementation and analysis, has been developed using the Python programming language.
Static Analysis
Figure 2 illustrates the graphical structure of the proposed FCM model, which captures the static relationships between the identified advantages and various components of construction safety culture. To enhance clarity and facilitate integration with the dynamic analysis discussed later in the text, the advantages have been categorized into five thematic groups of proactive safety management, safety communication and learning, safety analysis and decision support, safety monitoring and compliance, and safety efficiency and sustainability.
The FCM model incorporates three distinct layers of causal relationships:
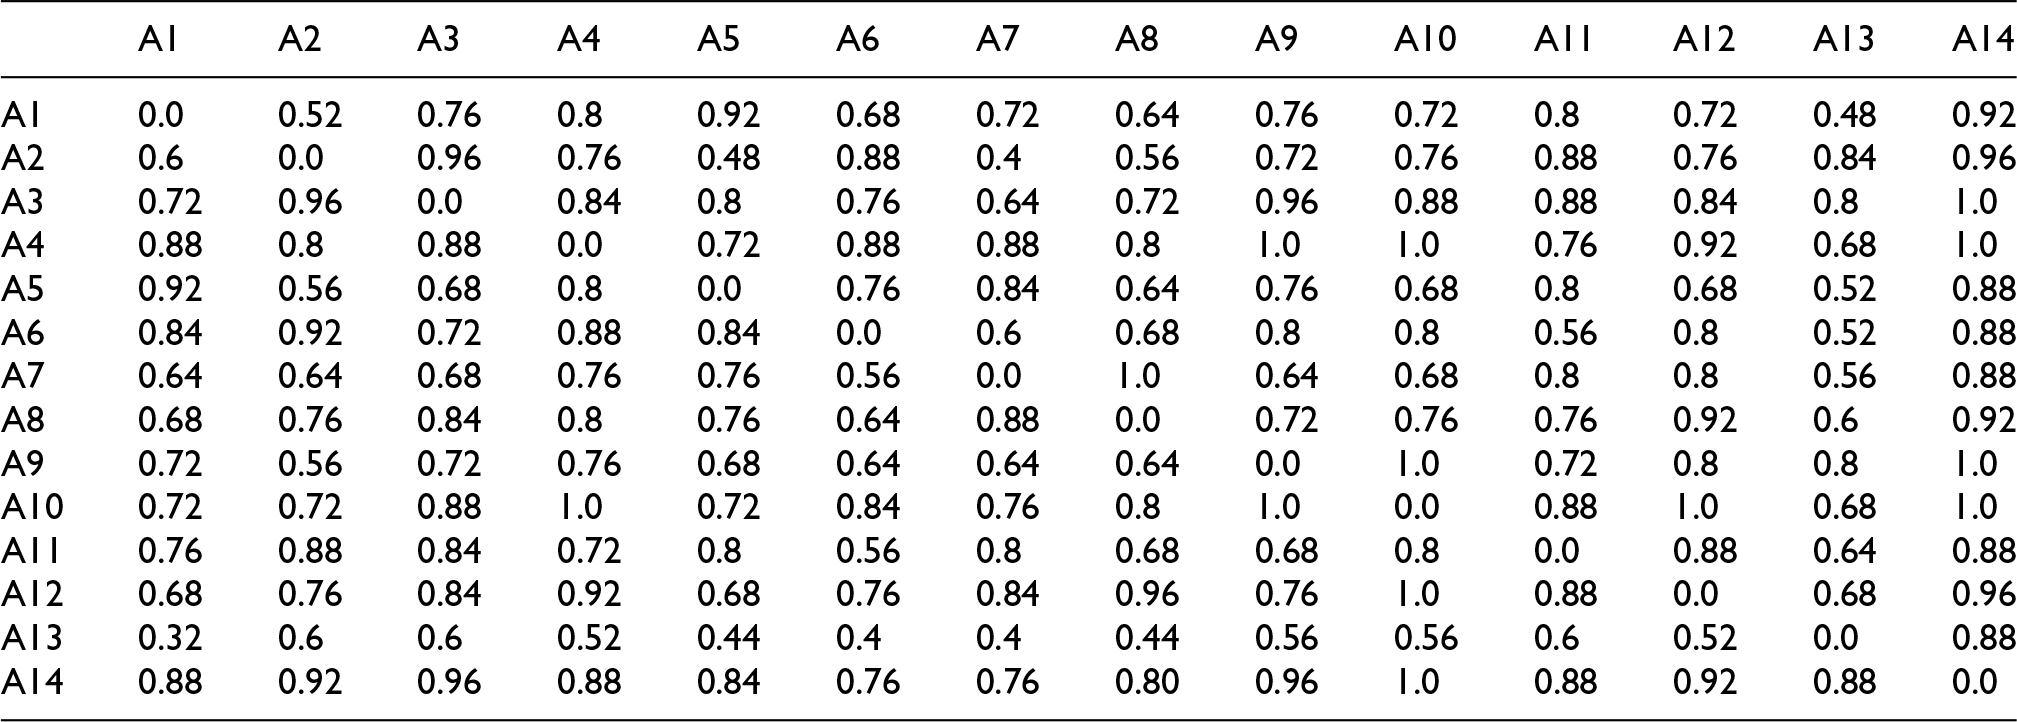
Layer 1: Direct relationships among BIM-IoT integration advantages (A-A interactions, Appendix I), representing technological and organizational interdependencies within the advantage set. Layer 2: Direct causal links from BIM-IoT integration advantages to construction safety culture components (A-C interactions, Appendix II), capturing how each advantage directly influences specific safety culture dimensions across psychological, organizational, and behavioral levels. Layer 3: Direct relationships among safety culture components themselves (C-C interactions, Appendix III), representing systemic feedback loops and interdependencies within safety culture dimensions. Beyond these direct relationships, the model inherently incorporates indirect causal pathways. These indirect effects emerge through network propagation, even when direct connections do not exist between two concepts. For example, although no direct link may exist between advantage A1 and component C8, an indirect pathway exists through intermediate nodes such as A1 → A5 → C8 or A1 → A3 → C7 → C8. Such multi-step pathways reflect the systemic nature of construction safety culture, where technological advantages amplify their effects through cascading influences across organizational and behavioral dimensions.
Based on the observed interactions between BIM-IoT integration advantages (Ai), and construction safety culture components (Ci) (see Appendices I, II, and III), the cumulative effects from BIM-IoT advantages to safety culture components (Ai ∼ Cj) can be calculated using Eqs. 1–4, which represent our static analysis. These calculations employ the max-min composition method to identify the maximum influence strength across all possible causal pathways in the network.
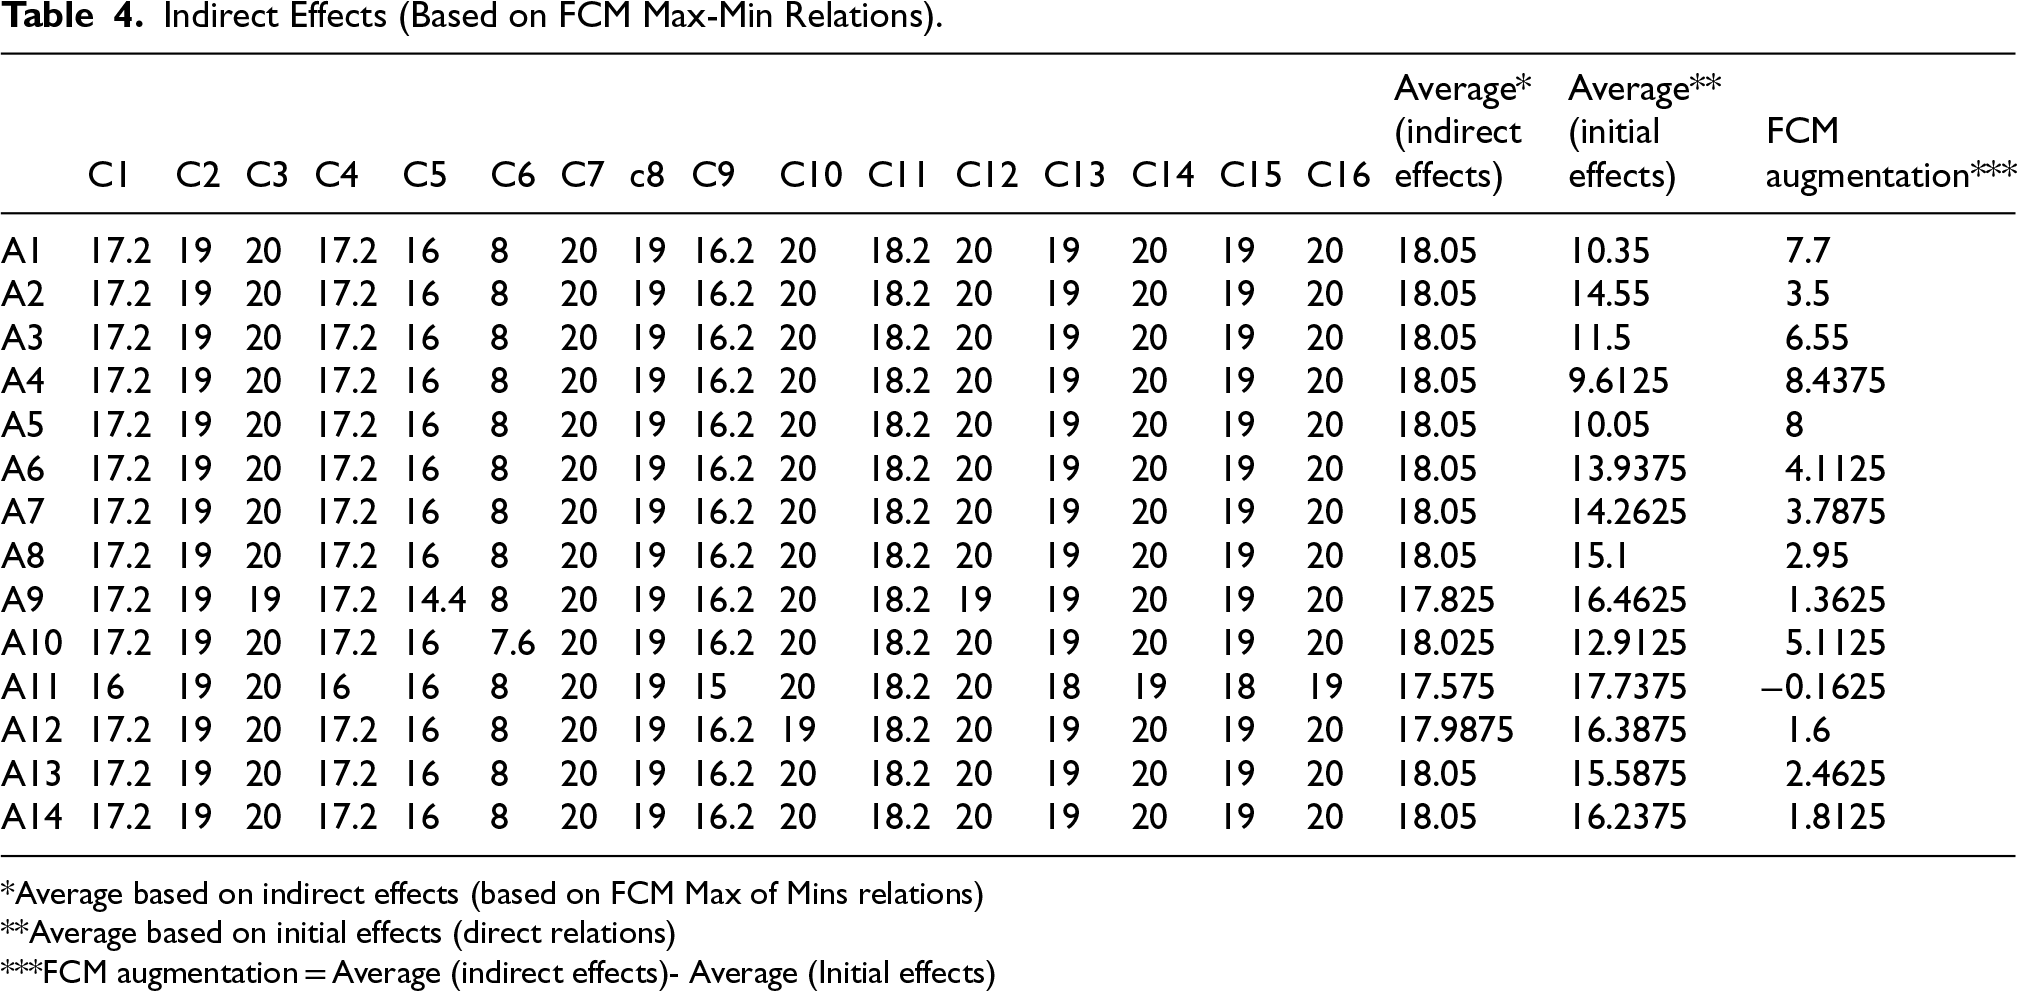
The primary outcome of the static analysis is the indirect effects of BIM-IoT integration advantages on construction safety culture components (see Table 4). The causal pathways among these concepts were determined through application of the max-min analytical method (Eqs. 1 and 2), wherein all advantages were simultaneously treated as both input and output nodes to capture their mutual influences (Appendix IV). Based on the results of this analysis, the following interpretations are presented.
Indirect Effects (Based on FCM Max-Min Relations).
Indirect Effects (Based on FCM Max-Min Relations).
Average based on indirect effects (based on FCM Max of Mins relations)
Average based on initial effects (direct relations)
FCM augmentation = Average (indirect effects)- Average (Initial effects)
The static analysis reveals critical insights regarding the effectiveness of BIM-IoT advantages and their reinforcing effects on construction safety culture. A systematic examination of FCM augmentation values (difference between indirect and direct effects) identifies distinct intervention priorities and strategic pathways for cultural transformation. Figure 3 shows comparison of direct, indirect, and augmentation effects of BIM-IoT integration advantages on construction safety culture.
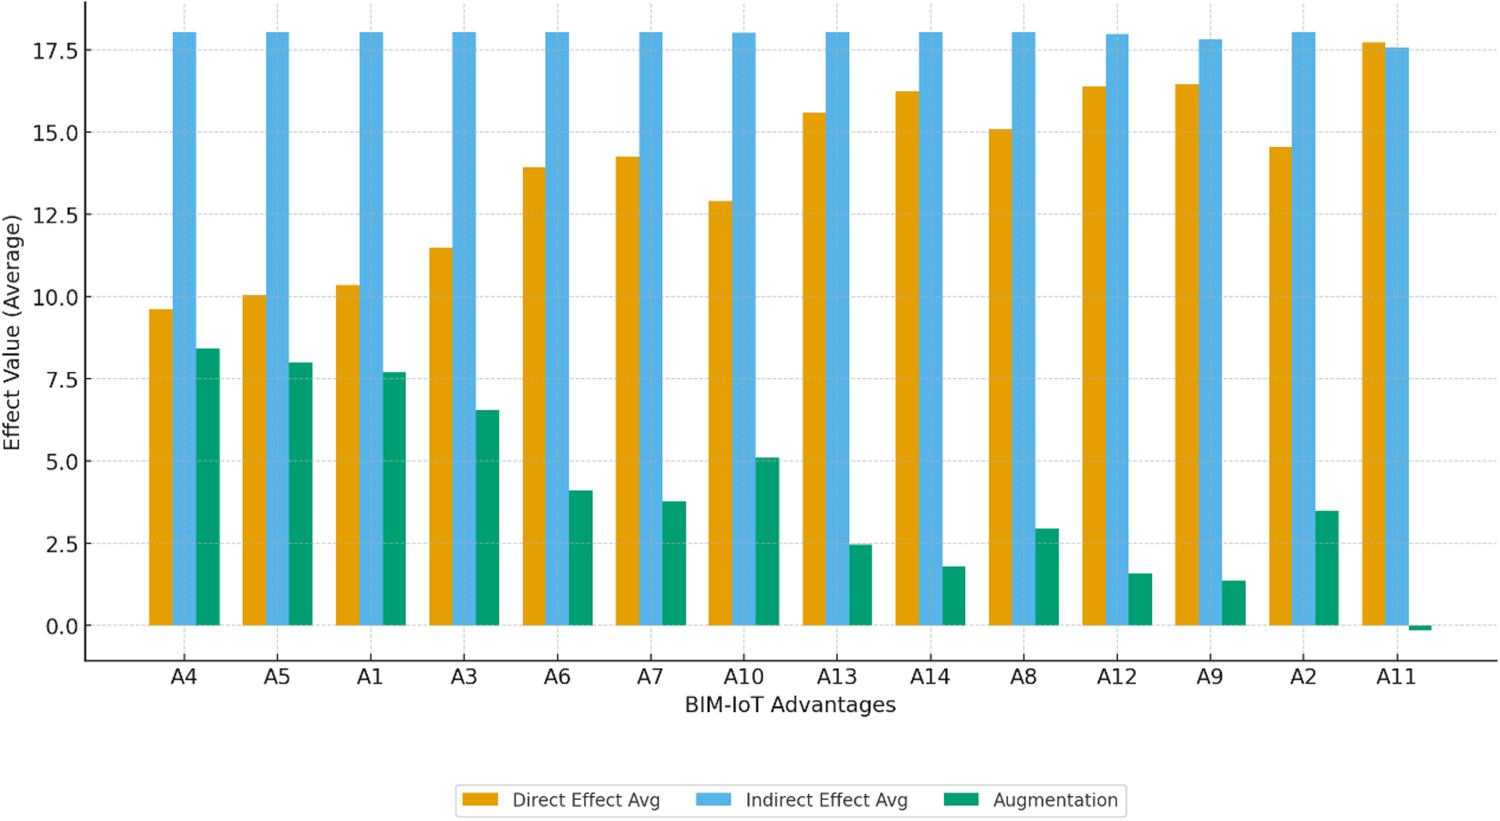
Direct, indirect and augmentation effects of BIM-IoT advantages and safety culture.
Among the various advantages of BIM-IoT integration,
However, the FCM augmentation analysis reveals a critical distinction between advantages that provide immediate technical benefits versus those that generate long-term cultural transformation.
These advantages with comparatively moderate direct effects but substantial FCM augmentation values (ranging from 3.5 to 8.44) indicate that their indirect effects- mediated through complex causal pathways within the safety culture network- significantly amplify their overall influence. Such findings resonate with safety culture theories that emphasize the dynamic interplay between awareness, communication, training, and reporting as vital enablers of safety performance improvement (Naji et al., 2022). This systemic perspective is consistent with Cooper's reciprocal safety culture model, which posits that psychological, behavioral, and organizational factors interact dynamically to shape safety outcomes (Cooper, 2000).
The high indirect effects observed for these advantages suggest the presence of reinforcing feedback loops within the safety culture system. For instance, improved hazard identification (A4) can lead to more effective training (A5), which in turn enhances reporting behaviors (A7), collectively strengthening the safety climate and behavioral compliance across the project. Conversely, A11 (Regulatory compliance), despite showing the highest direct effect, demonstrates negative augmentation (−0.16), indicating that its benefits may plateau without additional supportive interventions, suggesting that purely compliance-driven approaches are insufficient for sustained safety culture transformation.
Dimensional Effects Analysis
The static analysis reveals distinctive patterns across the three fundamental safety culture dimensions:
Strategic Implementation Priorities:
Based on dimensional and FCM augmentation analysis, three implementation phases emerge for maximizing cultural transformation:
The FCM method offers a powerful framework for conducting forecasting and “what-if” scenario analyses. In this study, the quantified influence levels of BIM-IoT integration advantages (A1-A14) on construction safety culture components (C1-C16) enable dynamic analysis that supports strategic decision-making. This approach allows practitioners to anticipate potential outcomes under various scenarios and identify necessary adjustments to optimize safety culture in construction projects.
In this study, six distinct scenarios were developed based on the activation of specific groups of BIM-IoT advantages, reflecting realistic and relevant clusters of benefits:
Scenario 1: Proactive Safety Management (A1-A4) Scenario 2: Safety Communication and Learning (A5-A7) Scenario 3: Safety Analysis and Decision Support (A8-A9) Scenario 4: Safety Monitoring and Compliance (A10-A12) Scenario 5: Safety Efficiency and Sustainability (A13-A14) Scenario 6: Combined Expert-Based Scenario (activation based on expert input data)
Each scenario represents a proposed initial condition where only the advantages within the designated group are activated, while others are deactivated. The initial state vectors for these scenarios are iteratively updated using the FCM activation functions (as defined in Eqs. 3 and 4) until the system reaches a steady-state equilibrium. At this point, the difference between successive iterations becomes negligible, indicating convergence.
In the dynamic FCM framework, all nodes- including both advantage nodes (A1-A14) and safety culture component nodes (C1-C16)-participate in iterative feedback processes. The complete network structure incorporates three causal layers: (1) intra-advantage relationships (A-A, Appendix I) enabling mutual reinforcement among technological benefits; (2) advantage-to-component influences (A-C, Appendix II) representing direct technological impacts on safety culture; and (3) intra-component relationships (C-C, Appendix III) capturing feedback loops within safety culture dimensions. During dynamic simulation (Eq. 3), advantage node values evolve through iterative propagation of influences from both other advantages and components, reflecting systemic reinforcement effects until network equilibrium is reached.
Table 5 presents the initial conditions and equilibrium values for each scenario. Following this, a detailed analysis of the dynamic results will be conducted to quantify the relative influence of each advantage group on the various safety culture components. This enables identification of the most impactful BIM-IoT advantages and inform prioritization strategies for enhancing construction safety culture.
Simulation Results of the Proposed Scenarios.
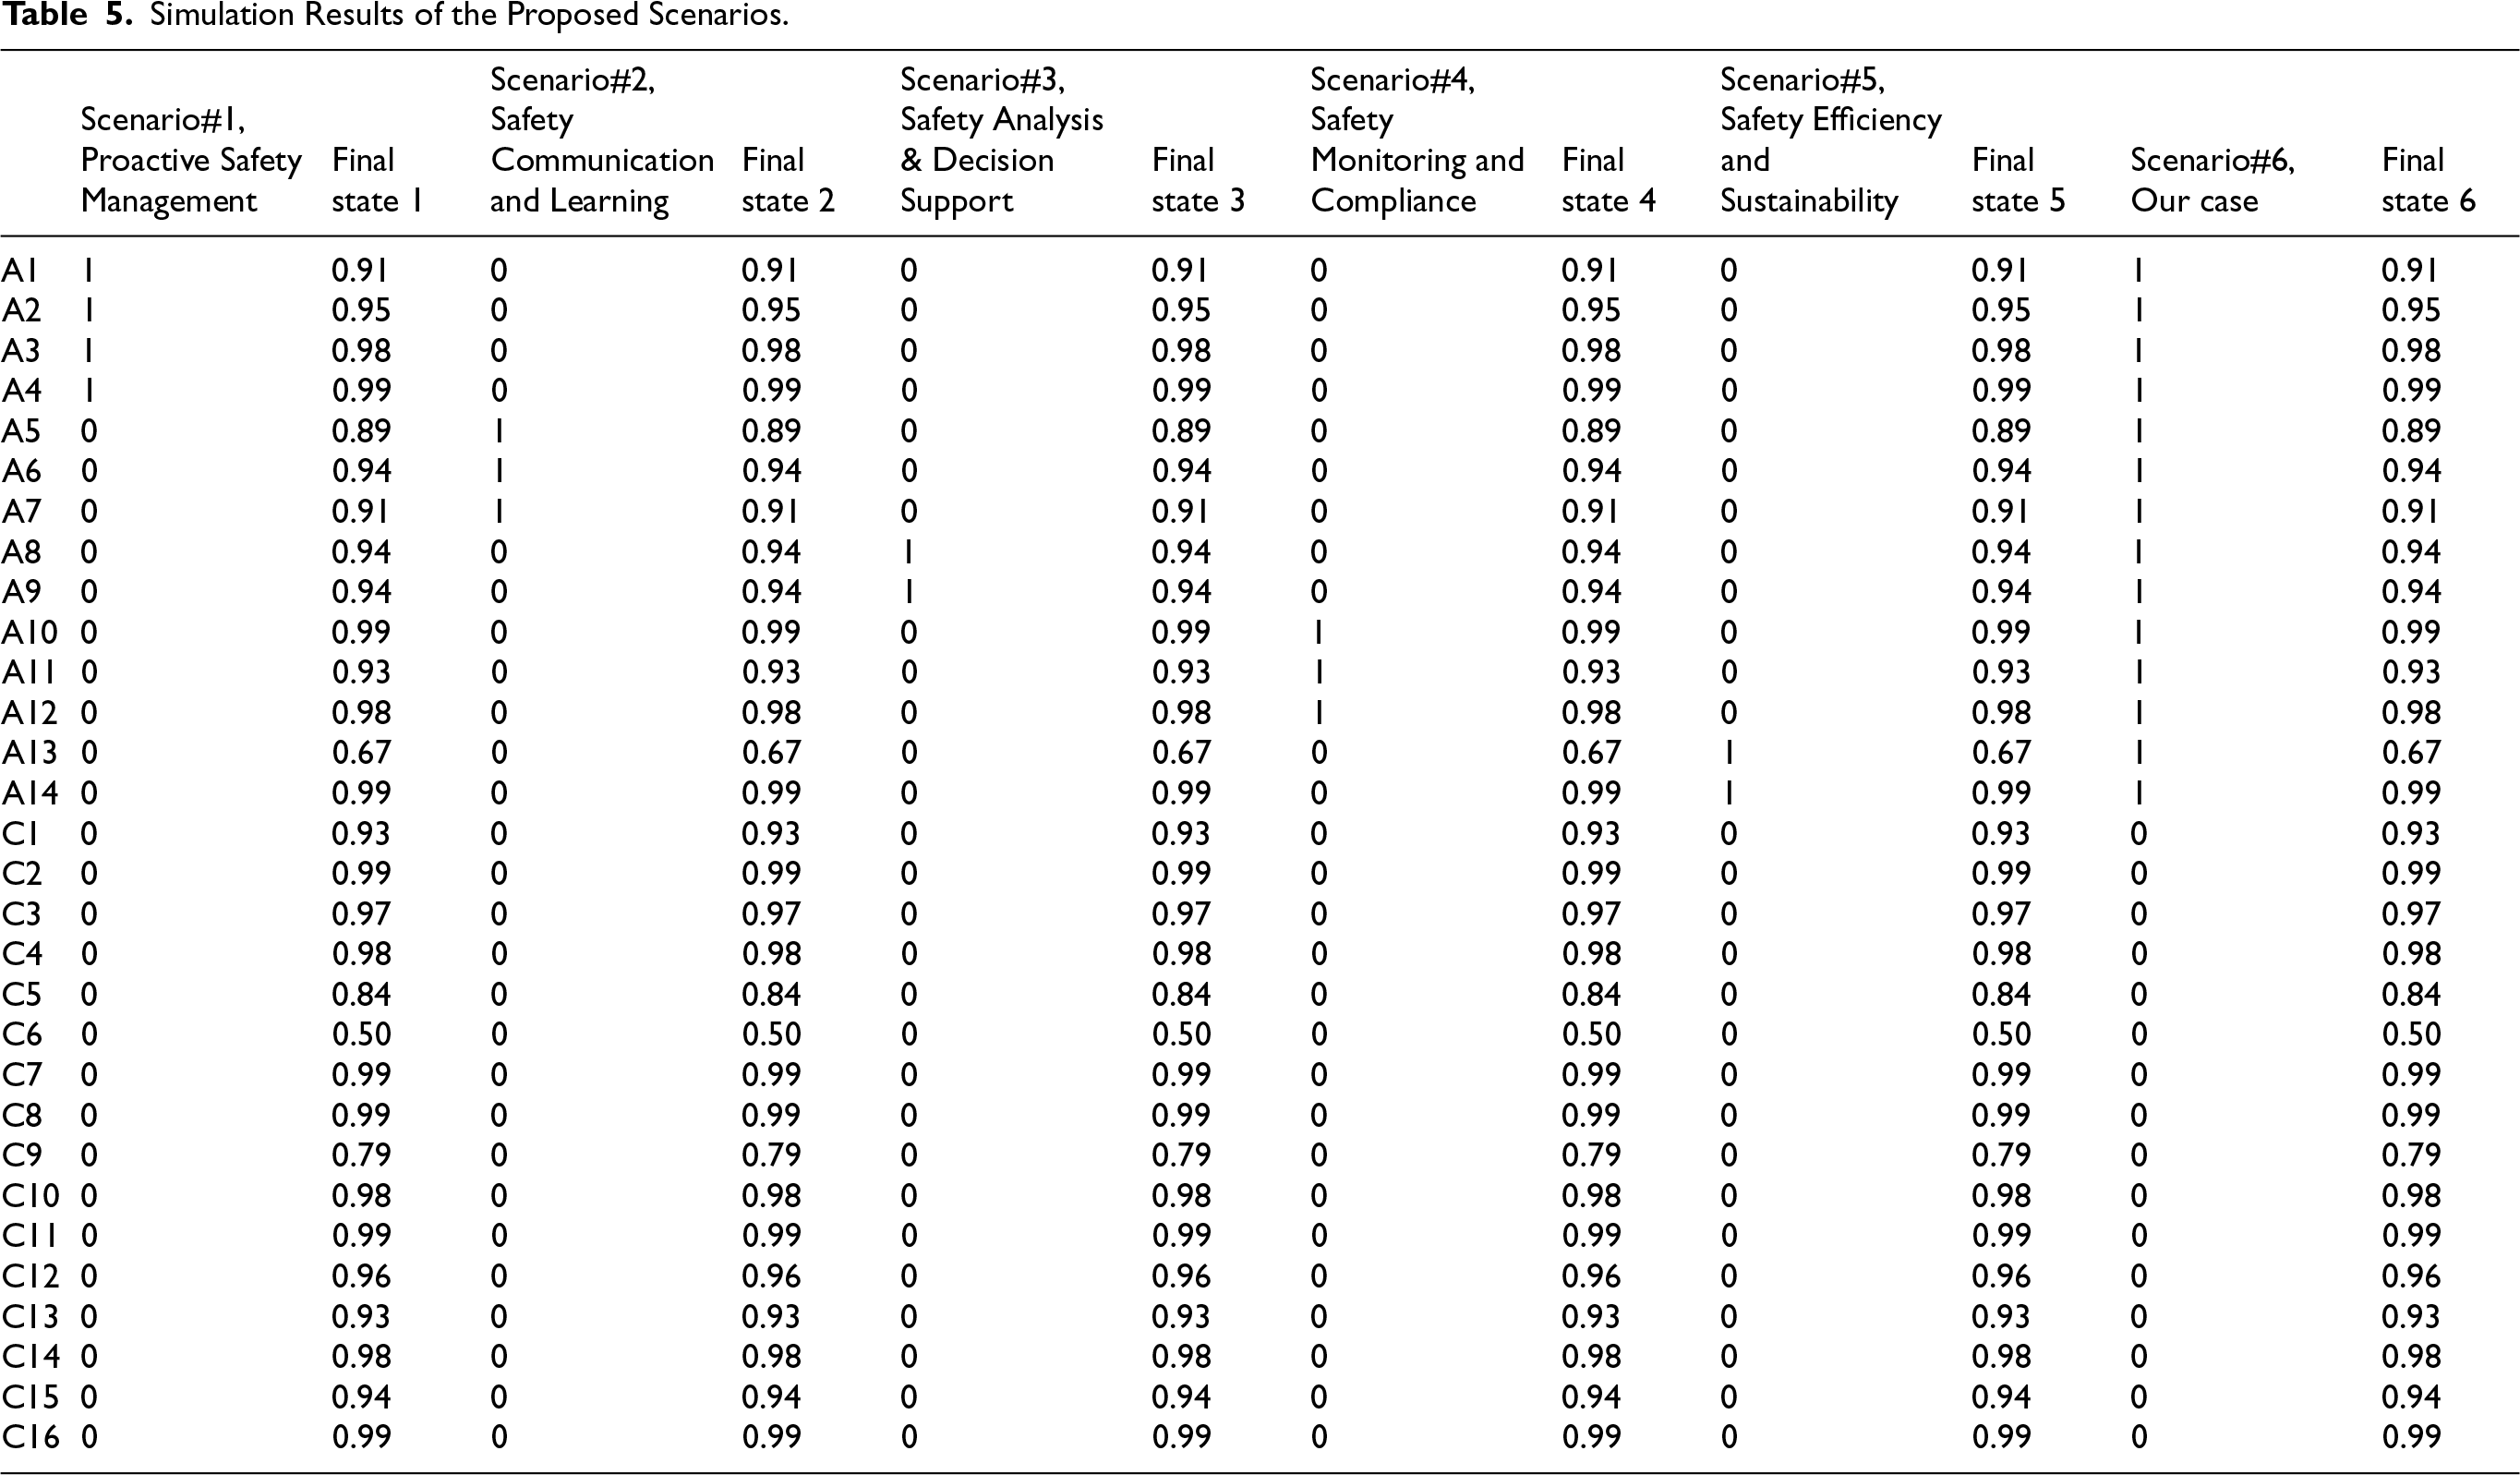
Simulation Results of the Proposed Scenarios.
The dynamic FCM simulation results in the Table 5, demonstrate differentiated impacts of BIM-IoT integration advantages on construction safety culture components across six scenarios, reflecting psychological, organizational, and behavioral dimensions. However, a critical examination reveals important limitations and constraints that must be explicitly addressed.
Scenario-Specific Analysis with Critical Limitations
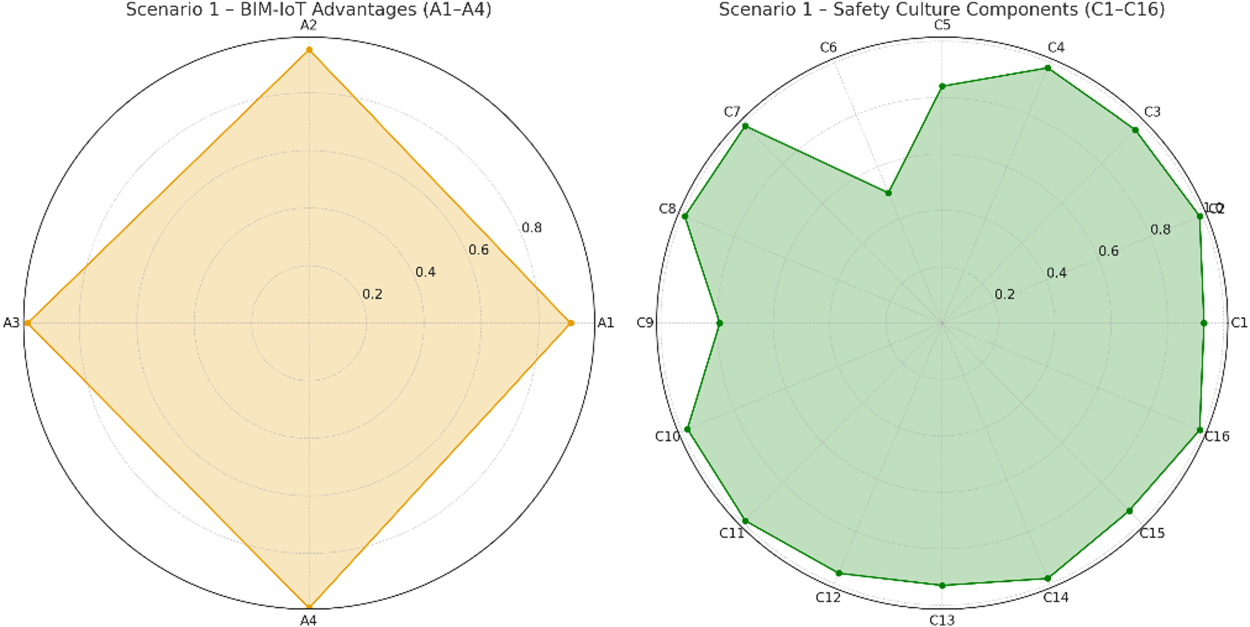
Radar charts under Scenario 1 (Proactive Safety Management): A3-A4 dominate, A1-A2 remain strong, most components high (≥0.93), but psychological aspects (C6, C5, C9) weaker.
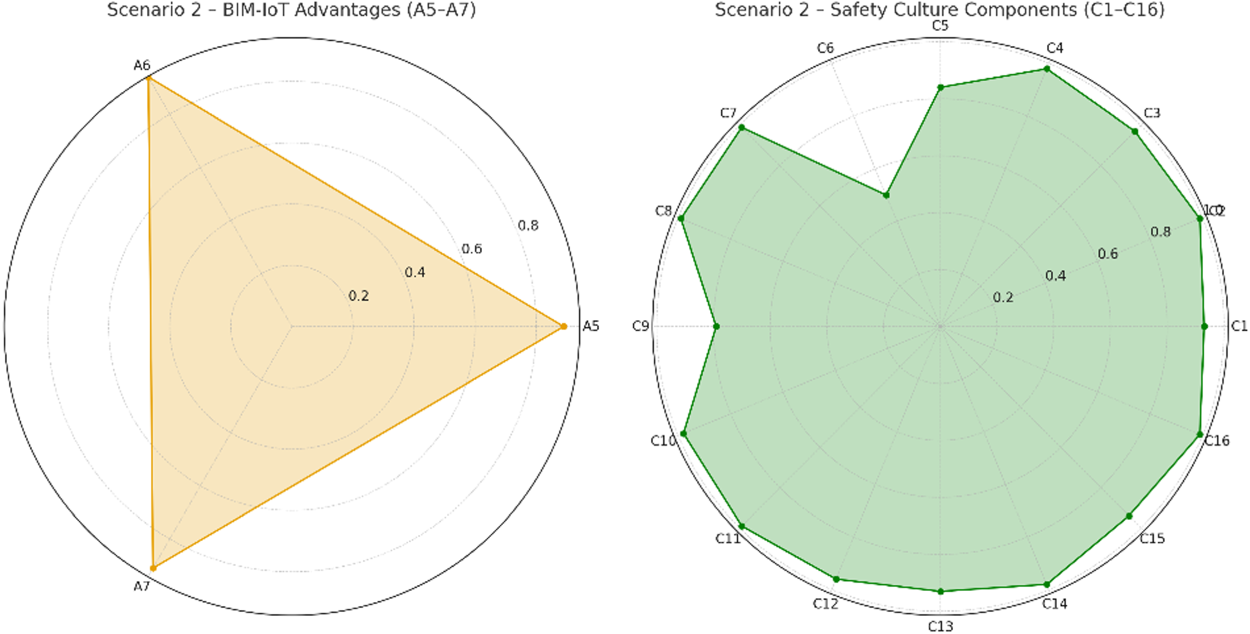
Radar chart for scenario 2 (safety communication and learning): A6 strongest, A7 moderate, A5 weaker; organizational and behavioral components strong, psychological aspects (C6, C5, C9) remain less responsive to technological interventions.

Radar chart for Scenario 3 (Safety Analysis & Decision Support): A8-A9 equally strong (0.94); overall outcomes high, psychological elements (C6, C5, C9) weaker.
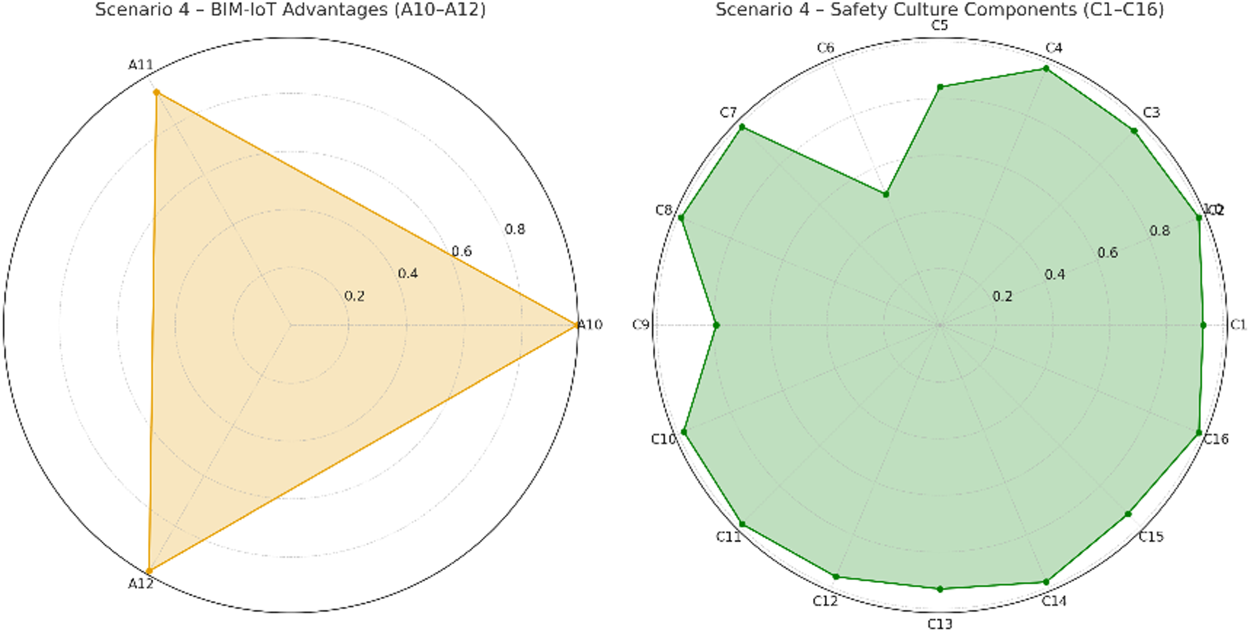
Radar chart for scenario 4 (safety monitoring & compliance): A10 and A12 near-maximum, A11 slightly lower; organizational and behavioral components strong, psychological elements (C6, C5, C9) weaker.
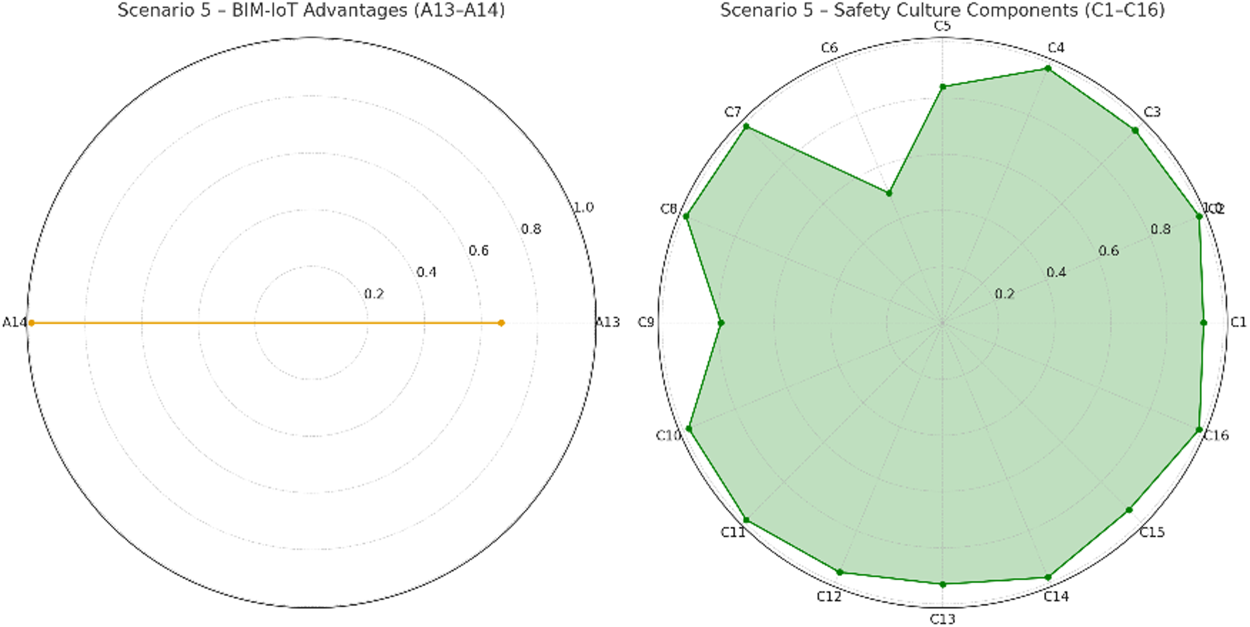
Radar chart for scenario 5 (safety efficiency & sustainability): A14 near-maximum, A13 weaker; organizational and behavioral components strong, psychological dimensions (C6, C5, C9) under-activated.
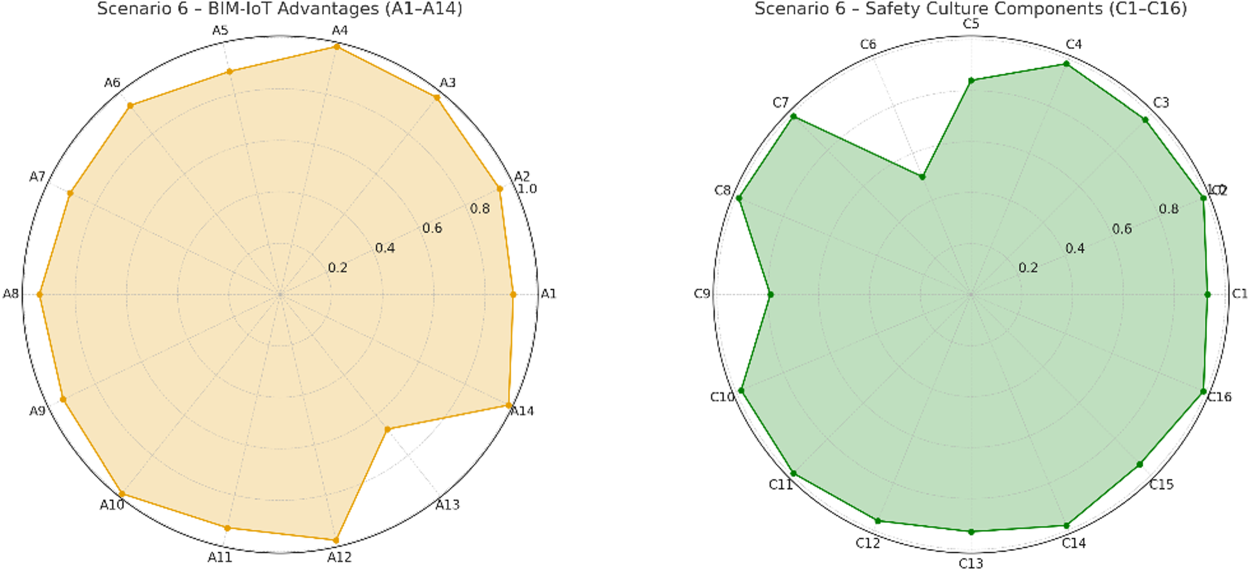
Radar chart for scenario 6 (combined expert-based): A4, A10, A12, A14 near-maximum, A13 weak; organizational and behavioral components strong, psychological elements (C6, C5, C9) less responsive.
Technology-Responsive vs. Human-Centered Component Analysis
The results demonstrate clear differentiation between technology-responsive components (C2, C3, C7, C8, C10-C12, C15-C16) showing high activation (0.93–0.99) and human-centered components requiring interpersonal interventions
Convergence Pattern Implications and Modeling Limitations
The identical final states across all scenarios reveal both strengths and concerning limitations in the modeling approach. While convergence indicates robust systemic reinforcement effects within the safety culture network, it also suggests that the FCM model may be oversimplifying complex organizational dynamics and contextual factors that create scenario-specific outcomes in real implementations. This convergence pattern implies that regardless of implementation approach, BIM-IoT integration drives the system toward a predetermined equilibrium state, potentially masking important differential effects, adaptation processes, and unintended consequences.
Strategic Implementation Framework with Critical Considerations
Based on comprehensive analysis incorporating both capabilities and limitations:
Personality-Based Strategies: Individual safety coaching, psychological profiling, and personalized behavioral modification programs Communication Enhancement: Structured peer mentoring, enhanced face-to-face protocols, and hybrid digital-physical meeting formats
This critical analysis reveals that while BIM-IoT integration offers substantial benefits for systematic and organizational aspects of safety culture, fundamental limitations exist in addressing human-centered psychological and social dimensions that remain essential for comprehensive safety culture transformation. Success requires explicit recognition of these constraints and integration of complementary human-centered strategies alongside technological interventions.
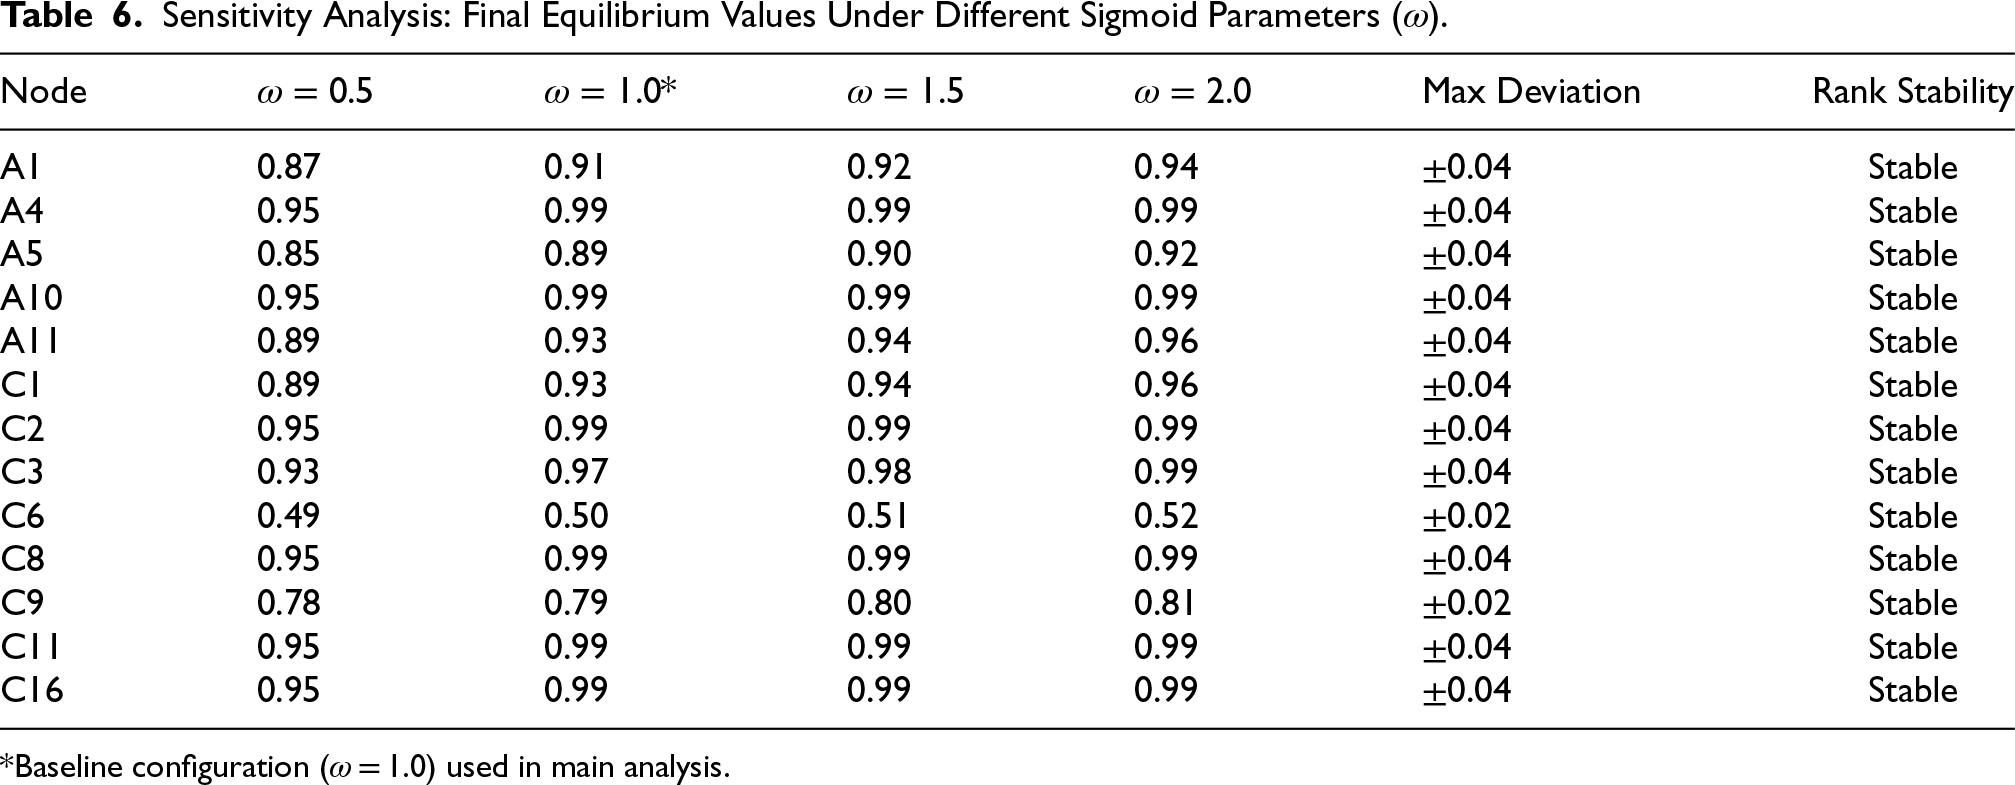
To establish the robustness of the FCM model results, a comprehensive sensitivity analysis was conducted by testing different values of the sigmoid parameter ω (0.5, 1.0, 1.5, 2.0) across all six scenarios, running each to convergence (ε = 0.001, max 100 iterations). Table 6 presents the quantitative results of this analysis for selected key concepts from Scenario 6 (Combined Expert-Based Scenario).
Sensitivity Analysis: Final Equilibrium Values Under Different Sigmoid Parameters (ω).
Sensitivity Analysis: Final Equilibrium Values Under Different Sigmoid Parameters (ω).
Baseline configuration (ω = 1.0) used in main analysis.
Key findings:
These quantitative results confirm the robustness of the model behavior and validate the ω = 1.0 selection for this application. The consistent ranking preservation across four-fold parameter variation (ω: 0.5→2.0) ensures that strategic recommendations derived from the FCM analysis are not artifacts of parameter selection.
This study applied an FCM-based dynamic model to systematically examine the impact of BIM and IoT integration on construction safety culture. Drawing upon scholarly literature, the model identified 14 core advantages of BIM-IoT integration and mapped their causal relationships with 16 critical components of safety culture. By employing both static and dynamic FCM analyses, the study captured the structural configuration and temporal evolution of the system under multiple implementation scenarios.
The findings demonstrate that advantages such as supporting compliance with safety regulations, facilitating real-time decision-making, and improving safety inspections exert the most significant direct influence on key components of construction safety culture. In contrast, other advantages- such as enhanced hazard identification, improved safety training effectiveness, hazard visualization, and injury or near-miss reporting- demonstrated strong indirect effects by amplifying their influence through complex causal pathways and reinforcing feedback loops within the safety culture system.
Dynamic scenario-based simulations revealed that targeted activation of BIM-IoT advantage clusters can substantially enhance key safety culture components, including regulatory compliance, hazard identification, safety readiness, and management commitment. However, the results also indicate that certain psychological and personality-related factors remain less influenced by technological interventions alone, underscoring the necessity of integrating behavioral and cultural strategies alongside digital innovations. The results underscore the necessity of adopting a holistic, multi-dimensional strategy that integrates technological, organizational, and behavioral interventions to achieve sustainable safety culture enhancement in construction projects.
Actionable Managerial Recommendations and Model Operationalization
The FCM model provides practical strategic guidance for industry implementation:
Overall, this research provides both theoretical insights and practical guidance for industry stakeholders seeking to prioritize and implement evidence-based BIM-IoT solutions for enhancing safety culture. The FCM model developed herein serves as a strategic tool for forecasting the outcomes of various intervention scenarios and supporting data-driven decision-making in construction safety culture transformation.
Future research should explore field validation of the model through longitudinal case studies, incorporate additional stakeholder perspectives, and extend the framework to evaluate interactions with broader organizational dimensions including safety climate, risk maturity, and digital readiness in large-scale and multicultural construction environments.
Footnotes
Funding
The authors disclosed receipt of the following financial support for the research, authorship, and/or publication of this article: This work was supported by the University of the Witwatersrand, Johannesburg.
Declaration of Conflicting Interests
The authors declared no potential conflicts of interest with respect to the research, authorship, and/or publication of this article.
Appendix I : The Interrelationships Among BIM-IoT Advantages (A-A)
| A1 | A2 | A3 | A4 | A5 | A6 | A7 | A8 | A9 | A10 | A11 | A12 | A13 | A14 | |
|---|---|---|---|---|---|---|---|---|---|---|---|---|---|---|
| A1 | 0.0 | 0.52 | 0.76 | 0.8 | 0.92 | 0.68 | 0.72 | 0.64 | 0.76 | 0.72 | 0.8 | 0.72 | 0.48 | 0.92 |
| A2 | 0.6 | 0.0 | 0.96 | 0.76 | 0.48 | 0.88 | 0.4 | 0.56 | 0.72 | 0.76 | 0.88 | 0.76 | 0.84 | 0.96 |
| A3 | 0.72 | 0.96 | 0.0 | 0.84 | 0.8 | 0.76 | 0.64 | 0.72 | 0.96 | 0.88 | 0.88 | 0.84 | 0.8 | 1.0 |
| A4 | 0.88 | 0.8 | 0.88 | 0.0 | 0.72 | 0.88 | 0.88 | 0.8 | 1.0 | 1.0 | 0.76 | 0.92 | 0.68 | 1.0 |
| A5 | 0.92 | 0.56 | 0.68 | 0.8 | 0.0 | 0.76 | 0.84 | 0.64 | 0.76 | 0.68 | 0.8 | 0.68 | 0.52 | 0.88 |
| A6 | 0.84 | 0.92 | 0.72 | 0.88 | 0.84 | 0.0 | 0.6 | 0.68 | 0.8 | 0.8 | 0.56 | 0.8 | 0.52 | 0.88 |
| A7 | 0.64 | 0.64 | 0.68 | 0.76 | 0.76 | 0.56 | 0.0 | 1.0 | 0.64 | 0.68 | 0.8 | 0.8 | 0.56 | 0.88 |
| A8 | 0.68 | 0.76 | 0.84 | 0.8 | 0.76 | 0.64 | 0.88 | 0.0 | 0.72 | 0.76 | 0.76 | 0.92 | 0.6 | 0.92 |
| A9 | 0.72 | 0.56 | 0.72 | 0.76 | 0.68 | 0.64 | 0.64 | 0.64 | 0.0 | 1.0 | 0.72 | 0.8 | 0.8 | 1.0 |
| A10 | 0.72 | 0.72 | 0.88 | 1.0 | 0.72 | 0.84 | 0.76 | 0.8 | 1.0 | 0.0 | 0.88 | 1.0 | 0.68 | 1.0 |
| A11 | 0.76 | 0.88 | 0.84 | 0.72 | 0.8 | 0.56 | 0.8 | 0.68 | 0.68 | 0.8 | 0.0 | 0.88 | 0.64 | 0.88 |
| A12 | 0.68 | 0.76 | 0.84 | 0.92 | 0.68 | 0.76 | 0.84 | 0.96 | 0.76 | 1.0 | 0.88 | 0.0 | 0.68 | 0.96 |
| A13 | 0.32 | 0.6 | 0.6 | 0.52 | 0.44 | 0.4 | 0.4 | 0.44 | 0.56 | 0.56 | 0.6 | 0.52 | 0.0 | 0.88 |
| A14 | 0.88 | 0.92 | 0.96 | 0.88 | 0.84 | 0.76 | 0.76 | 0.80 | 0.96 | 1.0 | 0.88 | 0.92 | 0.88 | 0.0 |
Appendix II: The Interrelationships from BIM-IoT Advantages to Components (A-C)
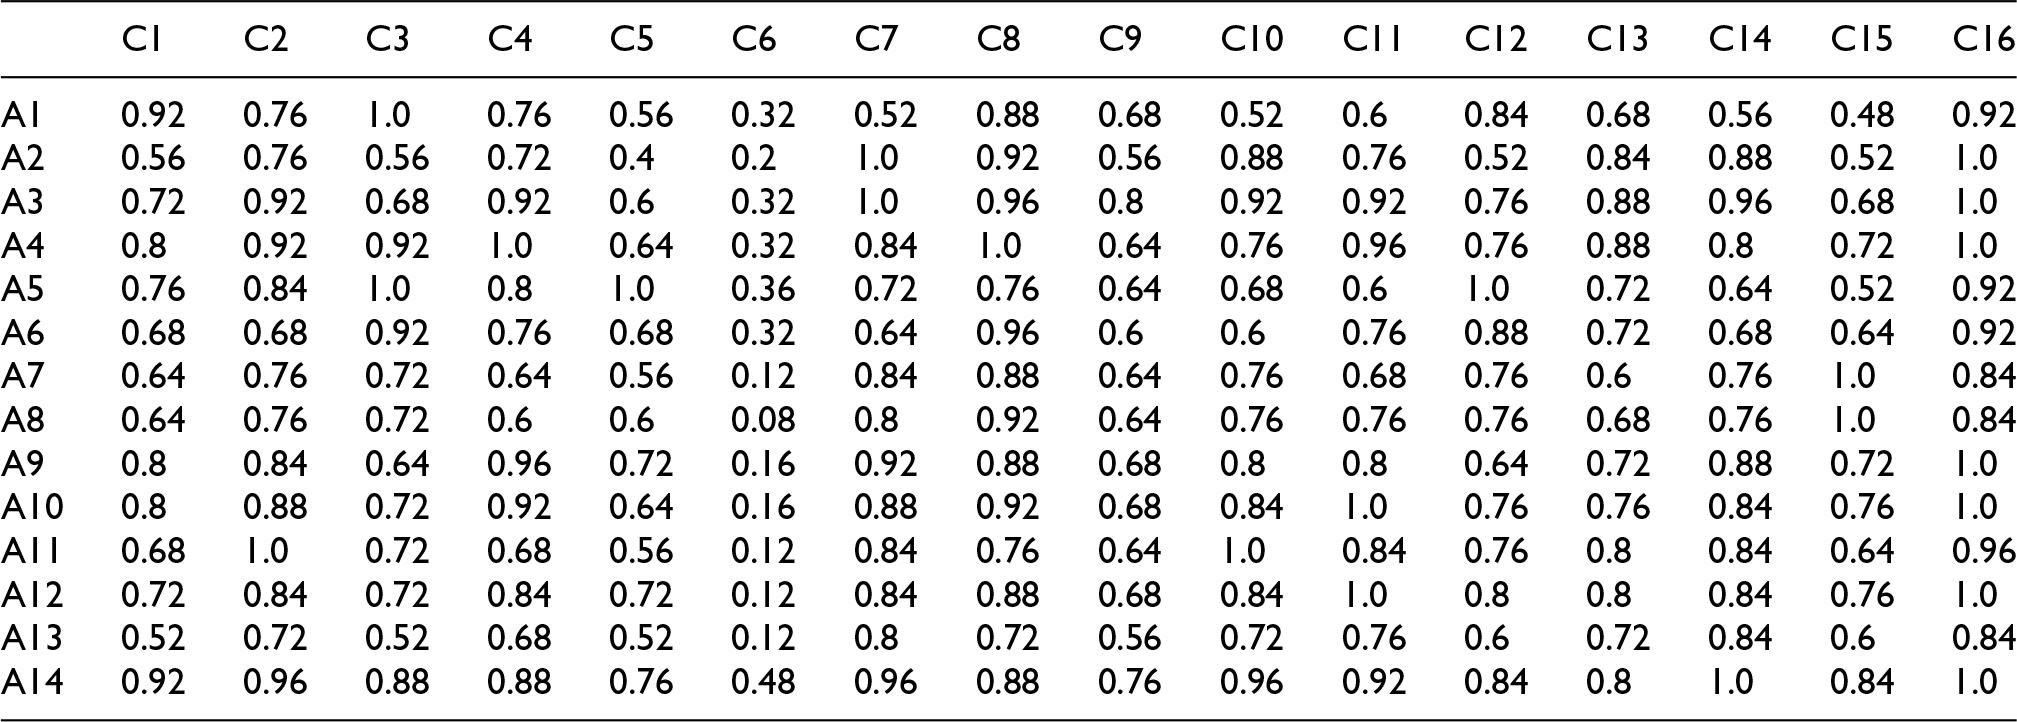
| C1 | C2 | C3 | C4 | C5 | C6 | C7 | C8 | C9 | C10 | C11 | C12 | C13 | C14 | C15 | C16 | |
|---|---|---|---|---|---|---|---|---|---|---|---|---|---|---|---|---|
| A1 | 0.92 | 0.76 | 1.0 | 0.76 | 0.56 | 0.32 | 0.52 | 0.88 | 0.68 | 0.52 | 0.6 | 0.84 | 0.68 | 0.56 | 0.48 | 0.92 |
| A2 | 0.56 | 0.76 | 0.56 | 0.72 | 0.4 | 0.2 | 1.0 | 0.92 | 0.56 | 0.88 | 0.76 | 0.52 | 0.84 | 0.88 | 0.52 | 1.0 |
| A3 | 0.72 | 0.92 | 0.68 | 0.92 | 0.6 | 0.32 | 1.0 | 0.96 | 0.8 | 0.92 | 0.92 | 0.76 | 0.88 | 0.96 | 0.68 | 1.0 |
| A4 | 0.8 | 0.92 | 0.92 | 1.0 | 0.64 | 0.32 | 0.84 | 1.0 | 0.64 | 0.76 | 0.96 | 0.76 | 0.88 | 0.8 | 0.72 | 1.0 |
| A5 | 0.76 | 0.84 | 1.0 | 0.8 | 1.0 | 0.36 | 0.72 | 0.76 | 0.64 | 0.68 | 0.6 | 1.0 | 0.72 | 0.64 | 0.52 | 0.92 |
| A6 | 0.68 | 0.68 | 0.92 | 0.76 | 0.68 | 0.32 | 0.64 | 0.96 | 0.6 | 0.6 | 0.76 | 0.88 | 0.72 | 0.68 | 0.64 | 0.92 |
| A7 | 0.64 | 0.76 | 0.72 | 0.64 | 0.56 | 0.12 | 0.84 | 0.88 | 0.64 | 0.76 | 0.68 | 0.76 | 0.6 | 0.76 | 1.0 | 0.84 |
| A8 | 0.64 | 0.76 | 0.72 | 0.6 | 0.6 | 0.08 | 0.8 | 0.92 | 0.64 | 0.76 | 0.76 | 0.76 | 0.68 | 0.76 | 1.0 | 0.84 |
| A9 | 0.8 | 0.84 | 0.64 | 0.96 | 0.72 | 0.16 | 0.92 | 0.88 | 0.68 | 0.8 | 0.8 | 0.64 | 0.72 | 0.88 | 0.72 | 1.0 |
| A10 | 0.8 | 0.88 | 0.72 | 0.92 | 0.64 | 0.16 | 0.88 | 0.92 | 0.68 | 0.84 | 1.0 | 0.76 | 0.76 | 0.84 | 0.76 | 1.0 |
| A11 | 0.68 | 1.0 | 0.72 | 0.68 | 0.56 | 0.12 | 0.84 | 0.76 | 0.64 | 1.0 | 0.84 | 0.76 | 0.8 | 0.84 | 0.64 | 0.96 |
| A12 | 0.72 | 0.84 | 0.72 | 0.84 | 0.72 | 0.12 | 0.84 | 0.88 | 0.68 | 0.84 | 1.0 | 0.8 | 0.8 | 0.84 | 0.76 | 1.0 |
| A13 | 0.52 | 0.72 | 0.52 | 0.68 | 0.52 | 0.12 | 0.8 | 0.72 | 0.56 | 0.72 | 0.76 | 0.6 | 0.72 | 0.84 | 0.6 | 0.84 |
| A14 | 0.92 | 0.96 | 0.88 | 0.88 | 0.76 | 0.48 | 0.96 | 0.88 | 0.76 | 0.96 | 0.92 | 0.84 | 0.8 | 1.0 | 0.84 | 1.0 |
Appendix III : The Interrelationships Among Safety Culture Components (C-C)
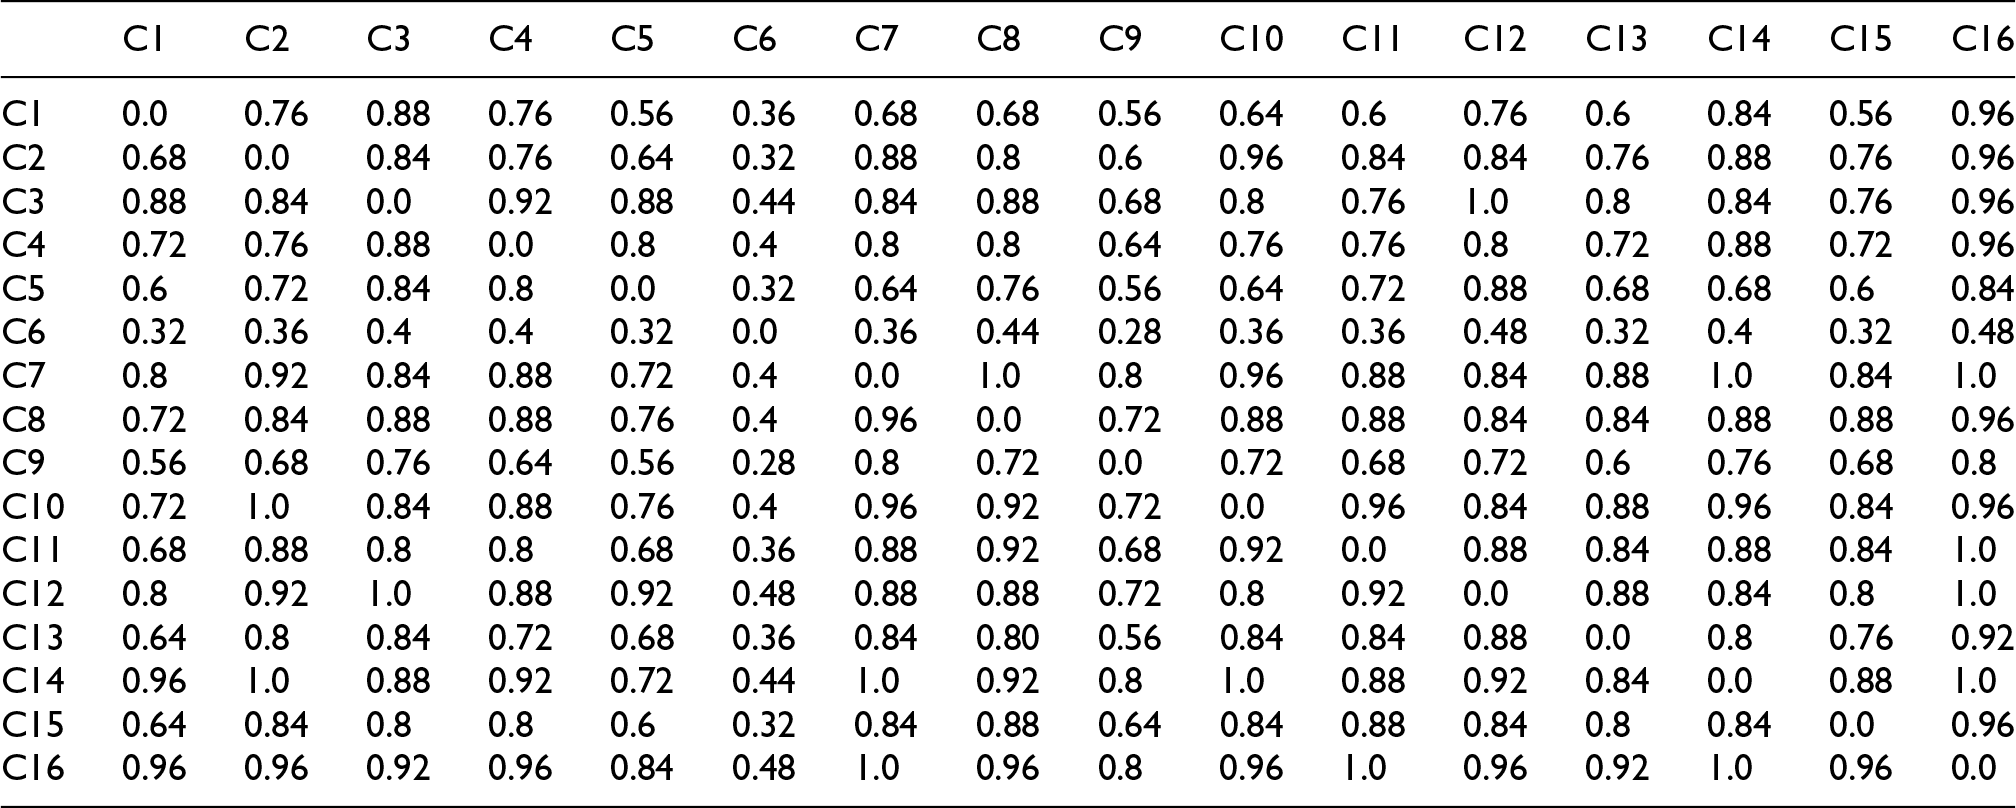
| C1 | C2 | C3 | C4 | C5 | C6 | C7 | C8 | C9 | C10 | C11 | C12 | C13 | C14 | C15 | C16 | |
|---|---|---|---|---|---|---|---|---|---|---|---|---|---|---|---|---|
| C1 | 0.0 | 0.76 | 0.88 | 0.76 | 0.56 | 0.36 | 0.68 | 0.68 | 0.56 | 0.64 | 0.6 | 0.76 | 0.6 | 0.84 | 0.56 | 0.96 |
| C2 | 0.68 | 0.0 | 0.84 | 0.76 | 0.64 | 0.32 | 0.88 | 0.8 | 0.6 | 0.96 | 0.84 | 0.84 | 0.76 | 0.88 | 0.76 | 0.96 |
| C3 | 0.88 | 0.84 | 0.0 | 0.92 | 0.88 | 0.44 | 0.84 | 0.88 | 0.68 | 0.8 | 0.76 | 1.0 | 0.8 | 0.84 | 0.76 | 0.96 |
| C4 | 0.72 | 0.76 | 0.88 | 0.0 | 0.8 | 0.4 | 0.8 | 0.8 | 0.64 | 0.76 | 0.76 | 0.8 | 0.72 | 0.88 | 0.72 | 0.96 |
| C5 | 0.6 | 0.72 | 0.84 | 0.8 | 0.0 | 0.32 | 0.64 | 0.76 | 0.56 | 0.64 | 0.72 | 0.88 | 0.68 | 0.68 | 0.6 | 0.84 |
| C6 | 0.32 | 0.36 | 0.4 | 0.4 | 0.32 | 0.0 | 0.36 | 0.44 | 0.28 | 0.36 | 0.36 | 0.48 | 0.32 | 0.4 | 0.32 | 0.48 |
| C7 | 0.8 | 0.92 | 0.84 | 0.88 | 0.72 | 0.4 | 0.0 | 1.0 | 0.8 | 0.96 | 0.88 | 0.84 | 0.88 | 1.0 | 0.84 | 1.0 |
| C8 | 0.72 | 0.84 | 0.88 | 0.88 | 0.76 | 0.4 | 0.96 | 0.0 | 0.72 | 0.88 | 0.88 | 0.84 | 0.84 | 0.88 | 0.88 | 0.96 |
| C9 | 0.56 | 0.68 | 0.76 | 0.64 | 0.56 | 0.28 | 0.8 | 0.72 | 0.0 | 0.72 | 0.68 | 0.72 | 0.6 | 0.76 | 0.68 | 0.8 |
| C10 | 0.72 | 1.0 | 0.84 | 0.88 | 0.76 | 0.4 | 0.96 | 0.92 | 0.72 | 0.0 | 0.96 | 0.84 | 0.88 | 0.96 | 0.84 | 0.96 |
| C11 | 0.68 | 0.88 | 0.8 | 0.8 | 0.68 | 0.36 | 0.88 | 0.92 | 0.68 | 0.92 | 0.0 | 0.88 | 0.84 | 0.88 | 0.84 | 1.0 |
| C12 | 0.8 | 0.92 | 1.0 | 0.88 | 0.92 | 0.48 | 0.88 | 0.88 | 0.72 | 0.8 | 0.92 | 0.0 | 0.88 | 0.84 | 0.8 | 1.0 |
| C13 | 0.64 | 0.8 | 0.84 | 0.72 | 0.68 | 0.36 | 0.84 | 0.80 | 0.56 | 0.84 | 0.84 | 0.88 | 0.0 | 0.8 | 0.76 | 0.92 |
| C14 | 0.96 | 1.0 | 0.88 | 0.92 | 0.72 | 0.44 | 1.0 | 0.92 | 0.8 | 1.0 | 0.88 | 0.92 | 0.84 | 0.0 | 0.88 | 1.0 |
| C15 | 0.64 | 0.84 | 0.8 | 0.8 | 0.6 | 0.32 | 0.84 | 0.88 | 0.64 | 0.84 | 0.88 | 0.84 | 0.8 | 0.84 | 0.0 | 0.96 |
| C16 | 0.96 | 0.96 | 0.92 | 0.96 | 0.84 | 0.48 | 1.0 | 0.96 | 0.8 | 0.96 | 1.0 | 0.96 | 0.92 | 1.0 | 0.96 | 0.0 |
Appendix IV: Calculation Methodology for Table 4 Indirect Effects
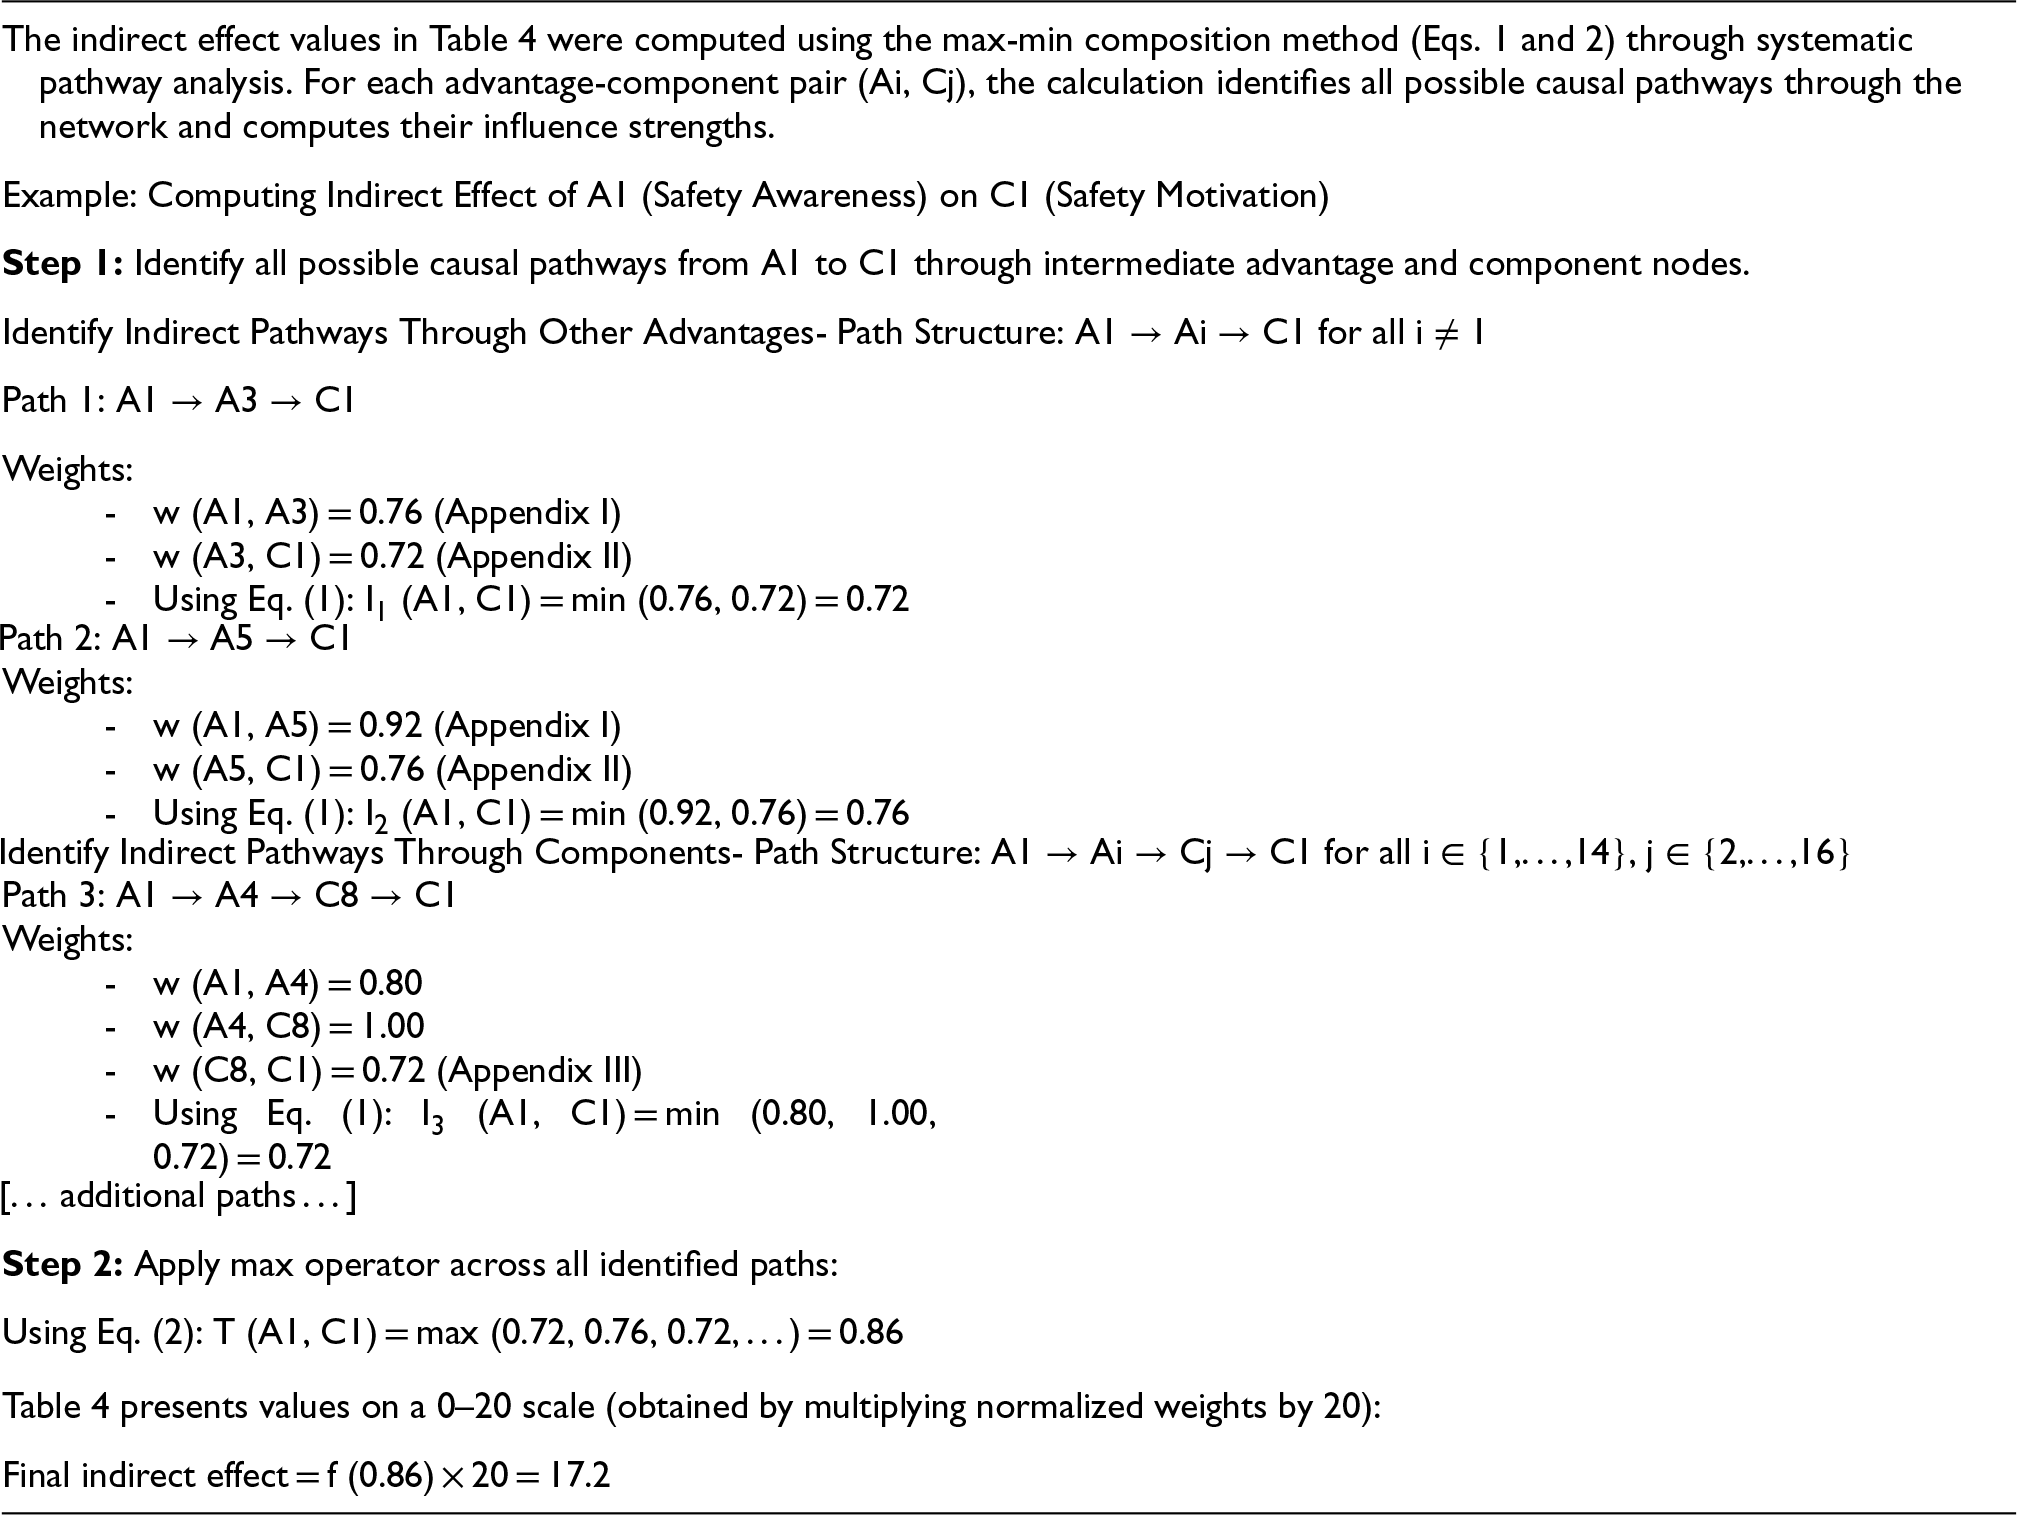
| The indirect effect values in Table 4 were computed using the max-min composition method (Eqs. 1 and 2) through systematic pathway analysis. For each advantage-component pair (Ai, Cj), the calculation identifies all possible causal pathways through the network and computes their influence strengths. |
| Example: Computing Indirect Effect of A1 (Safety Awareness) on C1 (Safety Motivation) |
| Identify Indirect Pathways Through Other Advantages- Path Structure: A1 → Ai → C1 for all i ≠ 1 |
| Path 1: A1 → A3 → C1 |
| Weights:
w (A1, A3) = 0.76 (Appendix I) w (A3, C1) = 0.72 (Appendix II) Using Eq. (1): I1 (A1, C1) = min (0.76, 0.72) = 0.72 |
| Weights:
w (A1, A5) = 0.92 (Appendix I) w (A5, C1) = 0.76 (Appendix II) Using Eq. (1): I2 (A1, C1) = min (0.92, 0.76) = 0.76 |
| Path 3: A1 → A4 → C8 → C1 |
| Weights:
w (A1, A4) = 0.80 w (A4, C8) = 1.00 w (C8, C1) = 0.72 (Appendix III) Using Eq. (1): I3 (A1, C1) = min (0.80, 1.00, 0.72) = 0.72 |
| Using Eq. (2): T (A1, C1) = max (0.72, 0.76, 0.72, …) = 0.86 |
| Table 4 presents values on a 0–20 scale (obtained by multiplying normalized weights by 20): |
| Final indirect effect = f (0.86) × 20 = 17.2 |