
Abstract
Background
Lung cancer remains a leading cause of cancer-related mortality, with accurate staging essential for guiding treatment. Advances in next-generation sequencing (NGS) and machine learning (ML) enable more precise classification, improving on traditional imaging-based methods.
Objective
This retrospective study applies XGBoost with cross-validation (CV) to classify early vs. late-stage lung cancer using RNA-Seq data from 993 patients in The Cancer Genome Atlas (TCGA) cohort.
Methods
Gene selection was conducted using the Wilcoxon rank-sum test on training data, and the XGBoost model was optimized via cross-validation. Model performance was assessed using the Area Under the Curve (AUC), with sensitivity-specificity analysis across classification thresholds.
Results
The XGBoost model achieved a test AUC of 0.6534, identifying 40 key genes that optimize predictive accuracy while minimizing overfitting. Thresholds of 0.3 and 0.4 were optimal, balancing sensitivity and specificity for clinical application
Conclusions
Integrating RNA-Seq data with machine learning improves lung cancer staging accuracy. Future research should focus on dataset expansion, model benchmarking, and multi-omics integration to enhance clinical applicability.
Introduction
Lung cancer staging plays a critical role in prognosis and treatment selection. Traditional staging methods incorporate imaging techniques such as computed tomography (CT) and positron emission tomography (PET), alongside invasive techniques including mediastinoscopy and endobronchial ultrasound-guided transbronchial needle aspiration (EBUS-TBNA).1,2 While these techniques provide valuable information, they exhibit limitations. For instance, CT imaging has a sensitivity of approximately 55% for mediastinal metastasis, 3 whereas PET-CT improves this to 77% but remains imperfect.4,5 Invasive staging techniques like mediastinoscopy offer greater accuracy but are not always feasible due to patient-specific contraindications. 6
The application of machine learning (ML) in oncology has introduced promising alternatives to conventional methods. ML-based models utilize large-scale genomic and transcriptomic data to improve classification accuracy, reduce subjectivity, and enhance reproducibility in clinical decision-making. Gene expression-based models, including those leveraging support vector machines (SVM) and artificial neural networks (ANN), have shown potential in lung cancer classification. 7 However, existing ML approaches often lack interpretability, require extensive feature engineering, or struggle with class imbalance.
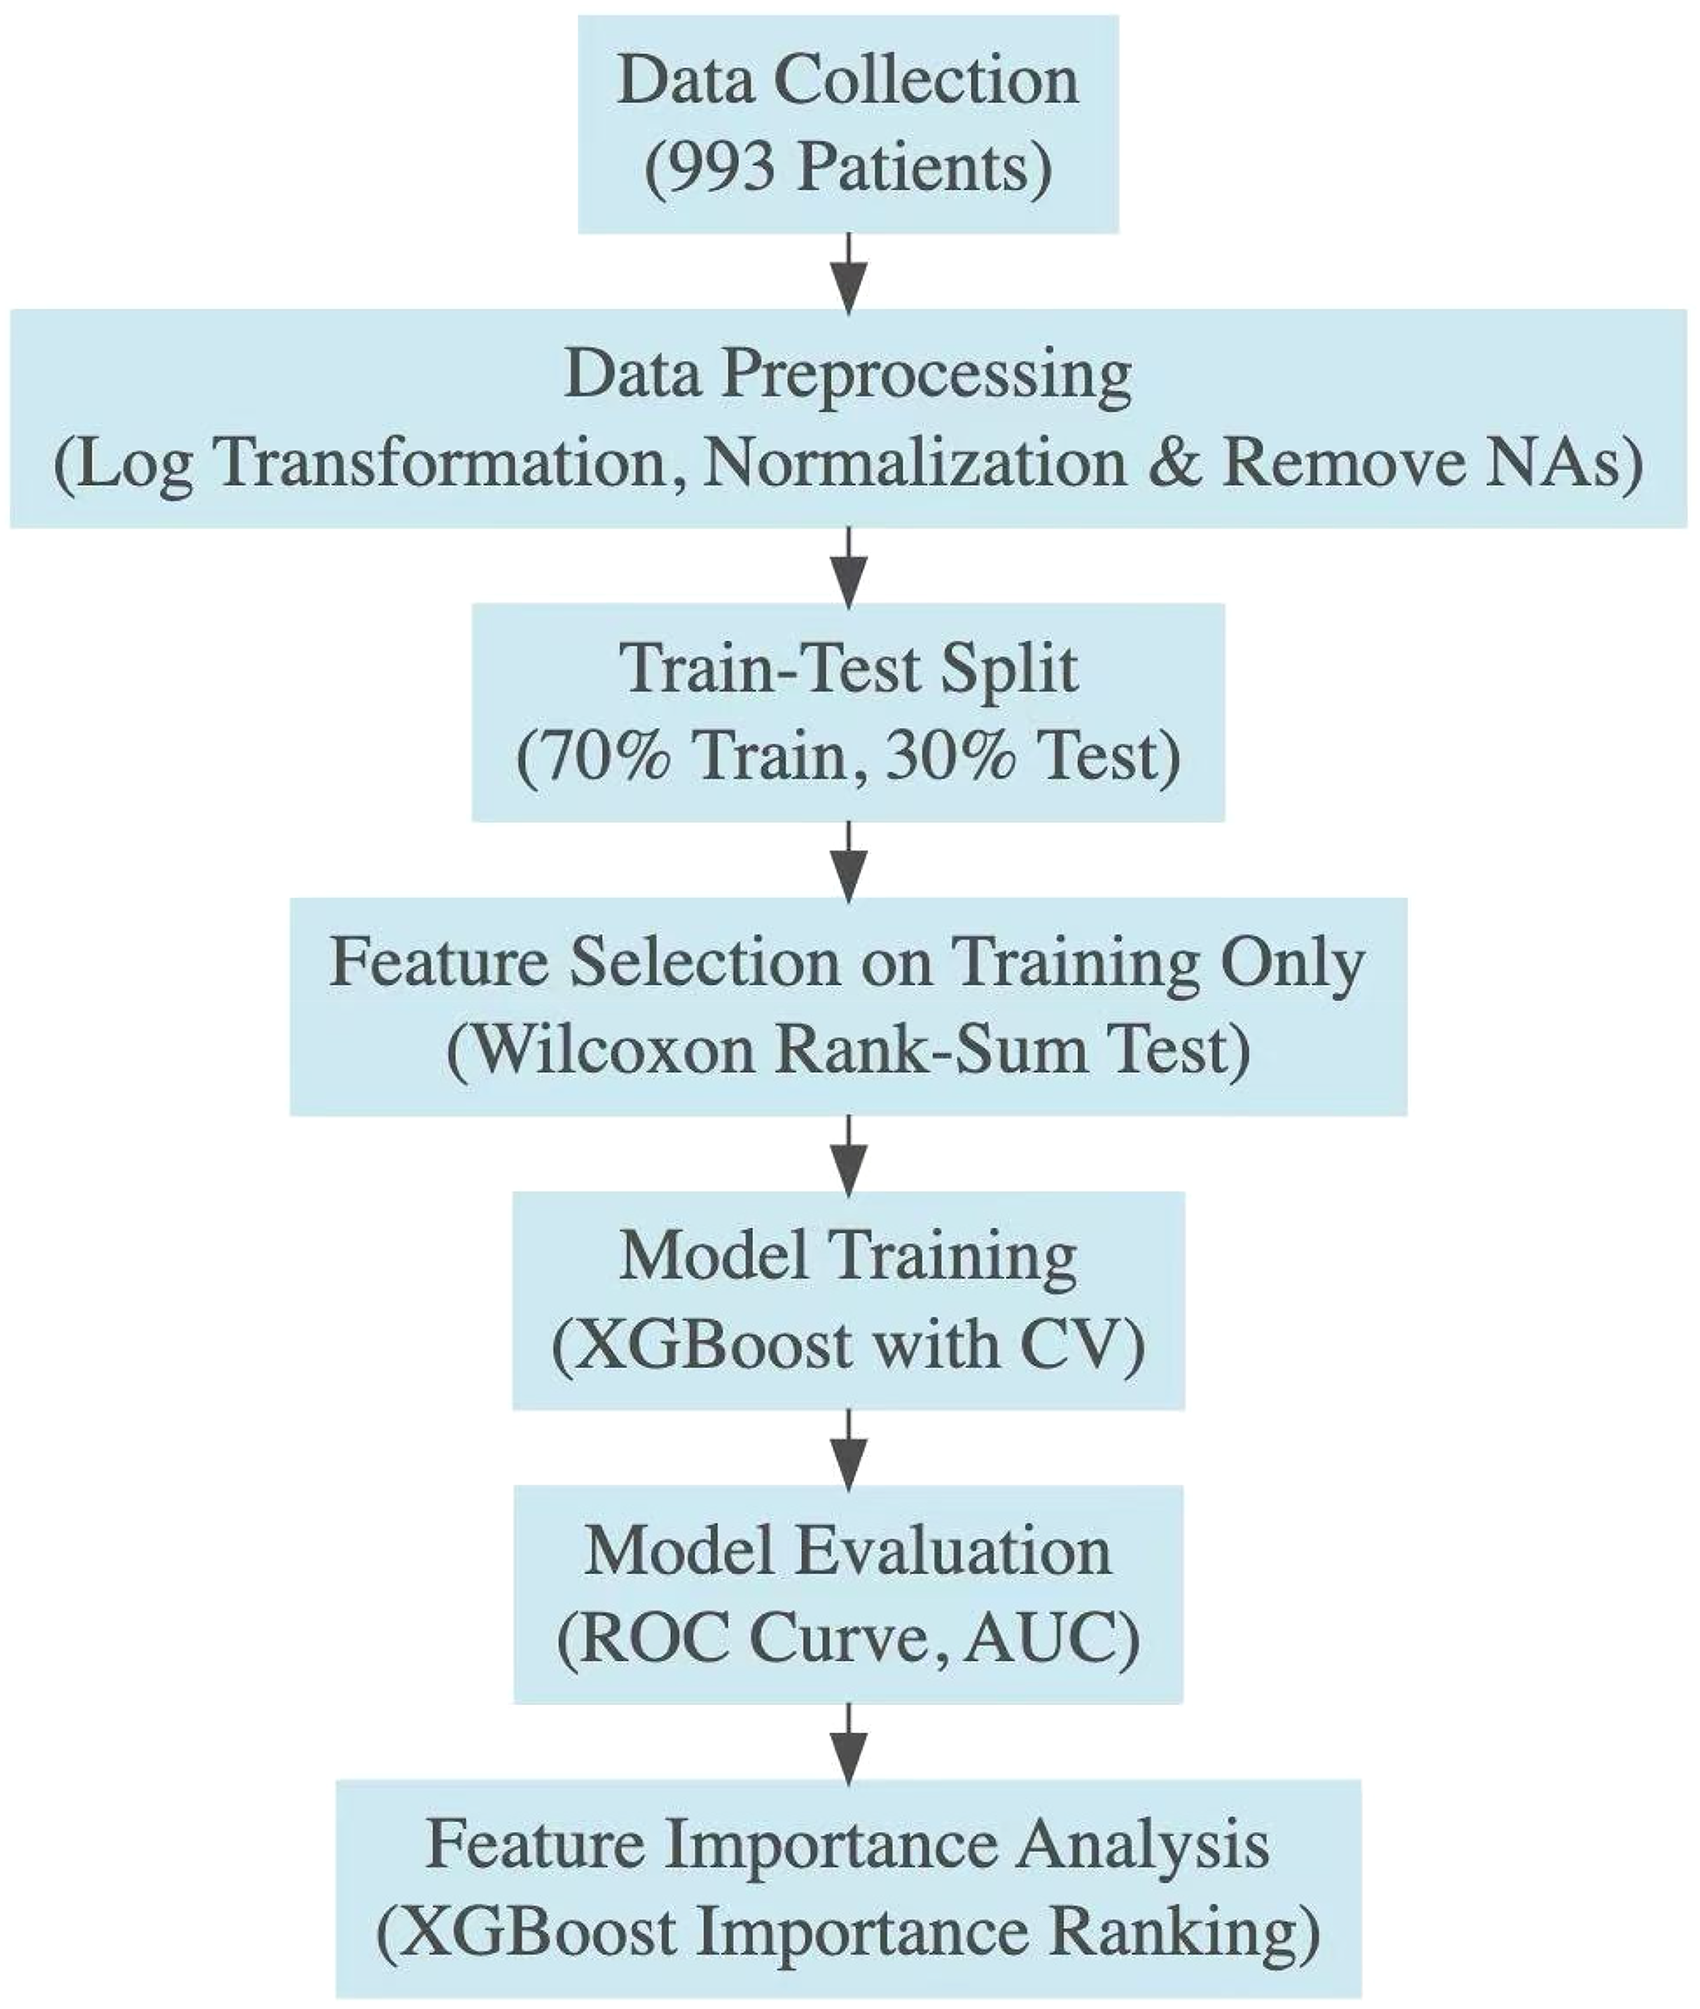
Schematic diagram illustrating the methodological steps implemented in this study. The process begins with data collection from 993 patients, followed by data preprocessing which includes log transformation, normalization, and removing missing data of the RNA-Seq data (961 patients). The data is split into training (70%) and testing (30%) sets. Feature selection is then performed using the Wilcoxon rank-sum test to the training dataset only to identify the most significant genes. Model training is conducted using the XGBoost algorithm with cross-validation (CV) to ensure robustness. The model is evaluated based on the ROC curve and AUC metrics. Feature importance analysis is performed to assess the contribution of individual genes and downstream analyses are conducted to explore the broader biological relevance of the selected genes.
This study addresses these limitations by applying XGBoost, an optimized gradient boosting framework, to gene expression data for lung cancer stage classification. XGBoost was selected over alternative boosting algorithms such as LightGBM and CatBoost due to its superior performance in handling structured biomedical data, its efficiency in parameter tuning, and its demonstrated high accuracy in lung cancer classification tasks. 7 The findings of this study contribute to the growing body of research on ML applications in oncology and demonstrate the potential of gene expression-based models for improving lung cancer staging accuracy.
The objective of this study is to develop and evaluate an XGBoost model trained on gene expression data to classify lung cancer stages. By leveraging retrospective data from 993 patients in The Cancer Genome Atlas (TCGA) cohort, we assess the model's performance relative to existing methodologies. Our findings suggest that this approach yields an interpretable classifier with moderate predictive performance, highlighting its potential as a complementary tool to existing clinical staging methods (Figure 1).
Materials and methods
Study design
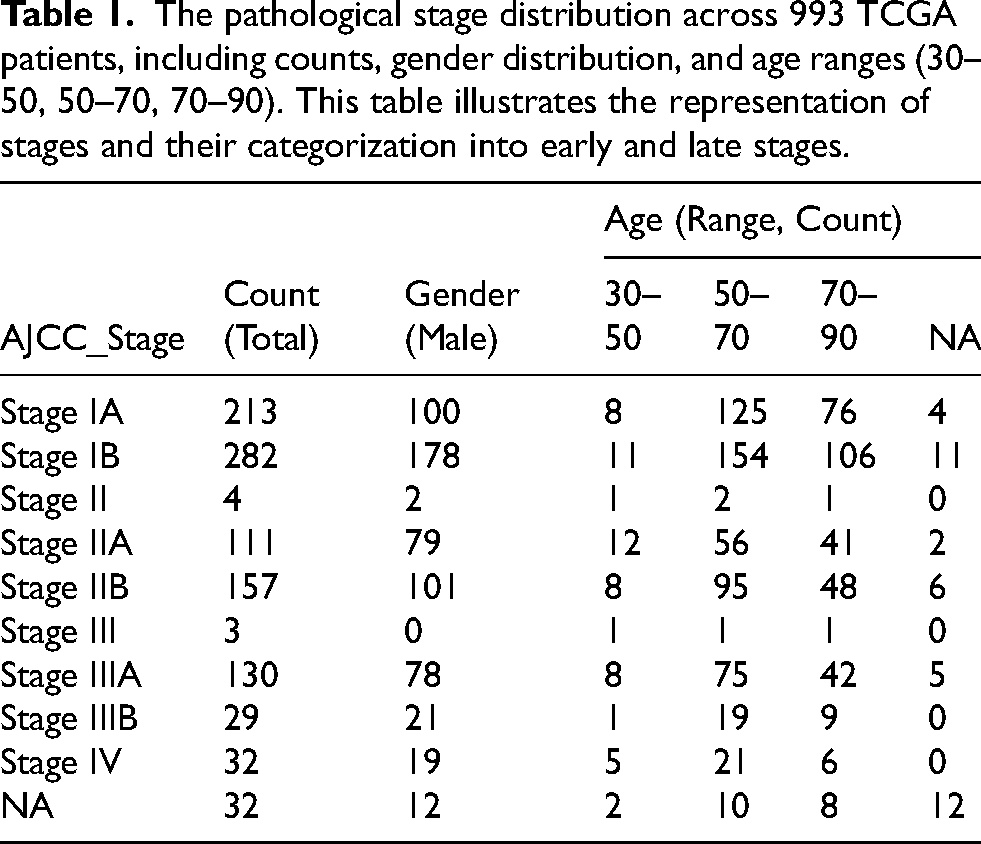
This study employed a retrospective design to analyze a cohort of 993 patients from The Cancer Genome Atlas (TCGA), specifically the TCGA-LUAD (Lung Adenocarcinoma) and TCGA-LUSC (Lung Squamous Cell Carcinoma) datasets. Patient tumor samples analyzed in this study were originally collected from the late 2000s through 2013, as part of the TCGA-LUAD and TCGA-LUSC projects. These datasets were integrated to enable a pan-lung cancer analysis, leveraging comprehensive molecular profiling studies.8,9 Inclusion criteria required patients to have confirmed diagnoses of untreated LUAD or LUSC, tumor purity ≥60%, necrosis ≤20%, RNA integrity numbers (RIN) ≥ 7, and sufficient nucleic acid yield for molecular analysis. Exclusion criteria included cases with low tumor purity, discordant tumor/normal genotypes, or technical artifacts. The distribution of AJCC pathological stages is summarized in Table 1 and Figure 2, where stages were further categorized into early (IA, IB, II, IIA, IIB) and late (III, IIIA, IIIB, IV) stages to facilitate binary classification. The initial cohort consisted of 993 patients; however, 32 patients with incomplete staging information were excluded, resulting in a final study cohort of 961 patients.
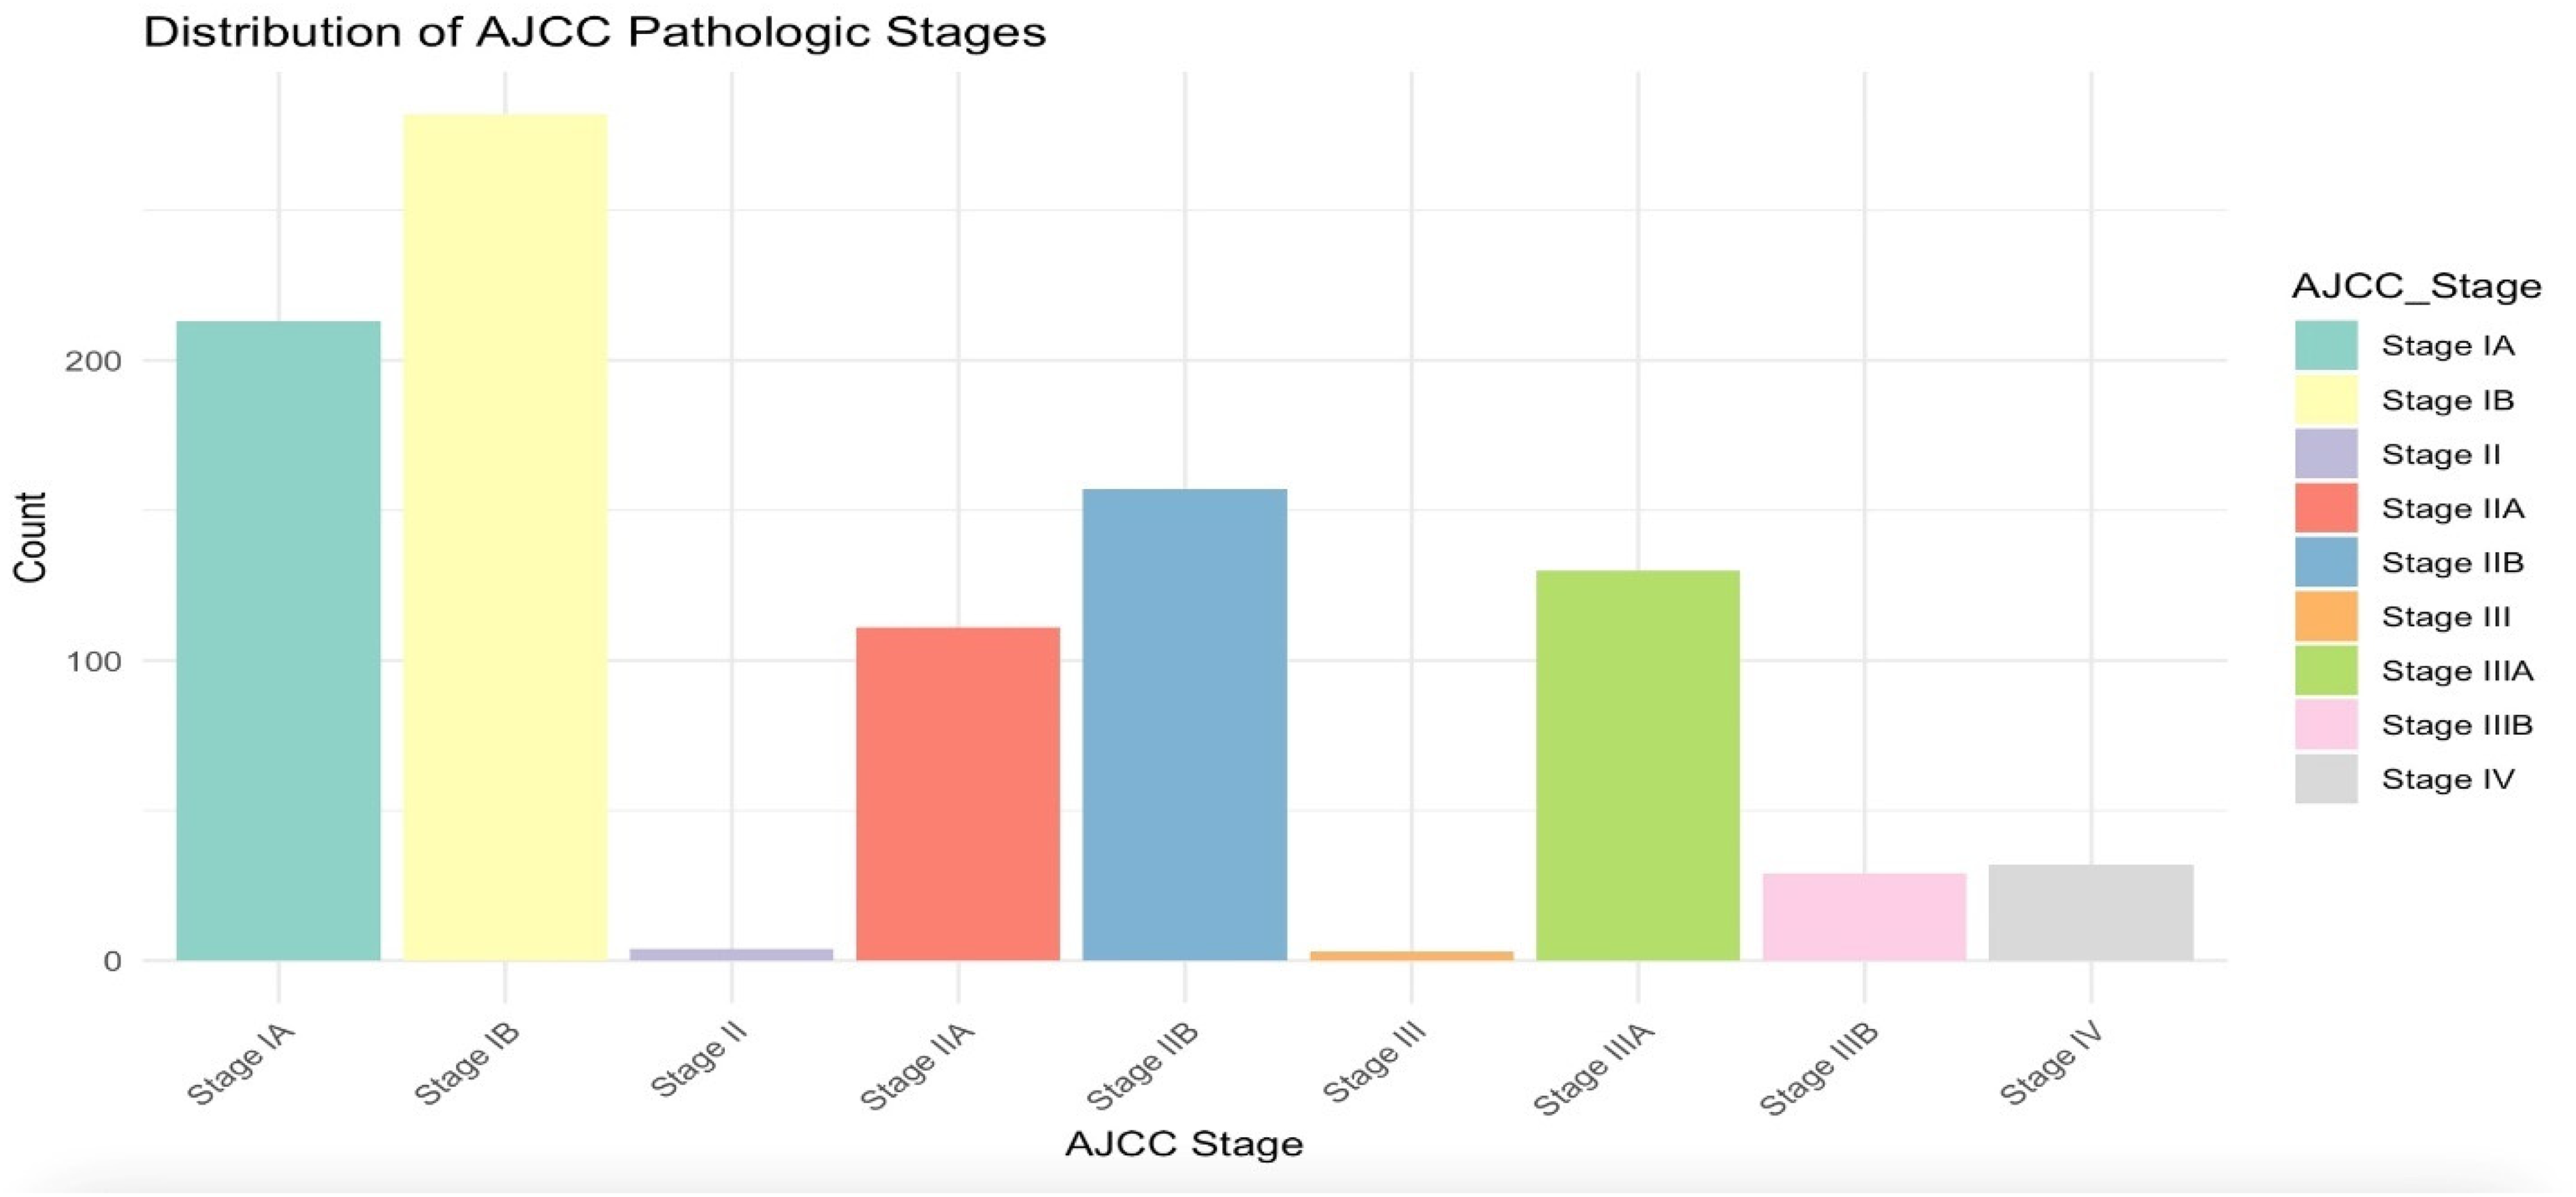
Bar plot showing the distribution of AJCC pathological stages among the study cohort (after NAs removal). Early-stage cancers (IA, IB, II, IIA, IIB) are distinguished from late-stage cancers (III, IIIA, IIIB, IV) to highlight the dataset's composition.
The pathological stage distribution across 993 TCGA patients, including counts, gender distribution, and age ranges (30–50, 50–70, 70–90). This table illustrates the representation of stages and their categorization into early and late stages.
Data preparation
The dataset comprised RNA-Seq data integrated with clinical annotations from 993 lung cancer patients. The dataset was downloaded from TCGA lung cancer cohort. The dataset has been log-transformed and cleaned to ensure normalization and comparability. The lung cancer stage was categorized into a binary outcome: early (stages 1A, IB, IIA, IIB) and late stages. The dataset was randomly split into training (70%) and test (30%) subsets. The training set was used for gene selection via the Wilcoxon rank-sum test, while the test set was reserved for evaluating sensitivity, specificity, and final model validation. Feature importance rankings were later examined to assess the contribution of selected genes. Though not the focus of this paper, biological pathway insights were explored to contextualize the selected features within known molecular mechanisms. The final dataset structure included 961 columns (each representing a patient) and 19,940 rows (each representing a gene).
Machine learning method
The predictive model utilized XGBoost, an optimized gradient boosting algorithm selected for its robustness, accuracy, and ability to handle structured and imbalanced datasets effectively. XGBoost was favored over alternative algorithms, such as support vector machines (SVM), LightGBM, and CatBoost, due to its demonstrated superior performance in similar biomedical applications. For instance, XGBoost achieved using AUC of 0.896 in lung nodule classification, outperforming SVM's AUC of 0.850. 10 Moreover, XGBoost's capacity for efficient hyperparameter tuning, as demonstrated by its compatibility with Bayesian optimization techniques, further supports its application in this study.10,11
Hyperparameter tuning was conducted using 5-fold cross-validation within the training set. Key parameters, including the learning rate (eta), maximum tree depth (max_depth), and regularization coefficients (alpha and lambda), were optimized to enhance model performance. To address class imbalance, the scale_pos_weight parameter was calculated as the ratio of early-stage to late-stage cases. The optimal number of boosting rounds was determined based on the highest cross-validated AUC.
Statistical methods
Model evaluation focused on sensitivity and specificity at thresholds ranging from 0.1 to 0.9, calculated exclusively on the test set to avoid bias. Receiver operating characteristic (ROC) curves were generated, and the area under the curve (AUC) was calculated for both cross-validation and test predictions to assess the model's discriminative ability. The Wilcoxon rank-sum test was employed for feature selection on the training dataset to ensure robust identification of predictive genes. Additionally, the feature importance table (Supplementary Table 1) was generated, ranking genes based on their relative contribution to model performance. Feature importance was quantified using model-derived weights, analogous to gain, which measures the improvement in predictive accuracy associated with a given feature. The feature number represents the gene's index in the dataset and does not correlate with ranking—genes were ranked solely based on their predictive weight. Further insights were drawn by contextualizing top-ranked genes within broader molecular mechanisms, providing a biological perspective on feature selection in cancer classification.
Results
Model performance and gene subset selection
Subsets of genes ranging from the top 10 to 200 were evaluated using XGBoost with cross-validation (CV) to determine the optimal feature set. As shown in Table 2, the test AUC reached a local maximum of 0.6797 for the top 140 genes and a global maximum of 0.6534 for the top 40 genes. The local maximum refers to the highest AUC observed within a subset of models, whereas the global maximum denotes the overall best-performing model across all tested subsets.
Model performance across different gene subsets. The table lists the Area Under the Curve (AUC) values from XGBoost's cross-validation (CV) on the training and testing datasets performance as the number of top genes used in the model increases. Each row represents a different subset of top genes, showing CV AUC (Train AUC range around 0.60 to 0.65) and varying performance on the testing data (Test AUC range from around 0.62 to 0.67). The top 40 genes achieve a strong balance between model simplicity and classification performance (Test AUC = 0.6534), making it the optimal choice. Only the 95% confidence intervals for the test AUC are reported, as the training AUC is not informative for assessing generalizability.
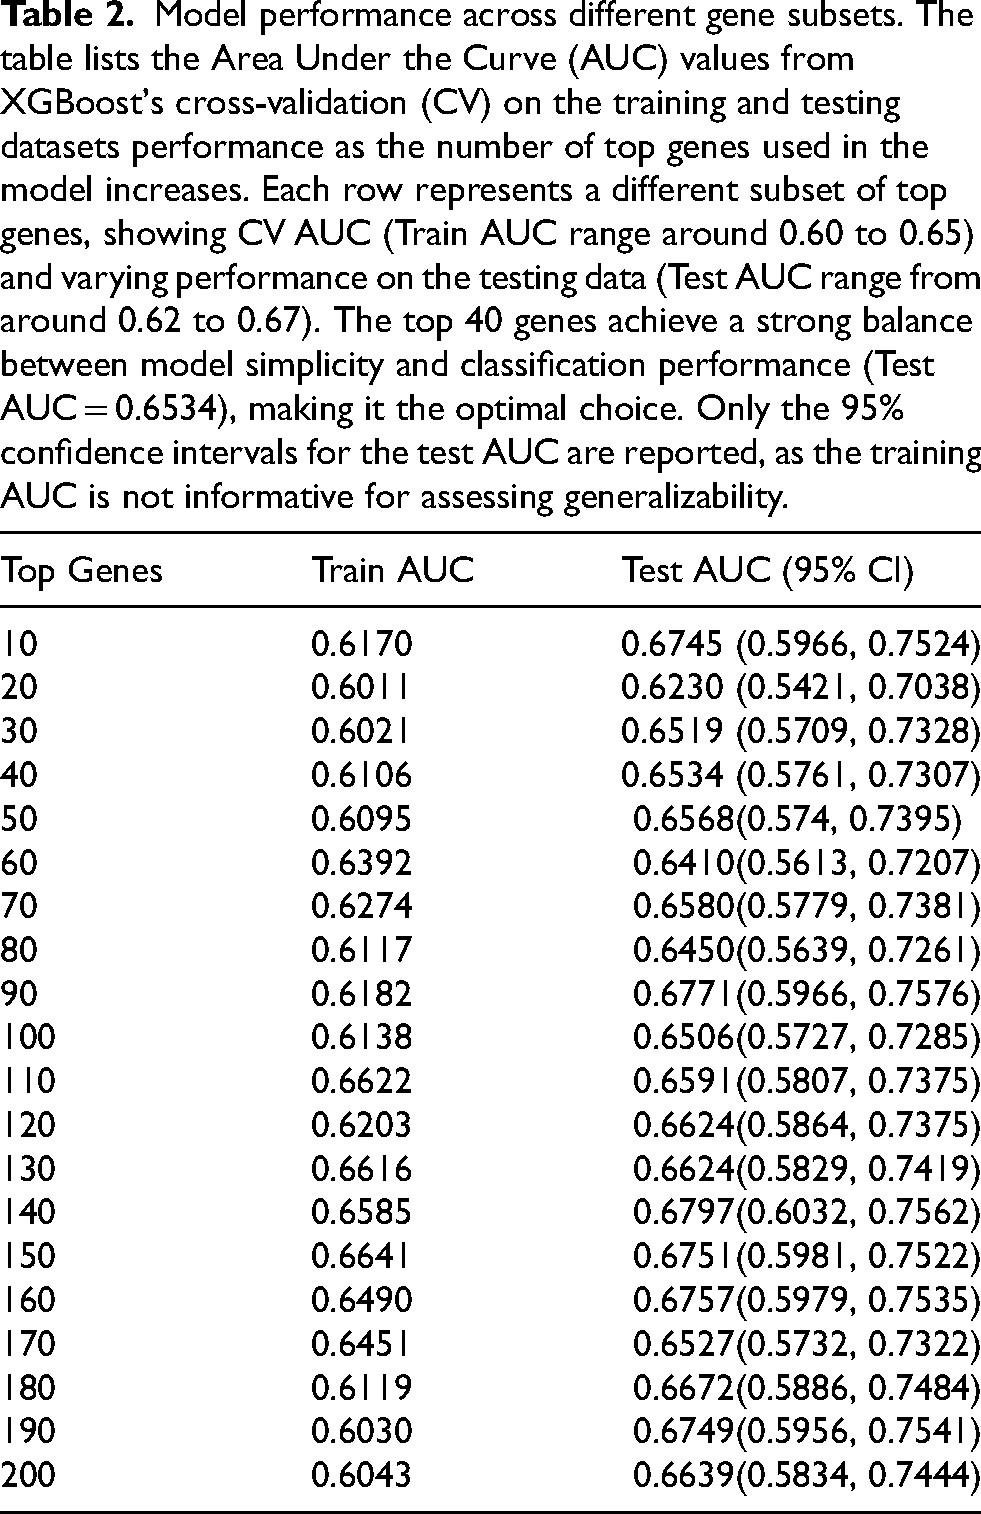
The training AUC for the top 140 genes was 0.6585, with a test AUC of 0.6797, resulting in a smaller performance gap. However, the inclusion of 140 genes increases the number of model parameters, potentially leading to overfitting. In comparison, the top 40 genes achieved a training AUC of 0.6106 and a test AUC of 0.6534, striking a balance between generalizability and model simplicity. The selection of 40 genes was based on optimizing predictive performance while maintaining interpretability.
Model evaluation and threshold analysis
The ROC curve for the top 40 genes (Figure 3) illustrates the model's classification performance, with a test AUC of 0.6534. The CV AUC (0.6106), annotated on the plot, reflects the model's average performance across cross-validation folds. Unlike the test AUC, which is specific to unseen data, the CV AUC provides a more generalized estimate of model robustness but cannot be visualized as a curve.
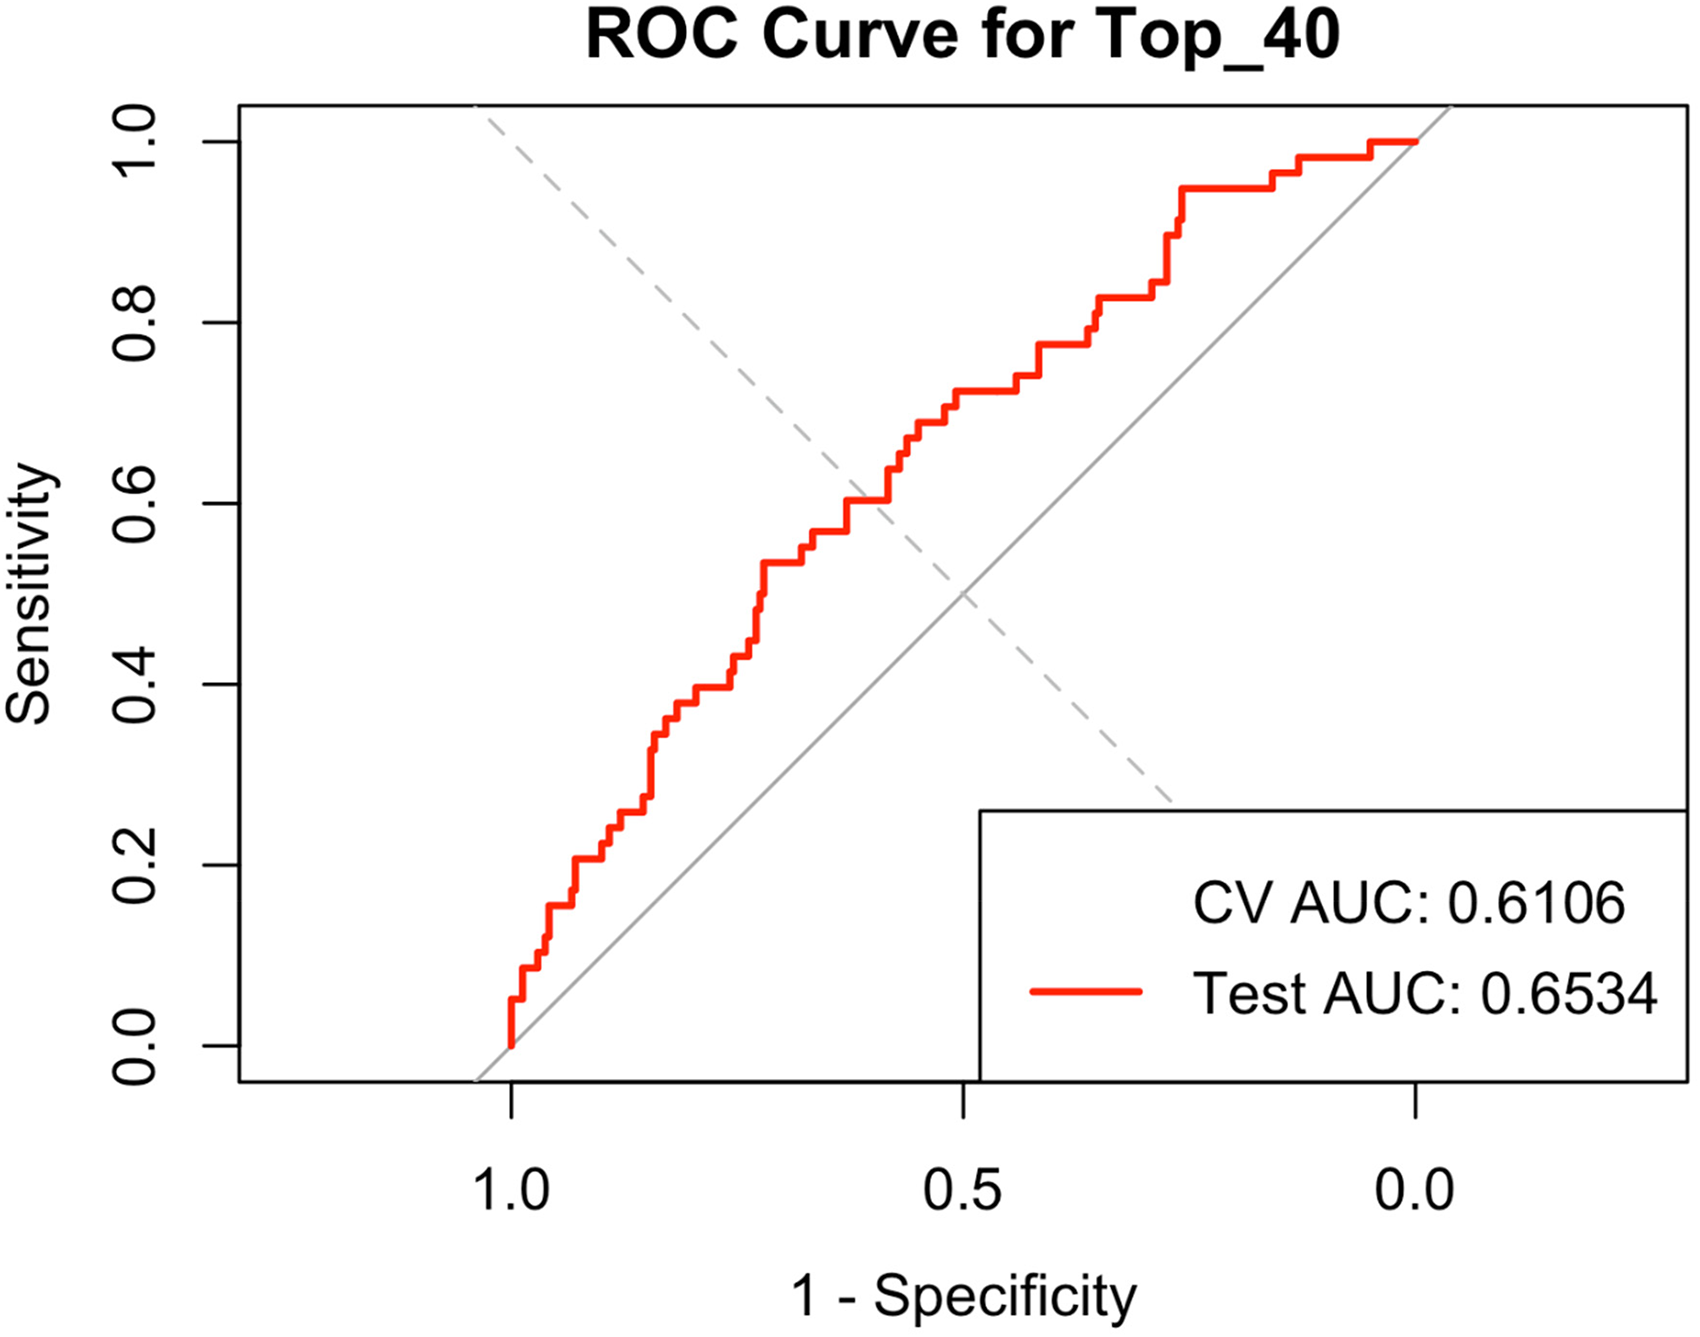
ROC curve for the top 40 genes. The red line represents the ROC curve for the testing dataset with an AUC of 0.6534, illustrating the model's performance on unseen data. The cross-validation (CV) AUC value is 0.6106 and is annotated on the plot, as it is a single value and not plottable.
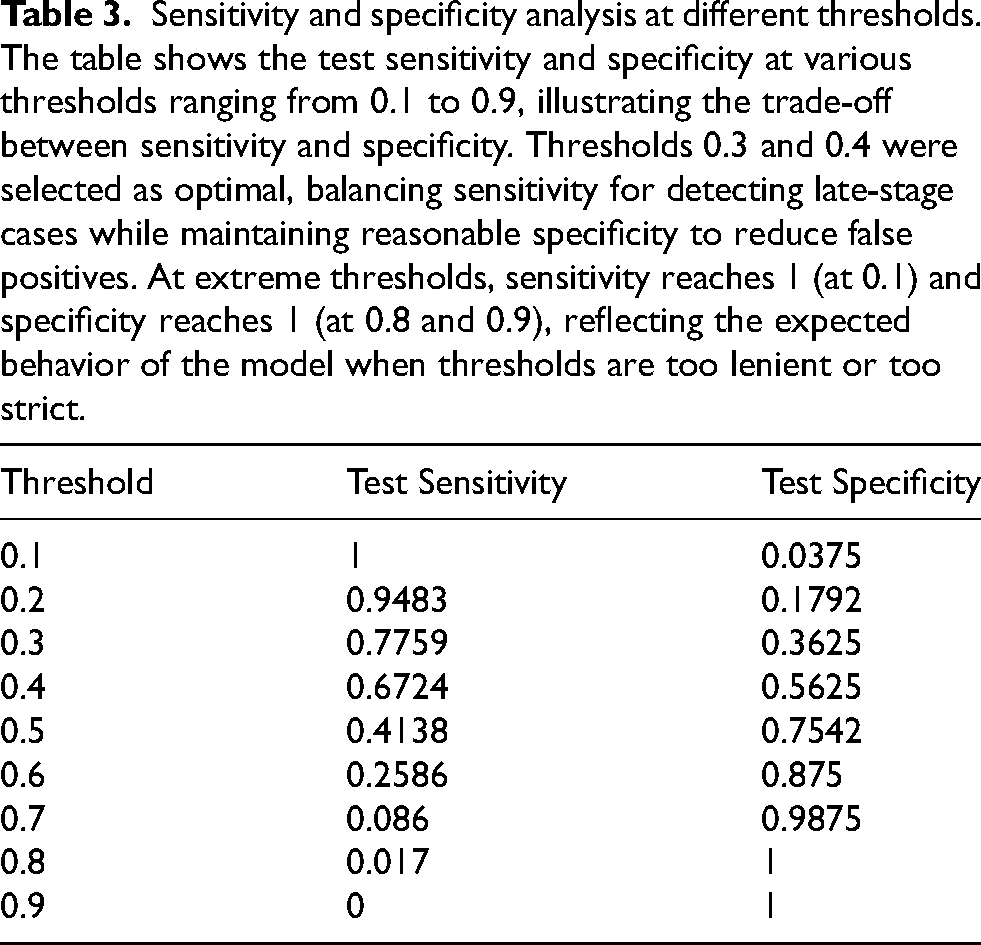
Sensitivity and specificity were assessed across classification thresholds ranging from 0.1 to 0.9 (Table 3). At the threshold of 0.3, the model achieved a sensitivity of 77.59% and a specificity of 36.25%, allowing for more comprehensive late-stage cancer detection. Increasing the threshold to 0.4 improved specificity to 56.25%, though sensitivity declined to 67.24%. The chosen thresholds balance the trade-off between identifying late-stage cases and minimizing false positives. As expected, specificity increased with higher thresholds, while sensitivity showed variability due to dataset imbalance.
Sensitivity and specificity analysis at different thresholds. The table shows the test sensitivity and specificity at various thresholds ranging from 0.1 to 0.9, illustrating the trade-off between sensitivity and specificity. Thresholds 0.3 and 0.4 were selected as optimal, balancing sensitivity for detecting late-stage cases while maintaining reasonable specificity to reduce false positives. At extreme thresholds, sensitivity reaches 1 (at 0.1) and specificity reaches 1 (at 0.8 and 0.9), reflecting the expected behavior of the model when thresholds are too lenient or too strict.
Feature importance analysis
The feature importance table (Supplementary Table 1) ranks the top 40 genes based on their contribution to model performance. Importance is measured by weight, which quantifies a gene's impact on improving predictive accuracy—analogous to the gain metric in XGBoost. The feature number represents the gene's index in the dataset and does not correspond to ranking by importance. For example, ECD ranked first in importance but had a feature number of 21, as model training determines importance independently of input order. Additionally, one gene had a weight of 0, meaning it was included in feature selection but did not contribute to classification outcomes. While retained in the table for completeness, it does not influence final predictions.
Although biological interpretation is beyond the primary focus of this study, a pathway analysis identified significant enrichment of genes involved in cancer-related processes, such as Th17 cell differentiation, pancreatic secretion, and ribosomal function. These findings provide additional biological context for the identified gene set.
Discussion
This study leverages machine learning to classify lung cancer stages using gene expression data. Using an XGBoost model with cross-validation (CV), we identified a subset of 40 genes that achieved a balance between predictive performance and model interpretability. The model demonstrated a moderate ability to differentiate between early and late lung cancer stages, achieving a test AUC of 0.6534 (95% CI: 0.5761–0.7307). Although slightly below conventional benchmarks for clinical deployment, this performance highlights the interpretability and feasibility of machine learning-driven biomarker selection. Specifically, the selected model parameters, thresholds (0.3 and 0.4), and feature importance analysis reinforce the practical utility and potential for further optimization through expanded datasets, additional model refinement, and external validation.
Machine learning models in high-dimensional data must balance predictive performance with overfitting risk. While models trained on larger gene sets (e.g., top 140 genes) showed a smaller gap between training and test AUC, the inclusion of excessive parameters risks reduced interpretability and increased variance in external datasets. The selection of 40 genes balances predictive accuracy (test AUC: 0.6534) with model simplicity, avoiding overfitting while maintaining generalizability. Prior research has shown that reducing feature space improves stability and clinical applicability, particularly in biomarker-based classification tasks.1,12,13
Feature importance analysis further contextualized gene contributions, with rankings based on weight—a measure of the feature's contribution to predictive performance. Unlike dataset ordering, weight (gain) quantifies the incremental benefit of each gene in classification. The presence of a gene with zero weight confirms that not all selected features influence the model's predictions, reflecting the adaptive nature of tree-based models in pruning irrelevant variables. This finding aligns with prior studies demonstrating that machine learning models prioritize a subset of highly informative features, even when more variables are included in initial selection.3,4
The model's overall AUC quantifies discrimination between early and late-stage lung cancer, but in practice, classification requires a predefined threshold. Thresholds of 0.3 and 0.4 were identified as optimal by carefully balancing sensitivity (ability to detect late-stage cancers) and specificity (minimizing false positives). From a clinical perspective, a higher threshold (e.g., 0.4) reduces false positives, avoiding unnecessary stress and interventions for patients incorrectly classified as late stage. Conversely, a lower threshold (e.g., 0.3) maximizes sensitivity, essential in clinical scenarios where missing a late-stage diagnosis carries significant risk for patient outcomes. The chosen thresholds thus reflect a balance of clinical risks and benefits inherent to diagnostic decision-making.
Notably, specificity increased with the threshold as expected, whereas sensitivity did not follow a strictly decreasing trend. This can be attributed to dataset characteristics, particularly class imbalance and the distribution of predicted probabilities. Similar thresholding effects have been reported in cancer classification models, where the presence of high-confidence predictions can cause nonlinear shifts in sensitivity and specificity across decision boundaries.11,14,15 Future studies should explore external validation cohorts to confirm optimal thresholds for clinical implementation.
XGBoost was selected for its efficiency in high-dimensional data and ability to handle missing values, outperforming traditional logistic regression and decision tree models in prior studies.1,3,4 However, alternative machine learning models, such as LightGBM, support vector machines (SVMs), and deep learning architectures, warrant further exploration. Neural networks have shown promise in gene expression-based classification8,16 though they require larger datasets and suffer from interpretability challenges.
Fine-tuning hyperparameters remain crucial for optimizing model performance. This study adjusted learning rate (η = 0.05), tree depth (max_depth = 4), and L1/L2 regularization (α = 0.1, λ = 0.5) to balance bias-variance trade-offs. Additional techniques, such as Bayesian optimization or automated hyperparameter tuning, may further refine classification performance in future studies. Benchmarking XGBoost against alternative models could provide insights into whether tree-based ensembles remain the optimal choice for lung cancer staging.
Despite promising findings, several limitations must be acknowledged. The dataset, while comprehensive, remains limited in sample size and suffers from an imbalance between early and late-stage cases. Additionally, while log-transformation was selected due to its common use and simplicity, alternative normalization methods were not explored in this study. Future research should conduct sensitivity analyses to assess how different normalization techniques may impact model performance and robustness. Lastly, the relatively high cost and longer turnaround time associated with RNA-Seq may pose practical barriers to widespread clinical adoption. Complementary approaches, such as blood-based biomarkers or targeted PCR assays, could offer cost-effective and rapid alternatives, potentially facilitating broader clinical implementation.
Methodologically, this study focuses solely on XGBoost, and while its performance is competitive, alternative models warrant exploration. Future research should incorporate deep learning techniques or hybrid ensemble approaches to assess performance improvements. Additionally, while feature selection relied on the Wilcoxon rank-sum test, integrating embedded selection methods or recursive feature elimination may enhance stability.
Beyond computational considerations, the biological significance of selected genes remains an area for further investigation. While enrichment analysis provided preliminary insights into potential pathway involvement, deeper functional validation is required. Future studies should integrate multi-omics approaches, incorporating proteomics and metabolomics data, to refine the biological interpretation of identified biomarkers.
Conclusion
This study demonstrates the feasibility of machine learning-driven gene selection for lung cancer stage classification using XGBoost with cross-validation, identifying 40 key genes that optimize predictive accuracy and model interpretability (Test AUC = 0.6534). Thresholds of 0.3 and 0.4 balanced sensitivity and specificity, ensuring clinical relevance. While larger gene sets provided marginal improvements, they increased model complexity and overfitting risks. Future research should focus on expanding datasets, benchmarking alternative models, and integrating multi-omics approaches to improve model robustness and clinical applicability. These findings reinforce the potential of machine learning-driven biomarker selection to enhance precision oncology and early-stage cancer diagnostics.
Supplemental Material
sj-docx-1-cbm-10.1177_18758592251367223 - Supplemental material
Supplemental material, sj-docx-1-cbm-10.1177_18758592251367223
Footnotes
Acknowledgments
We acknowledge the patients and The Cancer Genome Atlas (TCGA) for providing the invaluable data used in this study.
Author contributions
Conception: Yinbo Wang
Interpretation or analysis of data: Yinbo Wang
Preparation of the manuscript: Yinbo Wang
Revision for important intellectual content: Yinbo Wang
Supervision: Dr Kai Fu
Funding
The authors received no financial support for the research, authorship, and/or publication of this article.
Declaration of conflicting interests
The authors declared no potential conflicts of interest with respect to the research, authorship, and/or publication of this article.
Supplemental material
Supplemental material for this article is available online.
References
Supplementary Material
Please find the following supplemental material available below.
For Open Access articles published under a Creative Commons License, all supplemental material carries the same license as the article it is associated with.
For non-Open Access articles published, all supplemental material carries a non-exclusive license, and permission requests for re-use of supplemental material or any part of supplemental material shall be sent directly to the copyright owner as specified in the copyright notice associated with the article.