
Abstract
Timely and accurate economic data are vital, especially in times of great turbulence. Quantitative monthly output indicators often lag around one to two months, hindering effective decision-making. Consequently, research into (near) real-time estimation has surged, particularly within central banks and institutes. Recent crises have challenged traditional nowcasting approaches, proven inadequate for the current turbulent economic landscape. To assess the current state of real-time estimation, we conducted an international survey of National Statistical Institutes (NSIs) and undertook in-depth interviews with the Bank of Slovenia and the Institute of Macroeconomic Analysis and Development, both actively engaged in nowcasting and forecasting. Follow-up interviews were also held with some NSIs. Our findings revealed limited engagement with real-time estimation among NSIs, primarily due to staff shortages, despite top management support. Three key best practices emerged for accelerating indicator releases: streamlining data collection, producing granular real-time indicators shedding light on different aspects of the economy and implementing advanced modelling techniques. These practices offer a pathway for NSIs to generate more agile and impactful economic data in periods of increased turbulence and uncertainty.
Introduction and background
The timely availability of accurate economic indicators is paramount for effective decision-making. Building on the Special Data Dissemination Standard (SDDS) set up by the International Monetary Fund and the Principal European Economic Indicators (PEEI) developed by Eurostat, the United Nations established a data template for short-term statistics with recommended periodicity and timeliness. 1 For monthly output indicators, crucial for tracking current economic activity, the recommended timeliness ranges between 6–12 weeks and a month lag is encouraged. In the European Statistical System (ESS), the fastest monthly output indicators are qualitative sentiment indicators released within the same month, while quantitative output indicators for business sectors follow with a delay of about one to two months. 2 Publication lags previously considered acceptable are often deemed excessive in today's rapidly evolving and often turbulent economic landscape as they hinder the ability of policymakers, businesses, and researchers to understand and respond promptly to emerging economic trends. Real-time estimates of economic indicators are essential particularly for central banks and governments that require timely and pertinent data. This contributed to a renewed and intensified interest in developing nowcasting techniques to produce estimates at a much shorter lag, therefore dealing with less or incomplete input data. It is important to note that there is a difference between nowcasts and flash estimates: both use incomplete data, but flash estimates rely on the same models as the final results, while nowcasts may use different models, as long as they combine predictive variables with strong statistical and economic relevance to the target. 3
Research activity regarding different aspects of nowcasting seems to be rapidly expanding (e.g., 4 ), especially in the field of economic indicators, given the availability of timely data in many sectors of economic activity and a forecasting tradition in this domain. 5 Thematic workshops also play a key role in accelerating the exchange of ideas, best practices, and advancements in modelling techniques. For example, several international institutions (including the UN Industrial Development Organization, the UN Department of Economic and Social Affairs, IMF and OECD) participated in the CCS-UN Technical Workshop on Nowcasting in International Organizations (February 2020, Geneva, Switzerland). 5 The event focused on challenges in the use of high-frequency data, detecting economic turning points, and applying a variety of models. More recently, the OECD Workshops on Time Series Analysis (December 2023 and 2024, Paris, France) brought together leading nowcasting researchers from international organisations, national statistical institutes (NSIs), and central banks. These workshops highlighted ongoing efforts to develop and implement advanced models (including dynamic factor models, Kalman filters and deep learning approaches). Despite this growing body of research and recognition of the benefits of timely information, implementation of nowcasting and production of real-time economic indicators in the routine production of official statistics by NSIs remains limited. Nowcasting represents a departure from design-based estimation, traditionally used in official statistics; the model-based approach to estimation has so far been limited to certain areas of statistics production, such as imputation and seasonal adjustment. The very definition of “real-time” in an official statistics context also requires further discussion towards possible agreement.
Our research on improving timeliness of economic indicators is motivated by a project of the Statistical Office of the Republic of Slovenia (in Slovenian: SURS, Statistični urad Republike Slovenije) to accelerate the release of the total market production index (TMPI), which currently experiences a two-month lag. The TMPI, a composite monthly output index produced by some European NSIs or Eurostat on a voluntary basis, combines four short-term indicators that cover industry, construction, trade and services. By covering a large share of the total gross value added (about three quarters in the EU), it should give a good first indication of the evolution of the total economic performance on a monthly basis compared to GDP growth rates released quarterly. 6
This paper first reviews the literature with special emphasis on nowcasting techniques (Section 2). In order to understand the current situation in the field, we conducted an international survey of NSIs on planned and ongoing work on real-time estimation, and interviews with experts in different institutions on challenges of producing real-time economic indicators (see Section 3 for methodology and Section 4 for results). We conclude with a discussion and possible pathways forward for faster data releases (Section 5).
Review of suggested nowcasting techniques
In official statistics the trade-off between accuracy and timeliness of short-term indicators has always been present. 7 But in the last two decades, especially after the financial crisis of 2008 and the COVID-19 blow, a lot of attention is paid to timeliness. Consequently, accelerated growth of nowcasting research literature can be observed. With the evident need for as fast as possible detection of possible shocks, along with omnipresence of data and stunning computer processing power, it is no surprise that nowcasting is intensively being considered as becoming a new standard in time series analysis.
The term nowcasting, describing estimating or forecasting in almost real time, primarily originates from meteorology. 8 Nowcasts can be defined as real-time evaluations of variables based on a series of relevant, timely and higher-frequency indicators. 9 In our context, nowcasting refers to the estimation of the current, or near-current, value of a target series using information from more timely series, 4 which means that “real-time” is used in much broader sense than in meteorology. With the advent of high-frequency data also in other areas the use of nowcasting techniques expanded and developed significantly. In economic literature the term became popularized after publication of Giannone et al., 10 however Mariano and Murasawa used this term already a few years earlier when developing a coincident business cycle index based on monthly and quarterly series. 11
As usage increased, the range of nowcasting methods expanded, therefore it is not surprising that there is no consensus as of the best modelling approach, because every technique is specific for certain situation with its pros et cons. Besides the basic ARMA (auto-regressive moving average) models, often mentioned are also DFM (dynamic factor models), MIDAS (mixed-data sampling regression), Bayesian VAR (vector auto-regression), MF-VAR (mixed-frequency VAR) and FAVAR (factor augmented VAR) models, as well as more complex decision trees and other machine learning methods.
Some of the most often mentioned methods are described in more detail below:
Auto-regressive models:
○ ARMA (auto-regressive moving average) models: They are a family of parsimonious univariate models regularly used as a benchmark in comparison with other approaches. They describe a stationary stochastic process with two polynomials, one capturing the autoregressive (AR) component with p lags and the other the moving average (MA) component with q lags. For practical and computational simplicity, the moving average component is often omitted, resulting in an AR(p) model. The ARMA models will serve as a reference also for our work. Despite their limiting assumptions they perform well in a stable environment and are very easy to use in every NSI. ○ ARIMAX models: These are autoregressive integrated moving average models with exogenous variables. The inclusion of timely exogenous information (such as high-frequency indicators) is expected to substantially enhance predictive performance. Consequently, ARIMAX models are generally anticipated to outperform purely univariate specifications. ○ ARDL (auto-regressive distributive lag) models: Besides the AR component (consisting of lagged values of the dependent variable), the ARDL model includes also lagged values of the explanatory variables. ○ VAR (vector auto-regression) and B-VAR (Bayesian VAR) models: These models generalize the univariate AR model into a system of simultaneous equations, where each variable in the system is modelled as a function of its own lags and the lags of all other variables. In this framework, all variables are treated symmetrically—as both dependent and explanatory—rendering the distinction between endogenous and exogenous variables irrelevant. As a result, VAR models are typically not interpreted in a structural or contextual sense but are instead used for forecasting and analysing interdependencies. The standard VAR's over-parameterization and collinearity problems can be further mitigated by B-VARs, where the parameters are considered random variables with an assigned prior probability. MF-VAR (mixed-frequency VAR) models and MIDAS (mixed-data sampling) regression models: These are (auto)regression models that can relate the dependent variable future values of a lower frequency with current and lagged high-frequency values of the explanatory variables. MIDAS models have been employed and have shown promise in forecasting contexts (e.g.,12–14). In official statistics many indicators that are potentially highly correlated can be observed at a different frequency. Models that can combine these different frequencies, are therefore worth considering. Models for dimensionality reduction:
○ PCA (principal component analysis): It concerns a dimensionality reduction that transforms the original data into a new coordinate through a linear transformation. The new axes—known as principal components—are ordered such that each successive component captures the maximum remaining variance in the data. In official statistics, the number of potentially correlated indicators is often very large. This motivates the use of dimensionality reduction techniques such as PCA, which serves as a foundational method for extracting common variation and reducing complexity. We therefore begin our exploration of this class of models with PCA as a baseline approach. ○ DFM (dynamic factor models): These models are widely used in time series forecasting and nowcasting. They are based on the assumption that the evolution of a large number of observed time series can be explained by a small number of unobserved (latent) factors, typically interpreted as underlying economic forces—such as the business cycle—accompanied by idiosyncratic noise. Each observed variable is modelled as a function of one or more latent dynamic factors, plus an error term. DFMs introduce time dynamics either through autoregressive structures on the latent factors or by including lagged values of the observed series. To improve interpretability and estimation efficiency, variables are often grouped into blocks (ideally hierarchically) that represent different sectors or dimensions of the economy.
15
These models are particularly well-suited for high-dimensional settings where traditional regression-based models would become infeasible.16,17 ○ FAVAR (Factor-Augmented VAR) models: These models extend the standard structural VAR analysis by incorporating latent factors extracted from large data sets.
18
This approach allows researchers to exploit the informational content of high-dimensional data without overparameterizing the model. A prominent implementation of FAVAR is the Three-Pass Regression Filter (3PRF) method,
19
which identifies a parsimonious set of factors that are most relevant for forecasting the target variable, while discarding irrelevant but pervasive factors. An enhancement of this approach, the Mixed-Frequency Three-Pass Regression Filter (MF-3PRF),
20
accommodates datasets where predictors and the forecasted variable are observed at different frequencies—an especially valuable feature in real-time nowcasting applications. ML (machine learning) approaches,
21
e.g.,: Kalman filter (recursive smoothing algorithms), decision trees (also combined into random forests), LSTM (long short-term memory) models, artificial neural networks or MLP (multilayer perceptron), feedforward artificial neural networks, etc. Although highly adaptable especially through their non-linearity that proves to be a true game changer in certain macroeconomic predictions, ML procedures lack the interpretative power, though.
When choosing the appropriate model, also data characteristics have to be considered, especially regarding mixed-frequency data (e.g., some time series could be observed monthly and some quarterly) and ragged-edge data structure, when relevant series start/end at different points in time. 22 In such situations we can forecast missing values with bridge equations (e.g., monthly values for a quarterly observed variable), using simpler linear regression time series models. 23
Simpler models (such as ARMA) are in general easier to understand, estimate and interpret. Moreover, in relatively stable environments, they may outperform more complex models. However, they are not quickly adaptable, which makes them less suitable for modelling volatile phenomena. In the event of a significant, unexpected shock, simpler nowcasting methods with autoregressive terms (e.g., ARIMA(X), VAR) tend to respond sluggishly as they rely on historical patterns that may no longer be informative under new conditions. This might be desirable for early estimates during stable periods, when a sudden change in the observed turnover of a few units may reflect random noise rather than a systematic shift. In case of a more volatile period, sudden changes in observed turnover might be mainly caused by genuine economic developments and therefore should not be suppressed. 24 However, the literature offers no clear consensus (yet) as to which model class best captures such rapid shifts. Therefore, we suggest using different models that should each apply to different periods (more and less volatile) to identify those that are the most adaptive, i.e., that perform well across a range of economic conditions.
While nowcasting has generally been widely adopted and well received, the robustness of the methods is thus questionable.
9
Several key aspects must be considered when selecting an appropriate model, including:
the nowcasting target (i.e., are we interested in nowcasting the level of a variable or merely its direction), the choice of explanatory variables (small vs. large models), the modelling period (are there structural breaks or distinct time subperiods that require inclusion of dummy variables to distinguish between them), the nowcasting or forecasting horizon, asymmetry of model performance (is there possible asymmetry between reactions to positive and negative shocks, and/or are there asymmetric consequences due to under-/over-estimation
25
), transformation of variables (e.g., to ensure stationarity), where it needs to be kept in mind that when using non-linear forecasting methods (e.g., ML algorithms), the type of transformation can significantly affect the forecast,
26
seasonal and calendar adjustment, choice of the cut-off date for monthly indicator release (because not all indicators are released on the same date), etc.
Castle et al. 27 highlight several additional challenges. One is the missing data problem, where not all disaggregated contemporaneous data are available when needed to construct relevant aggregates. Another is the breaks problem, where unexpected shifts in the level or location of variables can distort nowcast accuracy. Furthermore, many components are only temporary estimates and are often revised later, making them unreliable indicators of the current situation, which is known as the problem of measurement error. Considering suitability of relevant methods as well as their potential drawbacks, the choice of a method is often not obvious and with so many candidate models, overfitting is a real threat. 28
It is common to present empirical research by specifying just one baseline with several robustness checks, but this procedure tends to produce excessively optimistic conclusions due to the underestimation of the uncertainty associated with the whole estimation procedure. 29 Therefore, it is highly recommended to try modelling with several different models, possibly with complementary attributes to determine their effects. If relevant, a combination of different models might prove useful regarding the predictive power, that is generally assessed using different measures, typically MAE (mean absolute error), MAPE (mean absolute percentage error), RMSE (root mean square error), percentage of correctly predicted signs (SR), etc., as well as different modelling and/or nowcasting periods to assess the model's performance under different conditions and thus infer about its robustness, with addition of impulse-response functions studies30,31 for more complex models, also to potentially identify possible structural shocks.
When no single model can be selected in a specific situation, and when it is appropriate to combine predictions resulting from different models, a question arises of how to assign weights to these different estimates to obtain the final prediction. This is known as model averaging 29 or thick modelling. 32 Several options of estimate pooling are suggested: simple arithmetic mean, median, inverse mean square error, triangular kernel approach (here the weights are set inversely according to the rank of performance of individual predictions, because the rank is a more robust measure than the error value itself), etc. 33
Methodology
While the literature provides a myriad of possible approaches, it gives neither a complete picture of the challenges nowcasting poses in real-life application nor an insight into the activities and challenges that NSIs are experiencing with regard to producing real-time economic indicators. To fill this gap, we conducted an international survey (see 3.1) and several interviews (see 3.2).
An international survey of NSIs
An international survey of NSIs aimed at achieving insights into planned and ongoing developmental work on real-time estimation and related challenges. The invitation was sent by email to 43 NSIs from the ESS and developed countries around the world. Our decision to focus on developed countries rests on the premise that NSIs in these countries more likely possess the capacity to allocate resources to development and implementation of real-time estimation. Within the ESS, we targeted short-term statistics coordinators, while in other NSIs we asked personal acquaintances to direct us to the most knowledgeable respondent(s).
The questionnaire was developed iteratively, after testing it with both an NSI experienced in real-time economic indicator production and an NSI with no such experience. We also aimed at keeping the survey as short as possible. Survey questions referred to the following topics:
Pressure for faster indicators Monthly output indicators of the market economy and their publication lags Activities to improve timeliness of economic indicators Fastest monthly output indicators and their publication lags Definition of a real-time estimate and NSIs’ position on real-time monthly output indicators Methods used in real-time estimation Obstacles to real-time estimation
The invitation to participate in the survey was sent by email that contained a link to the web questionnaire. An overview of the questionnaire was also attached as a pdf. Most survey data were collected in May and June 2024. As presented in Table 1, we received survey response from 27 NSIs, of which 22 from the ESS (14 from EU member states and eight from other ESS partners) and 5 from around the world. These NSIs were included in the analysis of survey questions. Further four NSIs provided qualitative feedback shedding light on real-time estimation in their institutions. We conducted follow-up interviews with three NSIs that had fast releases and/or worked on nowcasting, but also discussed it informally with NSI representatives in person or by email (see 3.2).
Countries of responding NSIs (n = 31).
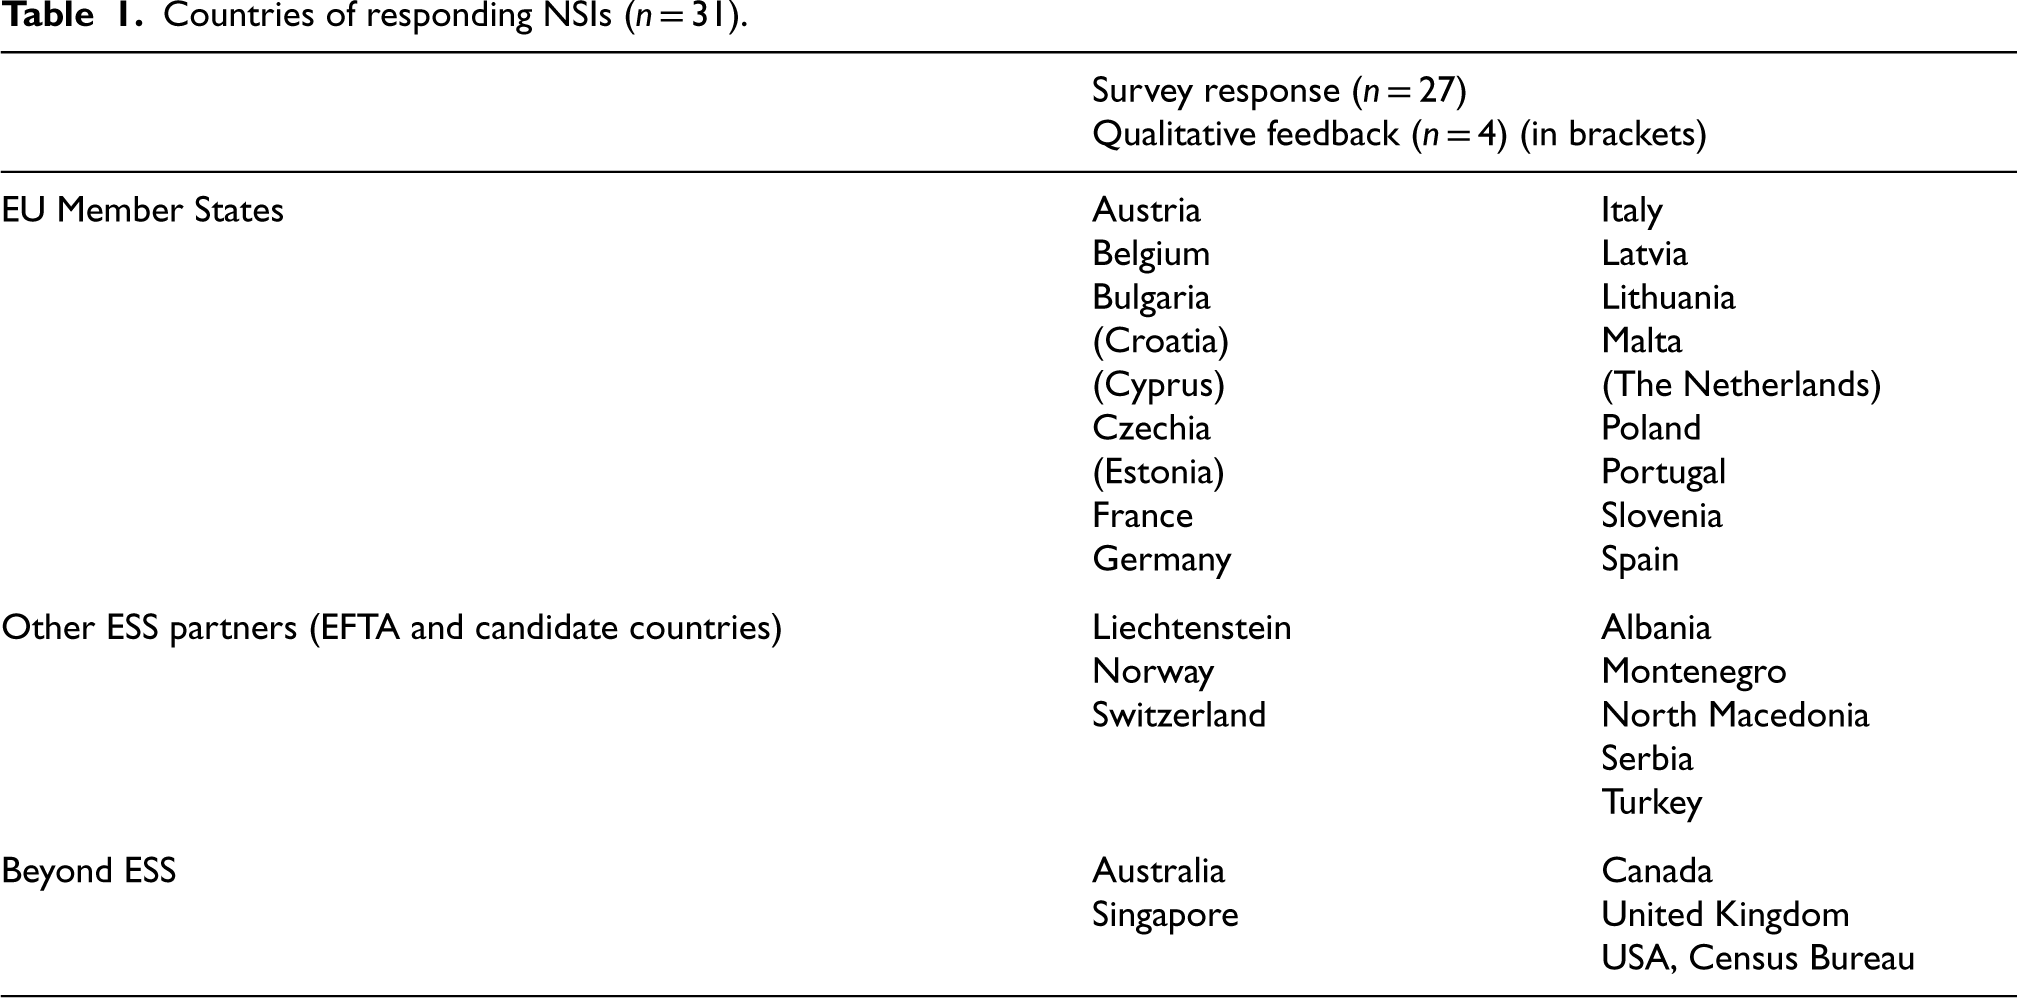
Countries of responding NSIs (n = 31).
We conducted two sets of interviews. First, we undertook in-depth interviews with the Bank of Slovenia and the Institute of Macroeconomic Analysis and Development (in Slovenian: UMAR, Urad za makroekonomske analize in razvoj), both actively engaged in nowcasting and forecasting. Both institutions issue forecasts of economic trends twice a year (the central bank in June and December, UMAR in March and September) and are among the key users of official statistics in Slovenia. The project team of three researchers who conducted the interviews (two specialised in econometrics and one specialised in data collection in official statistics) used a pre-defined checklist of topics (timeliness of economic indicators; traditional, new and potential data sources and their characteristics; methods and their assumptions, conditions, results etc.). Altogether, interviews included eight interviewees, all experts involved in preparing forecasts and nowcasts. After the interviews, both institutions shared with us additional documentation detailing their procedures.
Second, semi-structured follow-up interviews were conducted online with selected NSIs possessing notable experience in real-time economic indicator production. Additional insights were gathered through informal exchanges with NSI representatives at the 7th International Conference of Establishment Statistics (ICES-VII), and via email.
Findings
Survey results
Two thirds or 18 of responding NSIs reported experiencing mild pressures to produce short-term economic indicators faster, while only one NSI indicated strong pressures. The remaining eight NSIs reported no such pressures.
We investigated NSI activities aimed at improving the timeliness of economic indicators (see Figure 1). Only a small number of NSIs were actively developing higher-frequency indicators, with one or two introducing fortnightly, weekly, or daily indicators of economic activity. Six NSIs had completed or were in the process of transitioning from quarterly to monthly periodicity of GDP indicators, with a further one NSI planning such a transition. 17 surveyed NSIs reported plans or ongoing/completed work to reduce the publication lag, with a greater number reporting ongoing/completed efforts to reduce lags in quarterly indicators (n = 8) than in monthly indicators (n = 5). While twelve NSIs had completed/ongoing activities on at least one of the efforts in Figure 1, nine NSIs were inactive.
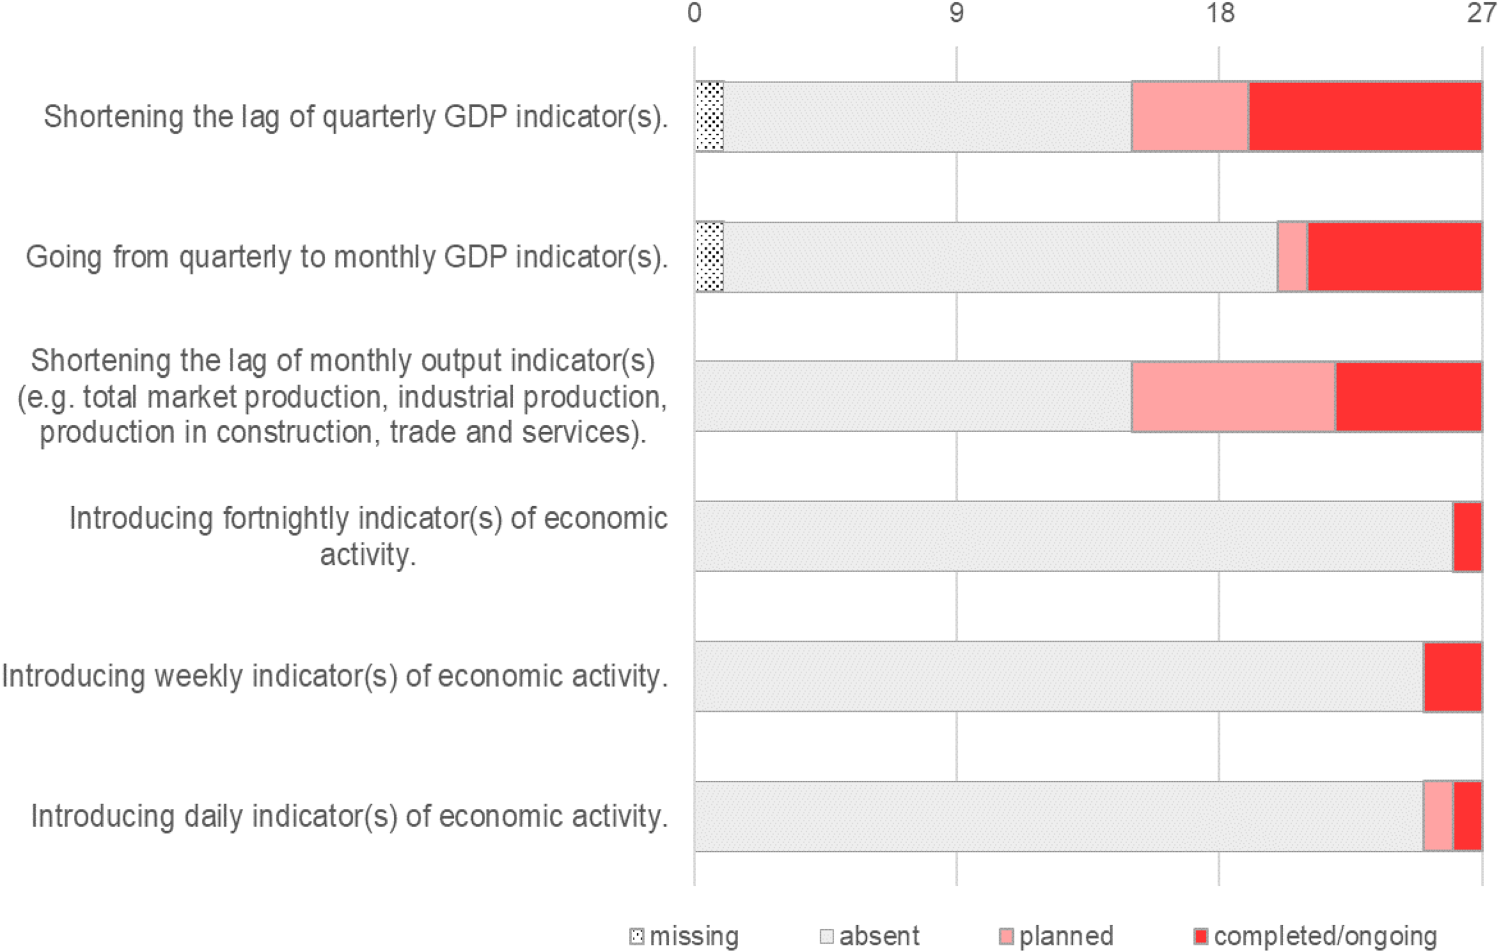
Are the following activities to improve the timeliness of economic indicators absent, planned or completed/ongoing in your organisation? (n = 27).
All responding NSIs utilised non-survey data sources. Tax data were universally employed, with a majority also using employment data, approximately half incorporating scanner data, and a smaller subset leveraging other sources, including electricity data, traffic data, and satellite images.
Six responding NSIs were already producing or planning to produce the TMPI, and further five NSIs were producing another monthly output indicator that covers the market economy; 16 NSIs reported not producing such an indicator. It has to be noted that some NSIs authorise Eurostat to produce and publish the TMPI for their country. Where available, these indicators were produced between 25 and 65 days after the reference month.
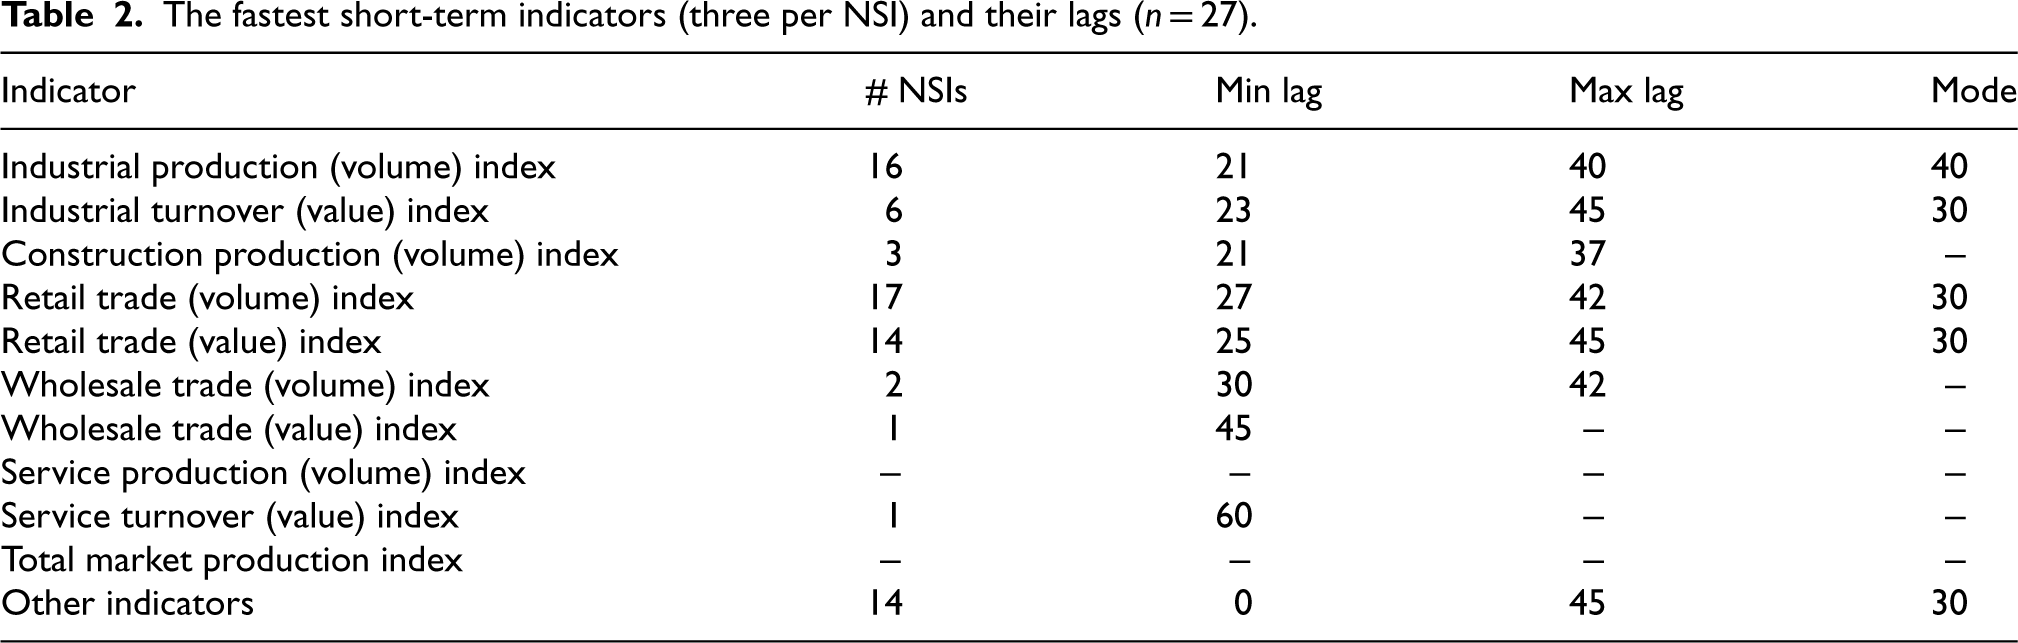
Among their three fastest monthly output indicators, the surveyed NSIs most often reported industrial production index with the modal publication lag of 30 days, and retail trade indices (volume and/or value) with the same modal publication lag (see Table 2). Eight NSIs also mention 14 other indicators with the publication lag between zero and 45 days. Included here were various proxy indicators of the monthly output (e.g., business tendencies, inputs used, consumer behaviour) as well as the Census Bureau Index of Economic Activity (IDEA) that is calculated and published every business day from 15 primary monthly economic time series. 34
The fastest short-term indicators (three per NSI) and their lags (n = 27).
The survey did not define a specific lag for real-time estimates but instead requested respondents to define the maximum acceptable delay for monthly indicators to qualify as real-time. Responses from 25 NSIs ranged from zero-day lag (immediate release at the end of the observed month) to 45 days, with a mean of 14.0 days. Four NSIs each identified 10, 15 and 30 days as the maximum acceptable lag. Other reported acceptable delays were 1, 5, 7, 14, 20, and 25 days.
Approximately two thirds or 17 of responding NSIs reported having no immediate plans for real-time monthly output indicators, while four NSIs are planning to start work in these indicators, two NSIs are developing them and three NSIs are already producing them (see Figure 2).
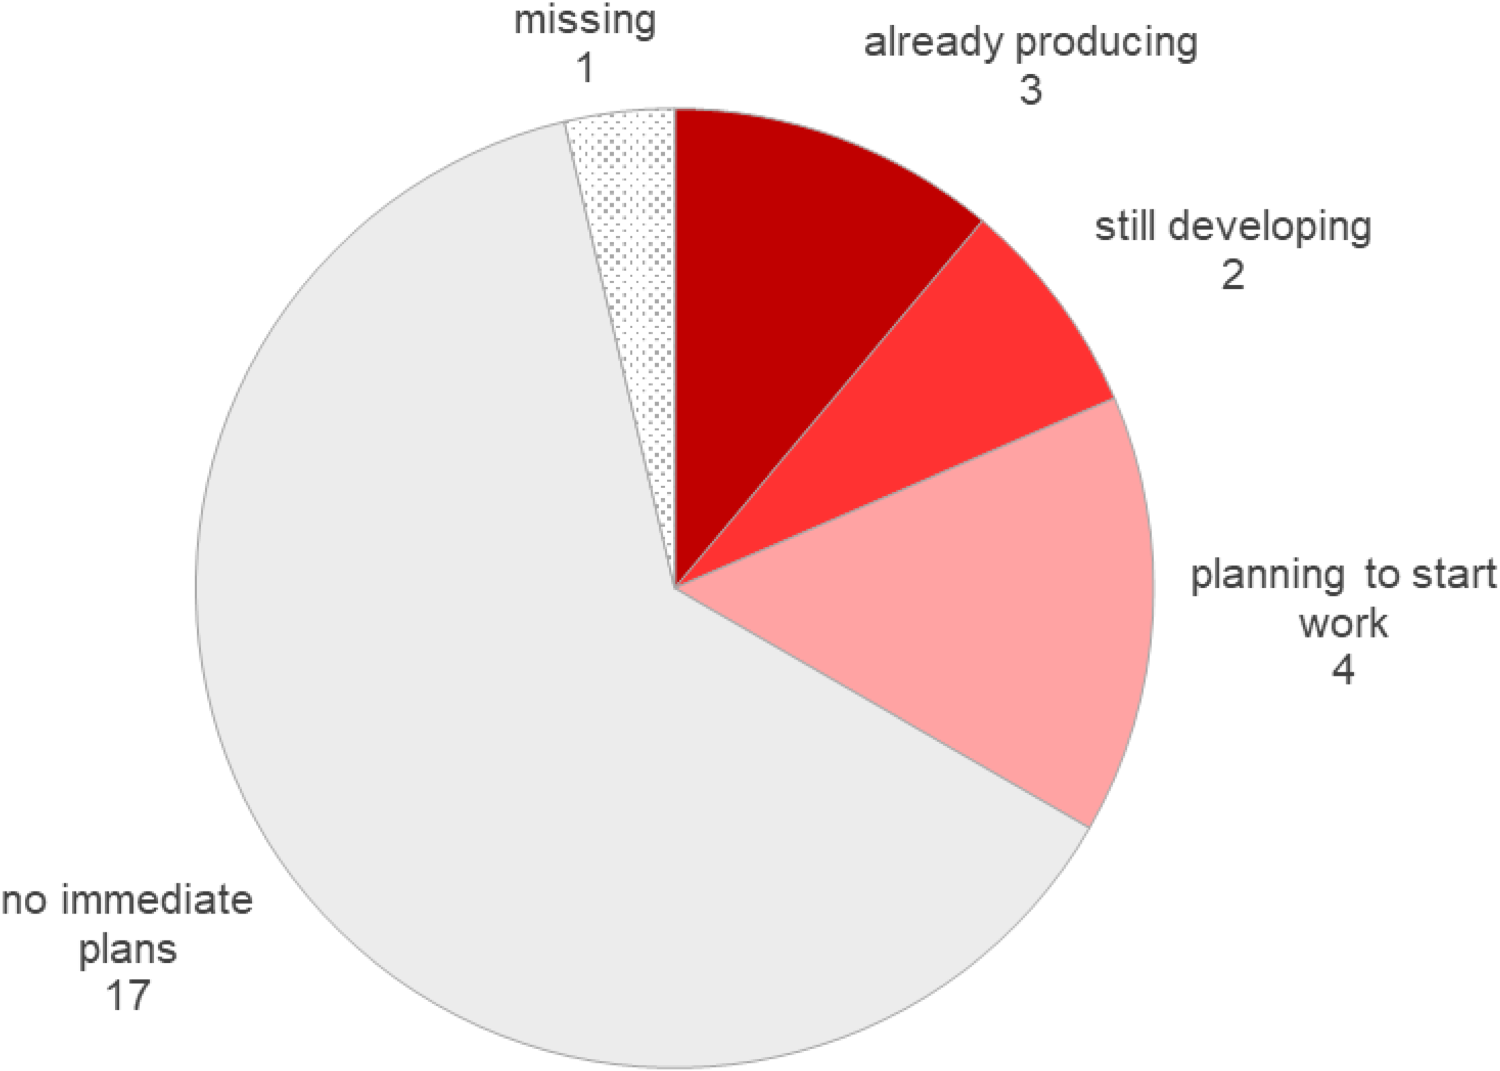
What best describes your organisation's position on real-time monthly output indicators? (n = 27).
Given the limited number of surveyed NSIs actively involved in real-time estimation, we were able to identify dynamic factor models (DFM) and Bayesian vector autoregression (B-VAR) as the only two time-series methods, alongside accelerated direct data collection.
We further investigated obstacles to real-time estimation (see Figure 3). Staff shortages were identified as the most critical impediment, with all NSIs reporting this as a challenge and 17 NSIs rating it as “extremely” hindering. Late availability of relevant data was also a significant obstacle, “extremely” hindering real-time estimation in 11 NSIs and “moderately” hindering it in further 10 NSIs. Budget constraints were identified as “extreme” obstacles for 9 NSIs and “moderate” obstacles for another 6, but were not considered an obstacle by 5 NSIs. Very present is also the lack of knowledge of methods for real-time estimation, but not at such intensity as it is deemed extremely hindering only in five NSIs and moderately hindering in six NSIs while about half of surveyed NSIs indicated it as a slight obstacle. When combining “extreme” and “moderate” obstacles, legal restrictions on sharing relevant data (reported by 2 and 8 NSIs respectively), unwillingness to share relevant data (reported by 1 and 9 NSIs respectively), too short time-series of relevant data (reported by 2 and 6 NSIs respectively) and concerns regarding users’ misinterpretation of indicators (reported by 2 and 6 NSIs respectively) were also noted. Adequate seasonal adjustment was not considered an obstacle by about half of the surveyed NSIs, and was not considered an “extreme” obstacle by any surveyed NSI. The lack of top management support was reported as “slight” or “moderate” obstacle by 4 NSIs each, making this the least reported problem.
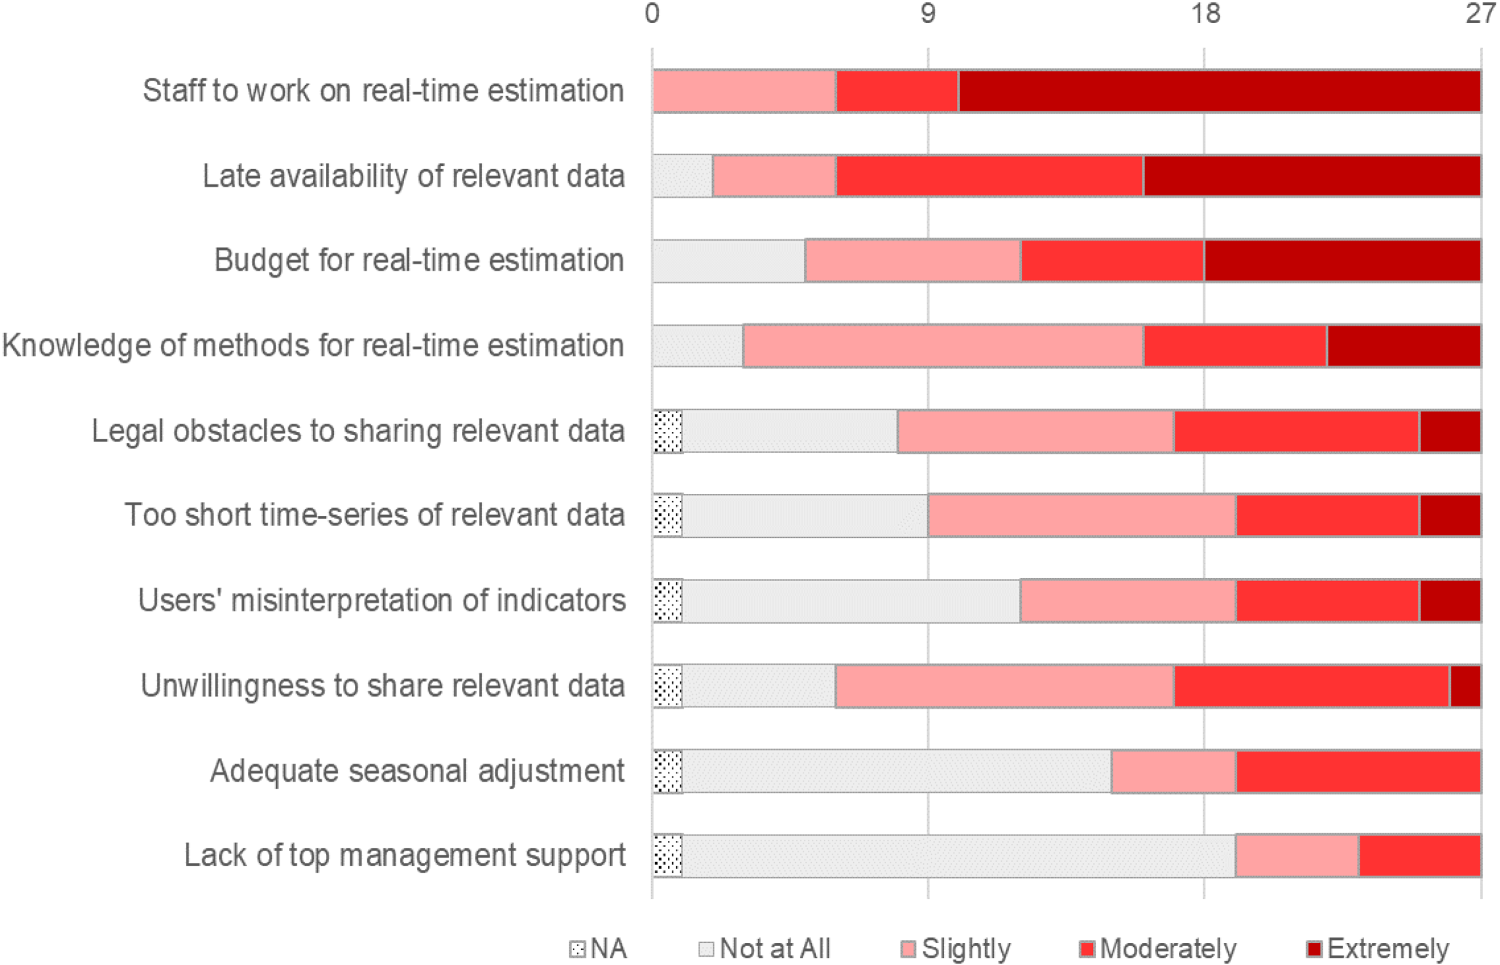
Do the following represent an obstacle to real-time estimation in your organisation? (n = 27).
Drawing upon survey findings, interview insights, and informal exchanges, we identified best practices for accelerating the release of short-term indicators: expedited direct data collection, utilisation of timely alternative data sources, and time-series modelling. Each is elaborated upon below.
Expedited direct data collection
The survey results revealed a notable difference in data reporting timelines between Poland and Slovenia. In Poland, businesses are obligated to submit data substantially faster after the end of the reference month, enabling the publication of short-term statistics such as industrial production index as early as approximately the 20th of the following month. As evidenced by the methodology description for the industrial production index on the International Monetary Fund's website (Special Data Dissemination Standard – SDDS), Polish reporting units are required to complete monthly electronic questionnaires via a dedicated portal by the 5th working day after the end of the reference month. 35 The provisional index is then published on the 14th working day following the reference month. The final index is released in the subsequent month, with any revisions, typically ranging from 0.1 to 0.5 percentage points, being attributable solely to adjustments in the deflator. For comparison, in Slovenia, businesses are required to submit their data by the 20th of the subsequent month, so up to 15 days later.
Data collection deadlines may be subject to modification due to methodological or institutional revisions (e.g., questionnaire revision or revision of compilation procedure), but may otherwise remain the same for extended periods. The case of Statistics Poland, however, raises an important question: has the increasing digitalization of business processes enhanced the ability of reporting units to adhere to shorter data submission deadlines, thereby promoting timeliness in short-term statistics?
Utilisation of timely alternative data sources
The UK Office for National Statistics (ONS) maintains a dedicated website for real-time economic indicators, updated weekly. 36 This website provides access to 19 regularly updated real-time indicators, derived from 14 distinct data sources. These indicators are categorized into four main areas: consumer behaviour, business and workforce, energy and housing, and transport. The majority of indicators draw upon data sources capable of providing data immediately or very shortly after the reference period, and which cover a significant proportion of their target population. To mitigate excessive volatility, some indicators utilise moving averages (e.g., the number of daily flights is presented as a 7-day average). Furthermore, certain indicators are derived from traditional surveys, specifically the Business Insights and Conditions Survey (BICS). BICS is a voluntary sentiment survey, introduced during the COVID-19 pandemic, now used to address pressing economic issues.
Statistics Canada provides a further example with its weekly Real-time Local Business Conditions Index, which aims to offer a timely signal of business activities by combining traditional and real-time data sources. 37 In cooperation with the German central bank Deutsche Bundesbank and the Federal Logistics and Mobility Office (BALM), the German Federal Statistical Office Destatis publishes daily truck toll mileage index that provides approximate indications of the development of industrial production in Germany at an early stage. 38
Time series modelling
Despite ongoing research and pilot applications of nowcasting within official statistics (such as those conducted by Statistics Netherlands 22 and the UK ONS 16 ), the integration of these methods into the routine production of short-term statistics by NSIs has yet to be fully established. Several factors contribute to this hesitation, including concerns over robustness of nowcasting outputs, technical challenges such as structural breaks in time series, as well as staff and budgetary constraints that limit the capacity to invest in new methodologies and infrastructure.
In contrast, central banks and other institutions have widely adopted more sophisticated nowcasting models.33,39 Nevertheless, even within these institutions achieving the right balance between model complexity and nowcasting accuracy remains a key challenge. The AR (preferably multivariate) models, that are typically considered a benchmark, behave very well in the calmer periods, however in times of increased volatility (Sparse) Dynamic Factor Models often prevail. Institutions are also typically confronted with mixed-frequency data problems, because usually not all relevant data are recorded at the same frequency (quarterly, monthly and daily data), as well as problems regarding proper seasonal and calendar adjustment.
In addition, it is important to carefully address the validation and evaluation of the models under consideration. Where applicable, validation helps to prevent overfitting or underfitting. An appropriate evaluation design must ensure that the model performance is assessed using data not employed during the model estimation.4,40 Moreover, attention must be paid to updating the model(s) with new data throughout the estimation and evaluation process. This aspect is particularly important for nowcasting, where real-time revisions and structural changes are common. We anticipate that models which are more robust and flexible—such as factor models, where different factors can be extracted across different (sub)periods—will prove to be better suited for such dynamic environments.
The institutions with well-developed nowcasting practice are also acutely aware of the risks associated with relying only on a single model or procedure. Therefore, thick modelling, or model averaging, is an established practice, within which reporting the forecasting or nowcasting results in a sense of confidence intervals is not unusual.
By emphasizing the pervasiveness of uncertainty NSIs and other institutions reporting statistical estimates can contribute substantially to raising public awareness and understanding of statistical information. Effective communication of uncertainty—including the need for revisions—can foster a more informed interpretation of statistical outputs and promote a broader understanding of the inherent limitations of real-time data.
Discussion and conclusion
Heightened economic volatility that necessitates rapid policy adjustments has intensified the need for timely economic indicators, prompting interest in rapid data releases. We investigated the possibilities for accelerating the data releases by conducting an international survey and targeted interviews with relevant experts and NSIs. Despite considerable efforts to engage NSIs and review publicly available materials (also on nonresponding NSIs), we acknowledge that this research may not represent the perspectives and practices of all NSIs or even surveyed NSIs (e.g., if our respondents were not aware of activities in other departments, especially national accounts). But it does give some insights into the current situation and possible solutions. In particular, we expected our survey to reveal more work on real-time estimation behind the walls of NSIs given the persistent high levels of global uncertainty, but it seems that NSIs need to prioritize other more urgent tasks in view of the staff shortage and other obstacles. The limited number of NSIs actively engaged in real-time estimation may hinder the development of best practices due to reduced opportunities for knowledge sharing and collaborative learning.
A significant advancement for NSIs would be the production of a comprehensive monthly output indicator, such as GDP or TMPI, immediately following the reference month, but such a feat presents important challenges. While nowcasting, predominantly used by central banks for quarterly GDP growth and monthly inflation, offers one pathway, research suggests two further solutions: enhancing data collection efficiency to reduce delays in direct data collection, and the development of partial or composite real-time indicators using recently available real-time non-survey data. However, timely traditional and alternative data sources both carry some potential risks or disadvantages. Introducing more stringent deadlines is likely to be faced with dissatisfaction among businesses that already complain about response burden. Alternative data sources may contain considerable noise and missing data, measure other concepts than those required by official statistics, and require different agreements with data owners.
Applying nowcasting techniques to established output indicators is the most demanding pathway with many questions on the best modelling approach still insufficiently answered. The issue of considerable lags of traditional input data may be attenuated by incorporating real-time non-survey data to combine the strengths of both data types. Nowcasting also entails revisions, which may be problematic for the NSI reputation and usage of statistics if users do not understand the purpose and nature of nowcasted indicators.
Future research should prioritize evaluating the robustness of these models, particularly during turbulent economic periods, and exploring statistical data blending techniques to exploit the advantages of timely alternative data sources. Moreover, high-quality data inputs remain paramount for the efficacy of all estimation methods employed by NSIs.
Footnotes
Acknowledgements
We gratefully acknowledge the invaluable contributions of all NSI respondents who completed our international survey. We also extend our sincere thanks to the interviewees from the Bank of Slovenia and the Institute of Macroeconomic Analysis and Development, as well as to several NSI interviewees for generously sharing their time and expertise. We thank the Statistical Office of the Republic of Slovenia and the Slovenian Research and Innovation Agency ARIS for their financial support of this research (V5-2346, P5-0441). We also appreciated the engaging discussions and insightful feedback received at the 7th International Conference of Establishment Statistics (ICES-VII) and Applied Statistics 2024 conference. Finally, we thank the associate editor and two reviewers for valuable comments.
Funding
The authors received financial support for the research from the Statistical Office of the Republic of Slovenia and the Slovenian Research and Innovation Agency ARIS (V5-2346, P5-0441).
Declaration of conflicting interests
The authors declared no potential conflicts of interest with respect to the research, authorship, and/or publication of this article.