
Abstract
This paper uses high frequency phone survey data from 4 Sub-Saharan African countries with high levels of informality (Ethiopia, Malawi, Nigeria, and Uganda) to analyze the impacts of the COVID-19 crisis on work (including wage employment, self-employment, and farm work) and income, as well as heterogeneity by gender, family composition, education, age, pre-COVID-19 industry of work, and between the rural and urban sectors. The paper links phone survey data collected throughout the pandemic to pre-COVID-19 face-to-face survey data to track the employment of respondents who were working before the pandemic and analyze individual-level indicators of job loss and re-employment as a way to measure changes in work in informal economies. Finally, it analyzes both immediate impacts, during the first few months of the pandemic, as well as longer-run impacts through February/March 2021. The findings show that in the early phase of the pandemic, women, young, and urban workers were significantly more likely to lose their jobs. A year after the onset of the pandemic, these inequalities disappeared, and education became the main predictor of joblessness. The analysis finds significant rural/urban, age, and education gradients in household level income loss. Households with income from non-farm enterprises were the most likely to report income loss, in the short run as well as the longer run.
Introduction
The COVID-19 pandemic and the measures taken to contain it (such as lockdowns, workplace and school closures, and mobility restrictions) severely disrupted most activities world-wide, including economic, social, and cultural spheres. In 2020, real GDP declined by 1.7% in Sub-Saharan Africa (SSA) and by 3.1% globally. 1 This contrasts the pre-pandemic growth projections made in October 2019, which anticipated a growth of 3.6% for SSA and 3.4% globally. 2 In addition, most countries, and especially African countries have faced large exchange rate depreciations and rising energy and food prices during 2020 and 2022, due to pandemic-related economic disruptions. 3 According to the World Bank estimation, in 2020, the COVID-19 crisis increased the number of people below the US$1.90-a-day poverty line between 119 and 124 million in the world and between 32 and 34 million in SSA. 4 Also, other projections show that while a global rebound was expected in 2021, poverty was expected to further increase in low-income countries, and at a much faster rate than was expected before the pandemic. For low-income countries, poverty was set to increase by 2.7% by 2021, compared to the pre-pandemic projection of a 0.2% increase (ibid.). These numbers for Sub-Saharan Africa were 2.5% compared to 1% as in their pre-pandemic projection, figures that were worrying even before the pandemic. 5
Beyond these aggregate indicators, systematic evidence of the socio-economic impacts of COVID-19 on households and individuals in low- and middle-income countries (LMICs) is limited, especially for SSA. Egger et al. (2021) analyzes phone survey data collected during April-June 2020 in nine LMICs, (In Africa (Burkina Faso, Ghana, Kenya, Rwanda, Sierra Leone), Asia (Bangladesh, Nepal, Philippines), and Latin America (Colombia).) including nationally representative samples for seven countries, for which they estimate that 25% to 87% of households lost income and 29% to 49% experienced a loss of employment. 6 The early socio-economic impacts of the pandemic in Ethiopia, Malawi, Nigeria, and Uganda, show that an estimate 77% of the population lost income during the pandemic, while 60% of the adult population experienced either moderate or severe food insecurity. 7
Regarding the labor market impacts of the pandemic and the measures taken to contain it, the International Labour Organization (ILO) estimates that working hours in SSA declined by 7.3% in 2020.(This indicator represents the percentage of hours lost compared to the baseline (the latest pre-crisis quarter, i.e., the 4th quarter of 2019, seasonally adjusted), adjusting for population aged 15-64.) 8 The estimated working hour losses in Nigeria and Ethiopia, the two most populous countries in Africa, were 9.0% and 8.5%. For virtually all countries in Sub-Saharan Africa, however, the ILO estimates are not based on survey data, but are extrapolated from Google Community Mobility Reports and the Oxford Stringency Index. 8 However, high frequency economic data are available for several African countries to aid this effort and to inform policies intended to mitigate the effects of the pandemic. For 12 SSA countries with high frequency phone survey data available it has been documented that 24% of workers stopped working in the period April-July 2020, ranging from 8% in Madagascar to 62% in Kenya. Furthermore, it has been shown that job loss in SSA was higher among women, young workers, highly educated workers, and urban workers, with a particularly significant urban/rural divide.9,10
In this paper, we use high frequency phone survey data from Ethiopia, Malawi, Nigeria, and Uganda to analyze the impacts of the COVID-19 pandemic in the context of high informal employment. We explore the impacts of the crisis on work (including wage employment, self-employment, and farm work) and income, as well as heterogeneity by gender, family composition, education, age, pre-COVID-19 industry of work, and between the rural and urban sector. These four countries represent 34% of the Sub-Saharan Africa population, and the share of informal employment is higher than 80% in all of them. These countries also have pre-existing face-to-face panel surveys from 2010 to 2019, which were used as a sample frame for the High-Frequency Phone Surveys (HFPS). The data allow us to track the employment of respondents who were working before the pandemic and analyze individual level indicators, such as job loss and re-employment. The job loss indicator reflects whether respondents who were working before the pandemic lost or left their job (whether by employer or worker decision) between the start of the pandemic and July 2020 (early-phase labor market impacts). For the sub-sample of respondents who lost their job during this period, the re-employment indicator captures whether they were working during at least one of the HFPS rounds between July and October 2020 (see section 3.3 for more details). We analyze both immediate impacts, during the first few months of the pandemic, as well as medium run impacts up to February/March 2021.
The pandemic and the measures taken to contain it negatively impacted the labor market in most countries, and particularly in SSA countries with high levels of informal employment. The job losses were driven by both demand-and-supply side factors. On the demand side, workplace closures, mobility restrictions, social distancing measures, and global economic slowdown specially affected sectors such as tourism, food services, and small business, sector were jobs required intensive contact. At the onset of the pandemic, four-in-five African workers resided in countries that experienced workplace closures. Therefore, movement restrictions in SSA likely had a much greater negative impact on the urban poor working in the informal sector, where activities typically rely more on face-to-face (FTF) interactions. 11 Simultaneously, on the supply side, many individuals, particularly women, were forced to leave their jobs to attend to care responsibilities and domestic activities, exacerbating pre-existing inequalities. 12
We find significant inequalities in the labor market impacts of the COVID-19 pandemic. During the first months of the pandemic, women were more likely to lose their job than men and job loss was concentrated among young respondents and in urban areas. These groups report a higher incidence of informal employment than adult men. Our evidence suggests that the disproportionate job loss among women was not, as one might assume, primarily driven by increased childcare demands related to school closures, but rather by the more intensive caregiving needs of younger children. For instance, in urban areas, women with children aged 0–4 were disproportionately affected, but not women with school-age children. This may be related to a greater demand for care of young children, usually assumed by women. 12
Assessing the impacts on the labor market up to February/March 2021, we find no significant gender, age, or rural/urban differences in job loss. Rather, education appears to be the key predictor of job status, with the least educated respondents being the most likely to be jobless in early 2021. These results are related to empirical evidence that women and low-skilled workers are also more likely to be employed in informal contact-intensive sectors. 11
Regarding income changes in the first months of the pandemic, we find that urban households and households with children were more likely to lose income, while older household heads and tertiary education are associated with a significantly lower probability of income loss. Furthermore, income from wages was more secure than income from non-farm enterprises (NFE), and female headed households were more likely to lose NFE income than male headed households. Analysis of income loss up to early 2021 in Nigeria and Uganda shows that NFE income as well as income from domestic remittances were the most vulnerable sources of income in the medium term.
Our analysis complements existing evidence on the proportion and number of households in low-income countries affected by income loss and food insecurity during the pandemic as well as previously documented changes in employment rates in developing countries during the first half year of the pandemic,9,10,13 and up to early 2021.14,15 We also contribute to a vast body of research into the labor market impacts of the pandemic in high-income countries.16–18
The rest of the paper is organized as follows: section 2 discusses the COVID-19 pandemic trends in Ethiopia, Malawi, Nigeria, and Uganda. Section 3 describes the data and descriptive statistics. Section 4 presents the methodology and results on labor outcomes in the first months of the pandemic as well as one year into the pandemic. Section 5 discusses the methodology and results on inequalities in impacts on household income. Section 6 concludes.
COVID-19 and government measures in Ethiopia, Malawi, Nigeria, and Uganda
On December 31, 2019, China reported a cluster of cases of pneumonias of unknown cause in Wuhan, and subsequently identified a novel coronavirus. 19 On January 13, 2020, Thailand confirmed and reported the first case of the new disease, called COVID-19, outside China and the World Health Organization warned about a possible wider outbreak. 19 On February 14, 2020, the first case in Africa was confirmed: a person from the Arab Republic of Egypt who had contact with someone who had recently traveled to China, and about week later, nine countries from Africa reported cases, including Nigeria. 20 On March 11, 2020, the WHO officially classified the COVID-19 outbreak as a pandemic and most countries began to impose restrictions and mitigation measures to prevent, and at the very least control, the spread of the virus. 21
Ethiopia reported 0.009 cases per million population on March 13, 2020. However, in June 2020, the virus began to spread at an alarming rate (see Figure 1), reaching 2,402 cases per million population by the end of June 2021. In Malawi, the outbreak started a little later, in April 2020, with confirmed cases slowly rising before reaching 344.1 per million population by the end of 2020 and escalating in early 2021. Nigeria had reported 0.005 cases per million population by the end of February 2020 and like in Malawi, this number had reached 465 per million population by the end of 2020. However, in Nigeria, cases grew relatively slowly during the first half of 2021. Uganda had only a few confirmed cases until mid-August 2020, when cases began to rise, reaching 810.5 reported cases per million population by the end of the year. In the course of 2021, Uganda experienced an uptick in infections reaching 1,748.5 cases per million population by the end of June.
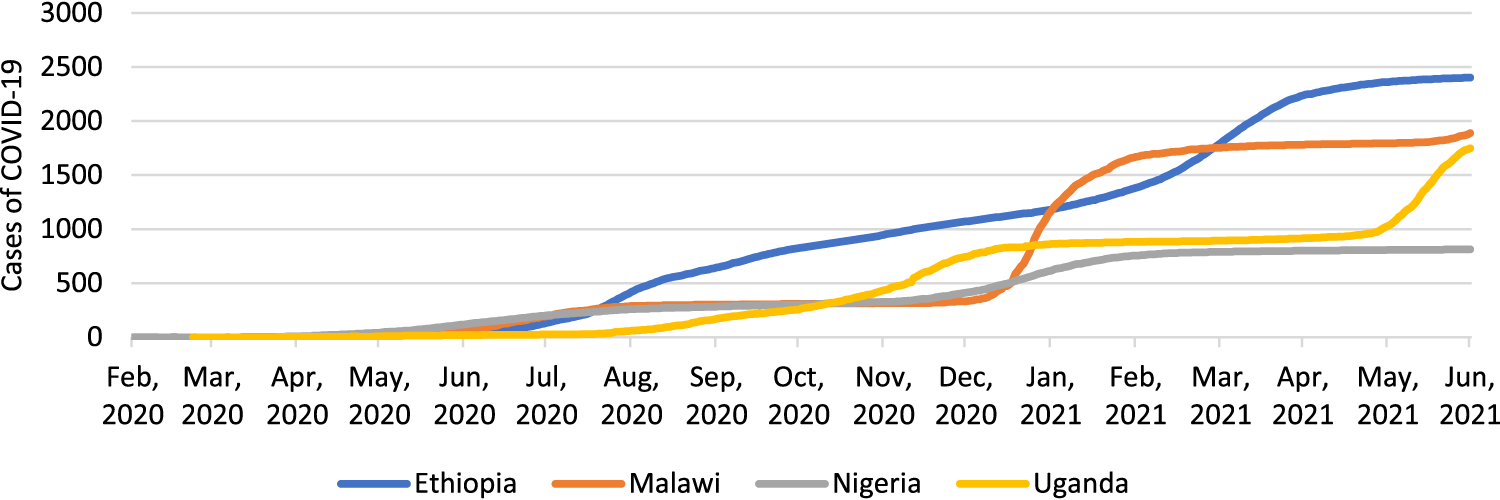
Total cases of COVID-19 per million population. Source: Our World in Data (2021).
To mitigate the spread of COVID-19, countries around the world introduced a range of measures, such as lockdown, workplace and school closures, mobility restrictions, and social distancing practices, and Ethiopia, Malawi, Nigeria, and Uganda were no exception. Appendix B describes the government responses in each country. Figure 2 shows the Oxford's COVID-19 Government Response Stringency Index, (The COVID-19 Government Response Stringency Index is calculated by the Oxford COVID-19 Government Response Tracker (OxCGRT), which collects publicly available information on 20 indicators of policy responses that governments have taken to respond to the pandemic, such as school closures and travel restrictions. It includes information on 180 countries. See more here: https://www.bsg.ox.ac.uk/research/research-projects/covid-19-government-response-tracker) a composite measure based on nine response indicators, which include school closures, workplace closures and travel bans, rescaled to a value from 0 to 100 (100 = strictest) (The nine indicators included are the following: (1) School closings, (2) Workplace closings, (3) Cancelling public events, (4) Restrictions on gatherings, (5) Closing of public transport, (6) Stay at home requirements, (7) Restrictions on internal movement, (8) International travel controls, and (9) Presence of public information campaigns. More details about the methodology can be found here: https://www.bsg.ox.ac.uk/sites/default/files/2020-12/BSG-WP-2020-032-v10.pdf). 21
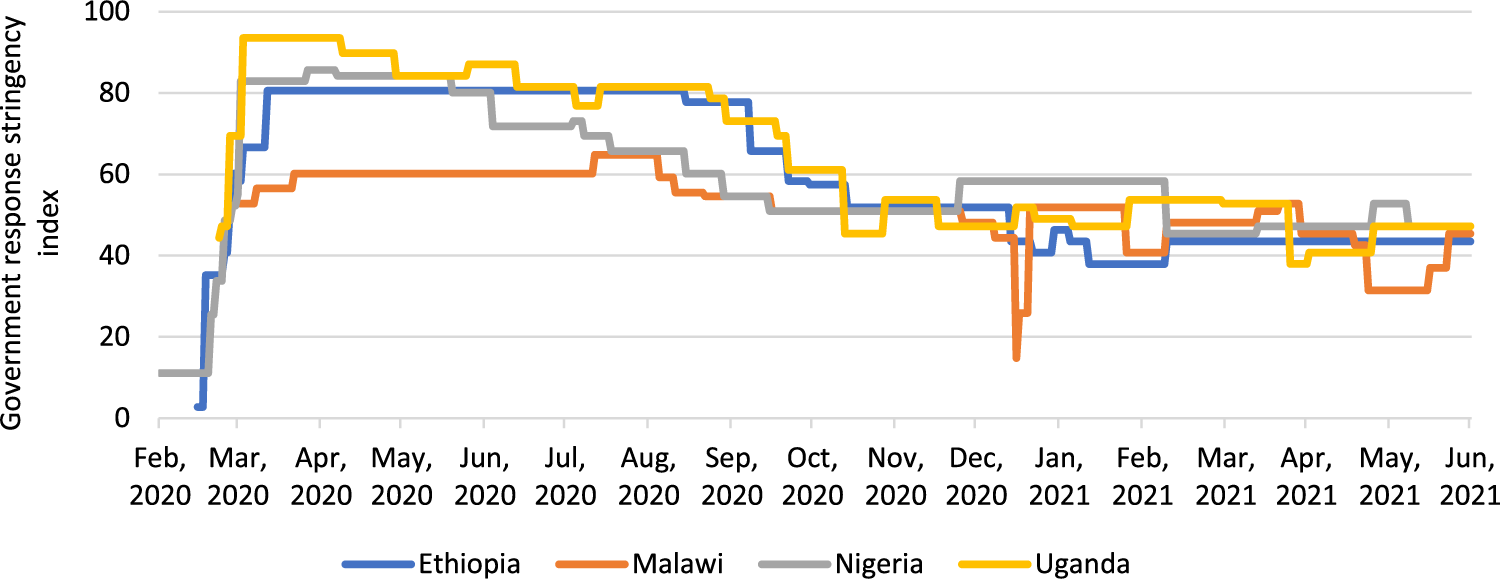
Government response stringency index. Source: Oxford COVID-19 Government Response Tracker (2021).
All four countries had implemented measures to contain the spread of the pandemic, including mobility restrictions, closures, and social distancing by the end of March 2020, however, the levels of stringency varied across countries. Malawi had the least stringent measures, as the government suggested that people stay home but did not implement a full lockdown, and public transportation was still running as usual throughout 2020. Uganda had the strictest measures, while Nigeria started with stringent measures, but eased restrictions relatively early.
In each of the four countries, the government took steps to support citizens through new or existing cash transfer or public works programs. An example is seen in the expansion of social programs, frontloading payments, and supporting in-kind food distribution programs. 22 In Nigeria, the social registry was increased by 1 million households to 3.6 million to help cushion the effect of the lockdown; Ethiopia expanded its food assistance to 15 million people vulnerable to food insecurity and currently not covered by the Productive Safety Net Program (PSNP); Uganda implemented measures to support the households, including food to the vulnerable and funding for agriculture inputs and entities that support the sector; and Malawi implemented an Emergency Cash Transfer Program of about $50 million. 23 However, expanding social programs alone is unlikely to significantly reduce the economic effects of the pandemic, given that the coverage and targeting of pre-COVID-19 social protection programs are extremely low. Less than 16% of individuals receive social assistance from the state and only 24% of those who receive this support are in the bottom 20% of the income distribution. 24 Job protection or business support policies were very limited, especially in comparison to similar programs implemented in high-income countries. This is due to the informal nature of the majority of jobs and businesses in these economies. In a study of households’ coping strategies between April and September 2020 in the same four countries, it has shown that households mostly relied on savings and reduced food consumption to cope with health and economic shocks. Very few households reported receiving any kind of social assistance. Only in Uganda, only every fourth household reported received assistance (mostly in-kind) by August 2020. 25
Most of the employment in Sub-Saharan Africa is informal (86.5% in 2023). Women, the youth, and the population with low levels of education tend to be more concentrated in the informal sector. 26
In this study, we include Ethiopia, Malawi, Nigeria, and Uganda accommodate 34% of the Sub-Saharan Africa population and as the rest of the countries in the region, informal employment represents a large share of total employment. Figure 3 shows that, as of 2021, Uganda reports 95.2% of their employment classified as informal, followed by Nigeria (93.9% in 2022), Malawi (87.1% in 2013), and Ethiopia (85.2% in 2021).
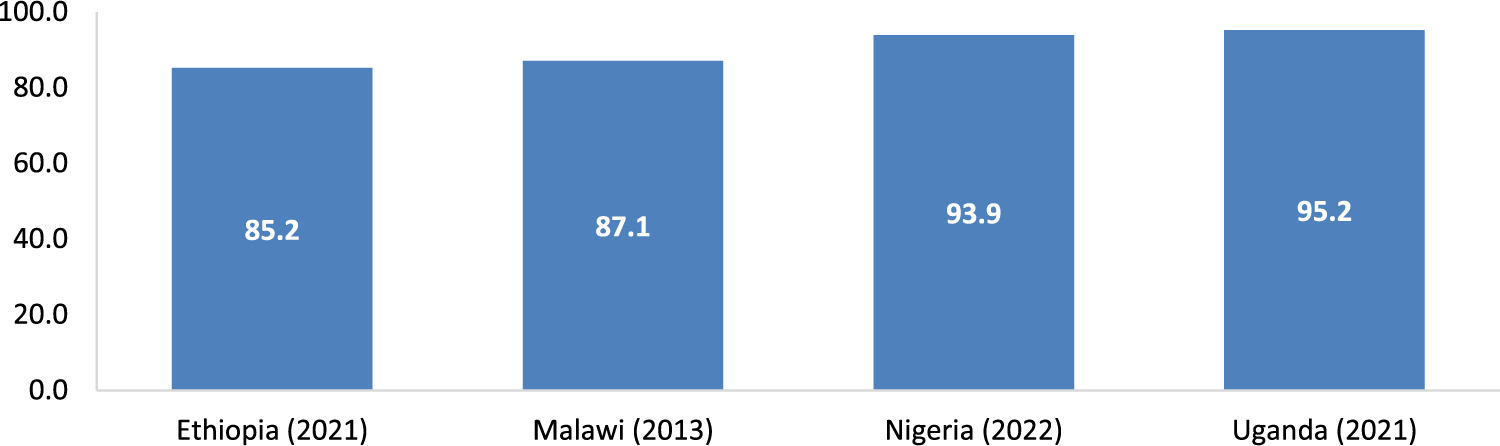
Proportion of informal employment in total employment (%). Source: ILO (2024).
Our analysis combines Living Standards Measurement Study Integrated Surveys on Agriculture (LSMS-ISA) pre-COVID-19 surveys with several rounds of HFPS conducted during the pandemic in Nigeria, Ethiopia, Malawi, and Uganda. In this section, we describe the data sources and present summary statistics of key employment and income indicators.
The LSMS-ISA project is an initiative funded by the Bill and Melinda Gates Foundation (BMGF) that supports governments in eight African countries: Ethiopia, Malawi, Mali, Niger, Nigeria, Tanzania, Uganda, and Burkina Faso. The goal is to generate several rounds of nationally representative panel surveys with a multi-topic approach, designed to improve the understanding of the links between agriculture, socioeconomic status, and non-farm income activities. This paper uses data from the latest rounds of LSMS-ISA surveys from four countries: Ethiopia (September/ December 2018 and June/August 2019), Malawi (April 2019 to March 2020), Nigeria (July/August 2018 and January/February2019), and Uganda (March 2019 to February 2020).
In particular, we use respondents’ industry of work from the LSMS-ISA data to complement the HFPS data for our analysis of the labor market impacts of COVID-19. Here, we also summarize the LSMS-ISA data on employment status disaggregated by gender to describe the pre-COVID-19 labor market in each of the four countries.
The pre-COVID-19 LSMS-ISA surveys show that labor force participation was between 58% and 70% before the onset of the pandemic (Figure 4); (As correctly pointed out by a reviewer, the 19th International Conference of Labour Statisticians (ICLS) in 2013 introduced a new framework based on the first international statistical definition of work and a narrower definition of employment. Work includes paid and unpaid work performed for use by others or for own use, whereas employment is a specific form of work done for pay or profit. This means that the narrower employment definition excludes subsistence farming and subsistence foodstuff production as well as other own-use production previously included in employment. We followed the 19th ICLS for the definitions included in this paper.) participation being highest in Uganda and lowest in Ethiopia. In all four countries, the labor force participation of women was below that of men and the gender difference was largest in Ethiopia, with 20% of men and 40% of women outside the labor force.
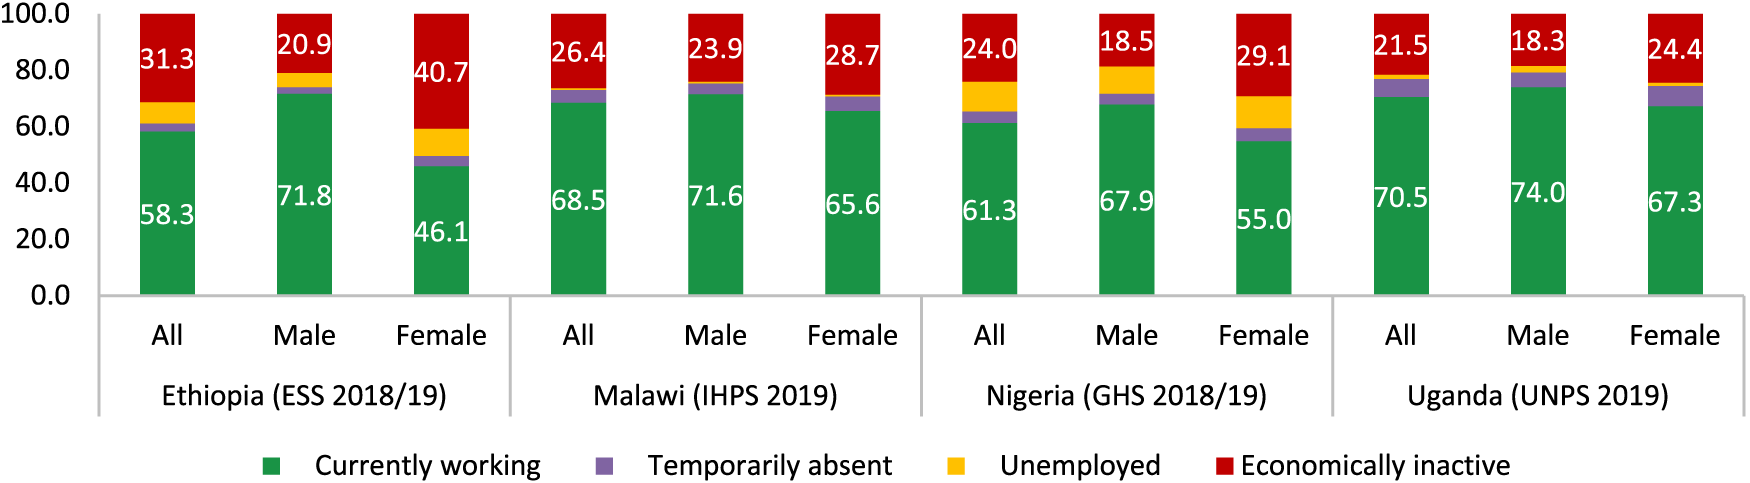
Economically active and inactive population by sex. (% of population 15-64 years old). Source: Pre-COVID-19 face-to-face LSMS-ISA surveys.
In all four countries, a large share of the working population is employed in the agriculture sector. Before the pandemic, Nigeria had the most diverse workforce, with four out of ten workers in the agriculture sector, and two out of ten in commerce (Figure 5). In Ethiopia, almost eight out of ten workers were in agriculture.
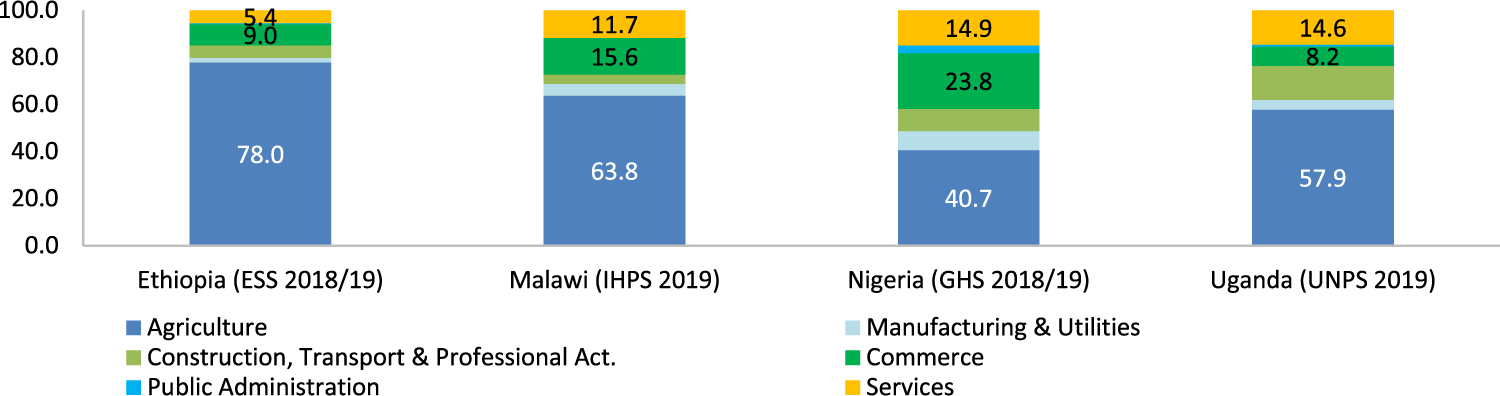
Working respondents by economic sector. (% of population 15-64 years old currently in employment). Source: pre-COVID-19 face-to-face LSMS-ISA surveys.
We use data from HFPS in Ethiopia, Malawi, Nigeria, and Uganda. The sampling frame for these phone surveys was the most recent nationally representative LSMS-ISA-supported national longitudinal household survey. This enables a methodologically sound comparison with the pre-COVID-19 survey data. We chose these four countries because the latest face-to-face survey was conducted in 2019.
These surveys have been designed to track the social and economic implications, as well as household behavioral responses to the pandemic, with sections on Knowledge, Behavior, Access to Services, Employment, Income Loss, Food Security, etc. The LSMS-ISA COVID-19 HFPS were implemented in Ethiopia, Malawi, Nigeria, and Uganda. In each country, the aim has been to conduct monthly phone interviews over a period of 12 months.
Phone surveys have the advantage of creating opportunities and learning experiences for the direct and timely analysis of developments in dynamic labor markets, however, there are several drawbacks as well. These include (i) selection bias since households that do not own a phone are automatically excluded; (ii) non-response bias that may arise particularly in longitudinal studies; (iii) heterogeneity in phone coverage across population groups and regions; and (iv) a limited scope for verifying the accuracy of answers. Phone surveys face restrictions with respect to the questionnaire design; since interview times are limited, phone surveys must therefore rely on short, simple questions with similarly short response options. In addition, interviews have to rely on data provided by one representative household member, usually the “household head”, because it will be cumbersome to try to interview all household members. These drawbacks need to be actively considered when implementing the surveys and analyzing the data collected. However, these potential issues also need to be weighed against the alternative of not conducting interviews during the crisis. (For example, some authors analyzed the survey sample and selection process of the HFPS used in this paper and found that the contacted samples were biased toward wealthier households with higher living standards. 29 The coverage rates (i.e., the share of households in the pre-COVID-19 sample with phone numbers) for Ethiopia, Malawi, Nigeria, and Uganda were 79%, 73%, 99%, and 73% respectively. The response rates (i.e., the households interviewed as a share of the initial HFPS sample) were 60%, 74%, 65%, and 93% respectively.)
For each of the four countries, Appendix Table A1 presents characteristics of the sample of households included in the last face-to-face survey and compares it to the subsample of households that were included in the first round of the HFPS. The samples are similar in terms of household and household head characteristics, though there are some differences in household head education and in asset ownership, especially in Ethiopia. Furthermore, household heads and their spouses are overrepresented relative to other household members in the HFPS and as a consequence, employment rates in the sample are higher than in the full population when only one respondent is interviewed. Using different weighting strategies to correct for potential bias, recent empirical evidence has shown that sampling bias is of similar magnitude across gender, education, and urban/rural groups, so that the HFPS can accurately capture inequalities in employment impacts between these groups, which is the focus of our analyses. 9 Still, in some countries, given that most of the respondents are heads of household, the HFPS may significantly overestimate employment for young workers compared to adults, thereby underestimating the employment penalty faced by youth that are not head of households. This is important to keep in mind as it can affect our estimates of inequalities by age groups. In contrast face-to-face survey often have a more balance representation of household members. 27 In summary, our results are best seen as reflecting the situation of household heads (and their spouses), rather than the general working age population in these countries.
For the analysis in this paper, we use HFPS data collected between April 2020 and March 2021. Due to differences in the timing of the surveys, this period covers 10 rounds for Ethiopia and Nigeria, 8 rounds for Malawi, and 5 rounds for Uganda. The dates of data collection in each country, sample size and average stringency index for each round are presented in Appendix Table A2.
Variables and descriptive statistics
Using the LSMS-ISA and HFPS data we construct several indicators to analyze early-phase and one-year labor market impacts and income loss. Descriptive statistics on all outcome indicators and household and respondent demographics are reported in Appendix Tables A3-A4.
To measure the early-phase labor market impacts of the COVID-19 pandemic, we analyze three indicators: job loss, re-employment, and change of industry. Job loss captures whether respondents who were working before the pandemic (as self-reported, retrospectively, during the first HFPS round) lost their job between the start of the pandemic and July 2020. This is measured using all HPFS rounds implemented up to July 2020. (In each HFPS round, respondents were asked whether they worked during the past week. In round 1, respondents who worked at the time of the survey were not asked about their pre-pandemic employment status, so we assume that everyone employed at the time of the HFPS first round was also working before the pandemic. HFPS data for Latin America show that this assumption has minor effects on the job loss estimates, because few people began working immediately after the pandemic started.) 11 Note that job loss includes the loss of paid employment, but also loss of other types of work, including self-employment and family farming. For the sub-sample of respondents who lost their job during this period, the re-employment indicator captures whether they were working during at least one of the HFPS rounds between July and October 2020. And finally, for those who were re-employed, we construct an indicator for “changing industry” by comparing their industry of work in the last pre-COVID-19 face-to-face LSMS-ISA survey with their industry of work upon re-employment. We distinguish between agriculture (including mining); manufacturing and utilities; construction, transport and communication, financial and business services; commerce; public administration; and other services.
The early-phase labor market indicators are summarized in Table A3 and Figure 6. Among respondents who worked pre-COVID-19 (81% of all respondents), on average 34% lost their job in the first four months of the pandemic. This does not include loss of hours or earnings for those who did not lose the job altogether. The rate of job loss was much higher in Nigeria (61%) compared to the other countries (18% to 30%). Re-employment was quite high in each country, with 75% to 93% entering work again at some point between July and October 2020. The average number of months without work for people that lost their job between April and July 2020 in Nigeria and Ethiopia was 1.2 months. (Unlike in Ethiopia and Nigeria where the surveys were conducted every month, in Malawi and Uganda the surveys were not conducted as frequently.) But a large share of re-employment involved a change in industry, especially in Ethiopia. These rates are particularly high given the fact that we distinguish only six industries. For the four countries, 38% of respondents were re-employed in an industry that is different from the one in which they were working prior to the onset of the pandemic.
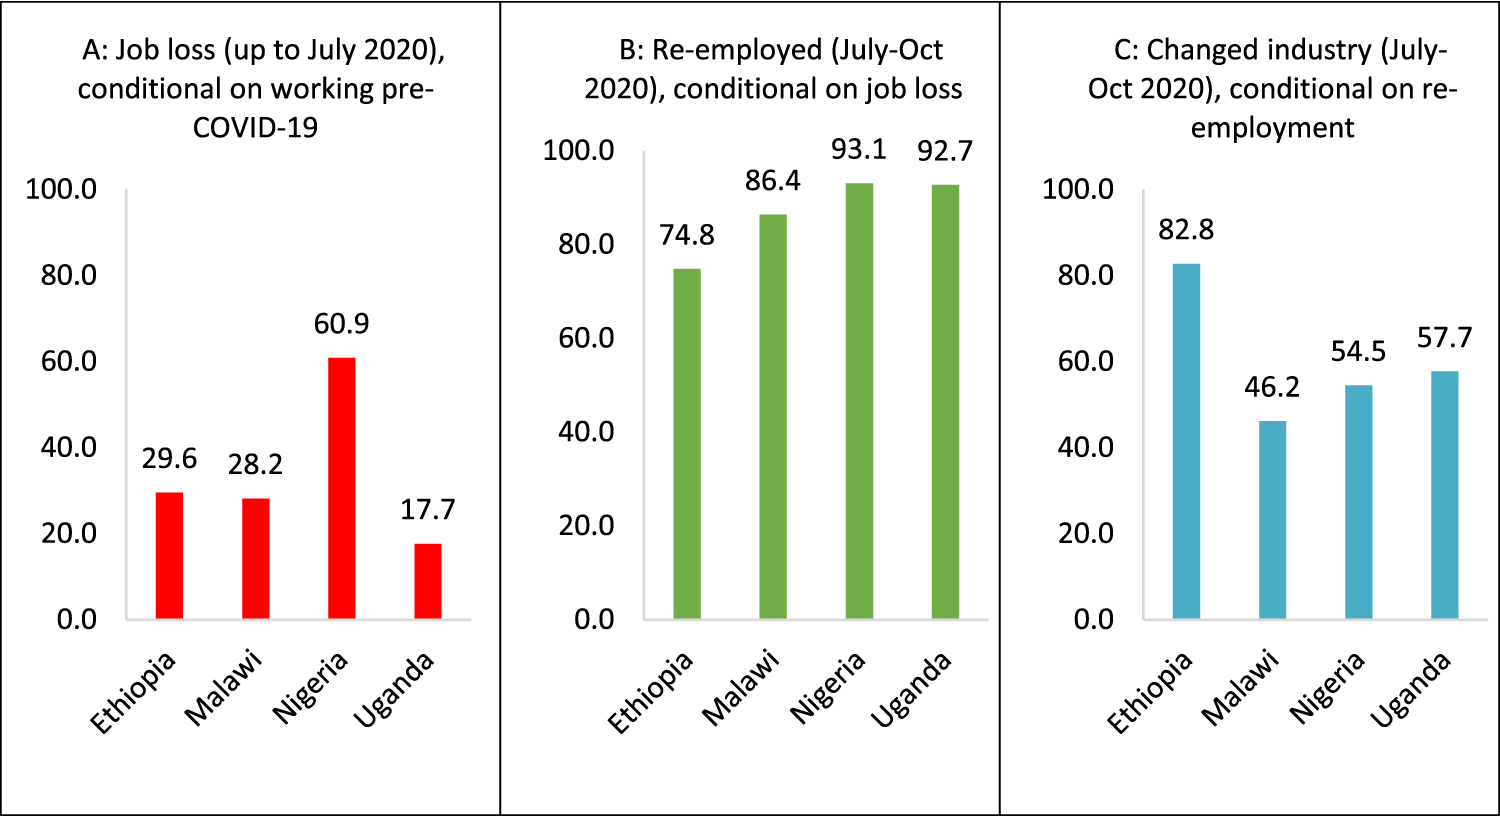
Early-phase labor market indicators. Source: Figure 6A is based on HFPS R1-3 for Ethiopia and Nigeria, R1-2 for Malawi, and R1 for Uganda. Figures 6B and 6C are based on HFPS R1-6 for Ethiopia and Nigeria, R1-4 for Malawi, R1-3 for Uganda. Figure 6C also uses pre-COVID LSMS-ISA surveys for industry of work.
To analyze the medium-run impacts on the labor market, we construct 3 additional indicators. First, one-year job loss captures whether the respondent was jobless at any point between the start of the pandemic and February/March 2021, based on all available HFPS rounds up to March 2021. The second indicator is joblessness in February/March 2021, which captures whether the respondent was jobless a year after the onset of the pandemic. And finally, we measure the total number of months without work during the first year of the pandemic. (For the case of Malawi and Uganda we used the rounds that were closer in timing to the Nigeria and Ethiopia surveys for months when there was no data collection. This assumption was applied for May 2020 in Malawi, and for May 2020 and July 2020 in Uganda.) As for the early-phase job loss indicator, the one-year indicators are all conditional on the respondent working before the pandemic, as self-reported in the first HFPS round. Although it is less clear to what extent the one-year indicators capture the impacts of the pandemic, as opposed to usual (seasonal) fluctuations in work, they allow us to assess how the labor market developed during the first full year of the pandemic.
An important caveat is that there was substantial attrition in the HFPS in all countries. For the one-year labor market indicators we use only the sub-sample of respondents who participated in all of the HFPS rounds up to March 2021. In this balanced panel, we lose 52% of respondents from the early phase job loss sample (i.e., those surveyed in R1 who were working before the pandemic). However, attrition is not significantly related to early-phase job loss or income loss (see Appendix Table A5), which is somewhat reassuring that the one-year labor market indicators are not biased due to selective attrition. We do see those women - particularly women with young children – are less likely to be included in the medium-run sample, as well as younger respondents and respondents in households with multiple income sources. Summary statistics for the medium-run sample are reported in appendix table A4.
Figure 7 summarizes the one-year labor market indicators. Job loss over the full year (Figure 7A) ranged between 30% and 73%. In all countries except Ethiopia, the one-year rate of job loss is about ten percentage points higher than early-phase job loss. This indicates that while most job loss occurred in those first few months of the pandemic, it continued after July 2020. This is relevant because for many of households not having income sources from labour for more than 6 months can drive increases in food insecurity and important impacts to their wellbeing. By February/March 2021, 14% to 23% of respondents who were working pre-COVID-19 were out of work (Figure 7B) and on average, pre-COVID-19 workers were jobless for around 2 months during the first year of the pandemic (Figure 7C).
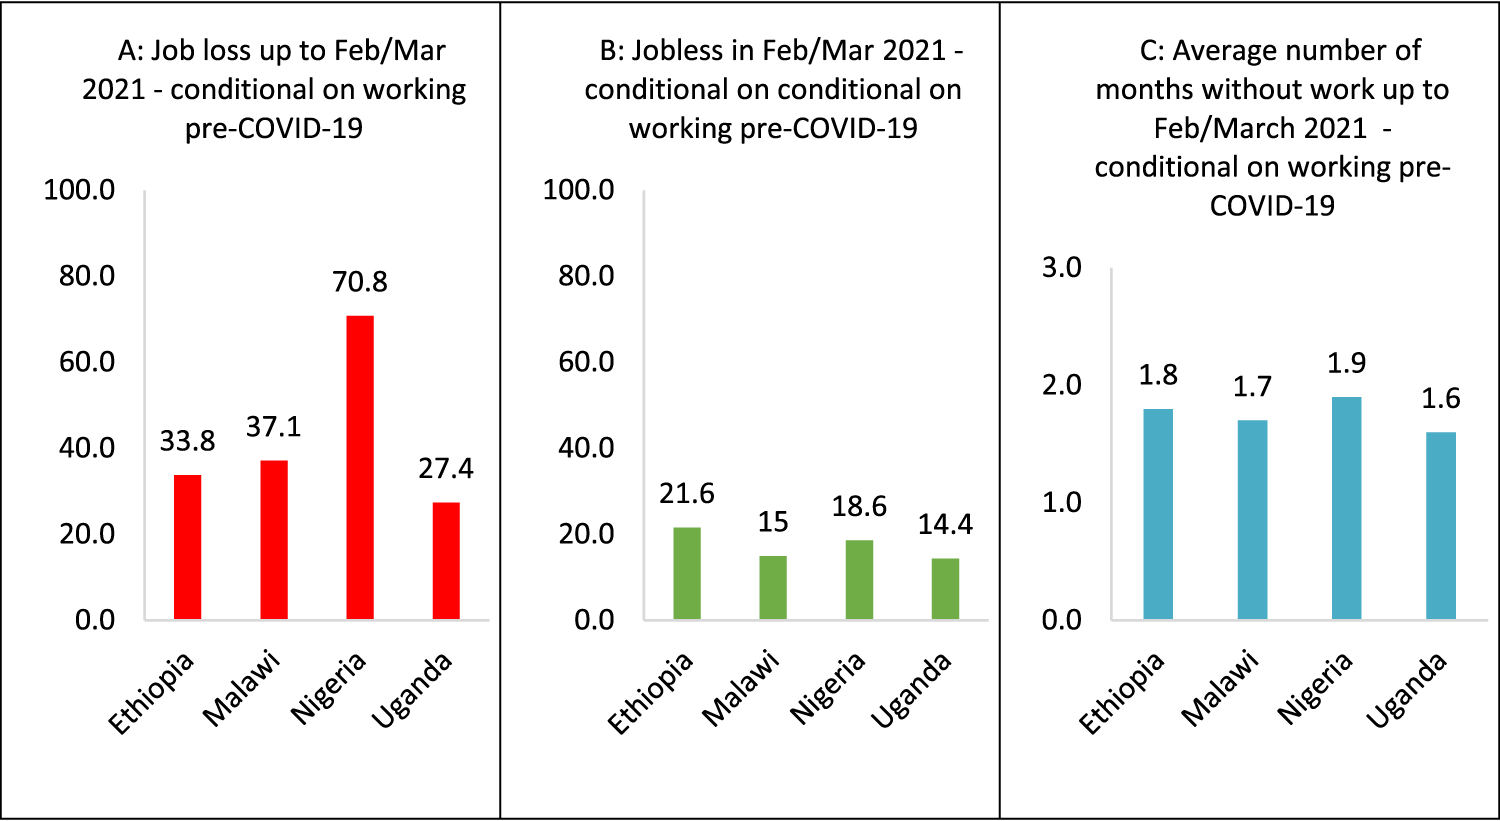
One-year labor market indicators. Source: Job loss and months without work are based on HFPS R1-10 for Ethiopia and Nigeria, R1-8 for Malawi, R1-11 for Nigeria, and R1-5 for Uganda. Joblessness is based on the latest of these rounds per country.
In addition to work status, the HFPS collected data on income loss. In the first HFPS round, respondents were asked whether household income had increased, stayed the same, or decreased since the onset of the pandemic. Figure 8 summarizes these results and descriptive statistics are included in appendix table A3. Approximately 80% of the households in Malawi, Nigeria, and Uganda and 46% in Ethiopia, reported a decrease in their total income following the COVID-19 outbreak. Around 40% of households in Ethiopia lost income from farming, compared to 60% to 73% in the other countries. The share of households that experienced a decrease in income from non-farming family enterprises (NFE) surpassed 80% in all the countries analyzed. Finally, almost 60% of households reported a reduction in wage income in Malawi, Nigeria, and Uganda, compared to 34% in Ethiopia. These numbers clearly indicate that all types of income sources were heavily affected and that NFE income was particularly vulnerable.
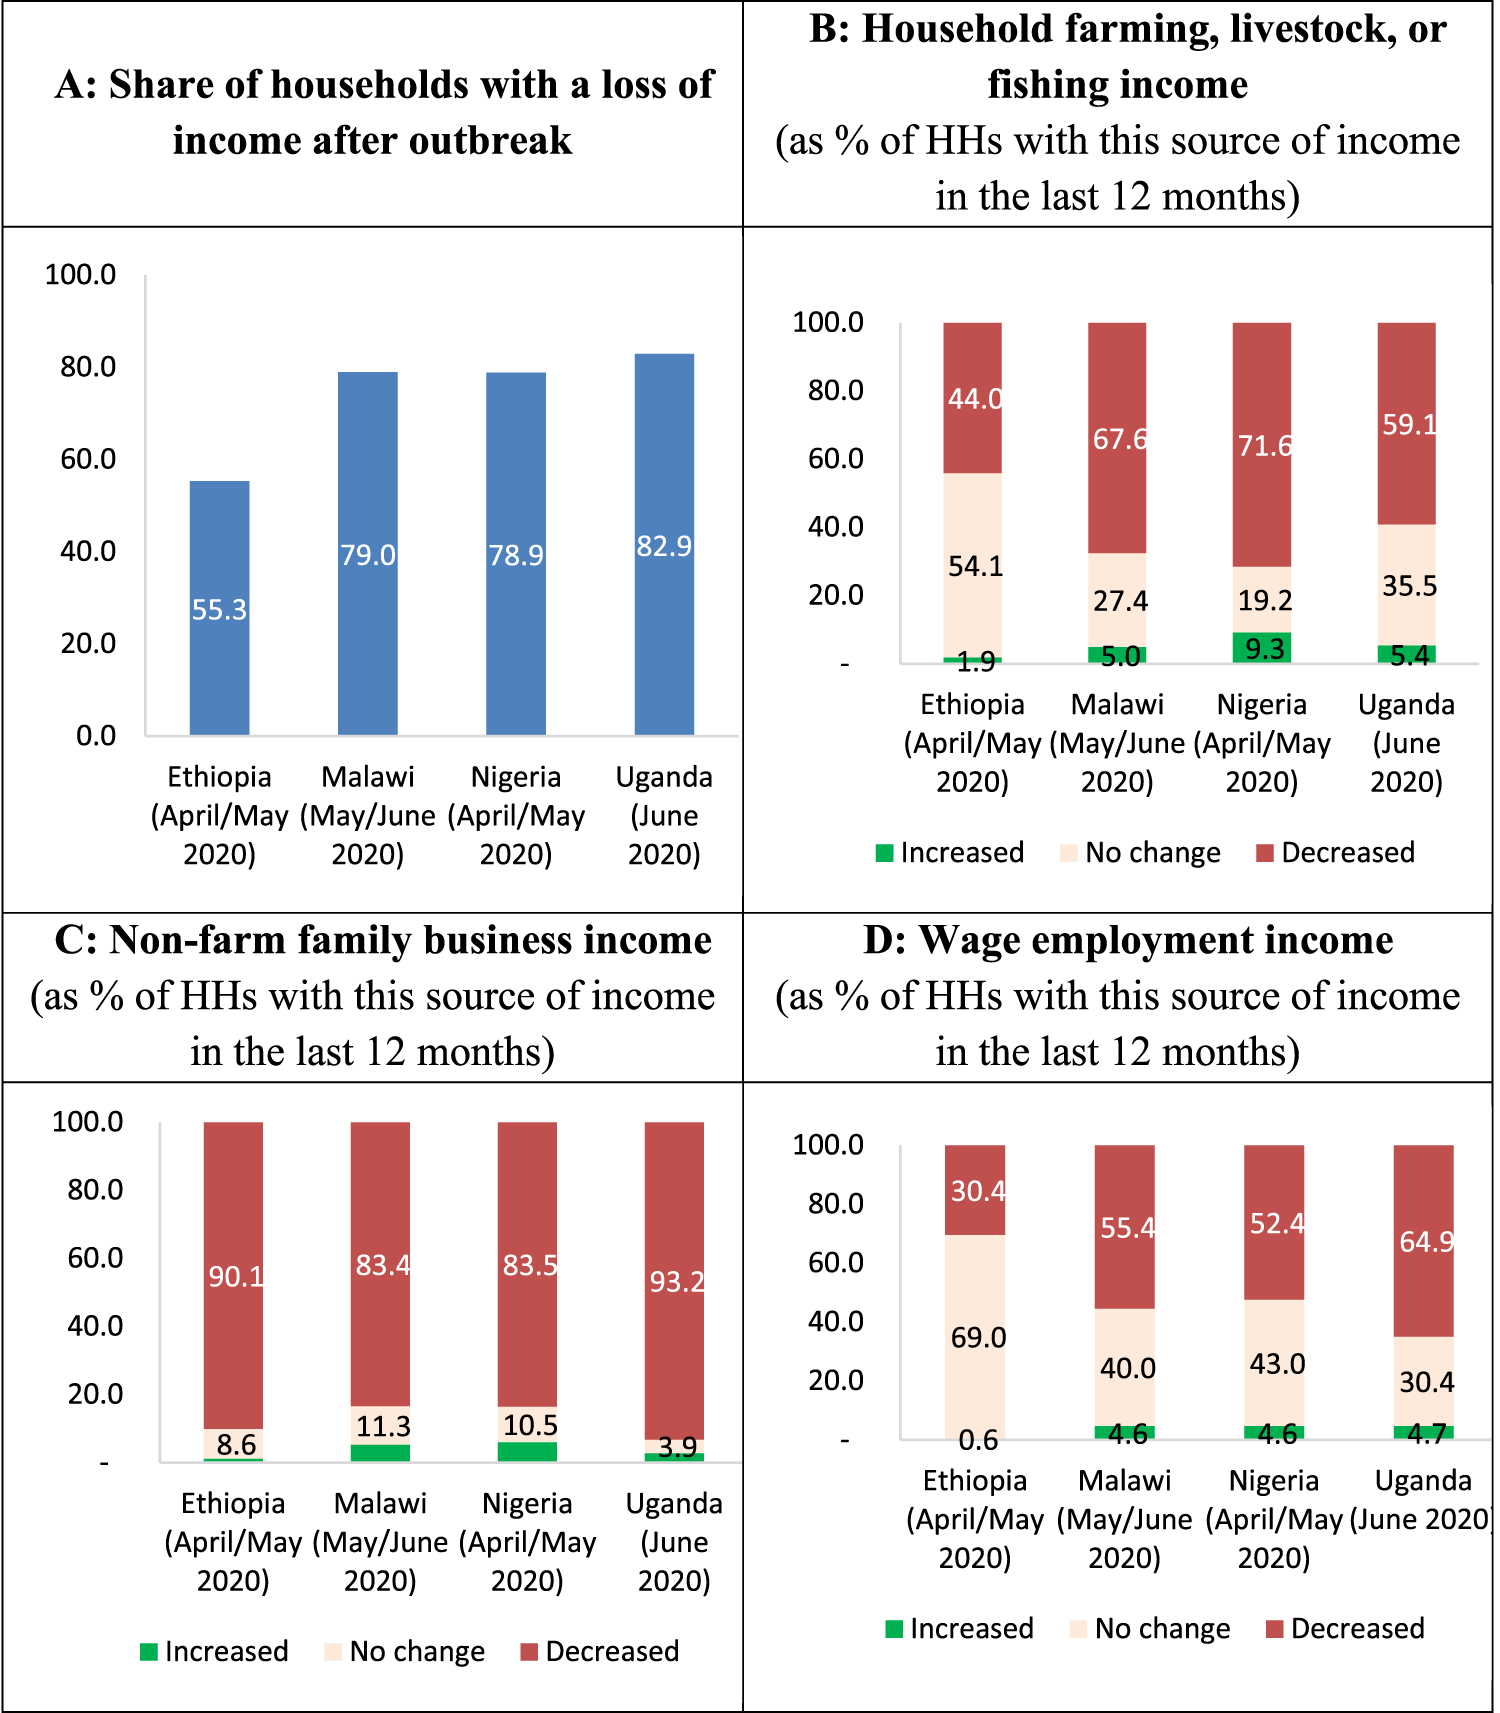
Changes in income after outbreak. Source: HFPS Round 1.
While respondents were asked to compare current and pre-COVID-19 income in the first HFPS round; in subsequent rounds, they were only asked to compare their current household income to income at the time of the previous interview, but not to income before the pandemic. (Recent evidence has shown that the proportion of households reporting income loss relative to the previous HFPS round (typically about a month ago) declined in more recent HPFS rounds in the four countries that we analyzed. Also, it has shown that over time, NFE income losses remained most common and by August 2020, more than 50% of households still reported losing NFE income compared to the previous phone survey.) 24 Two exceptions are Nigeria's HFPS Round 9 (in January 2021), which asked households to compare their income in the period August 2020-January 2021 to their income in the period August 2019-January 2020; and Uganda's HFPS Round 5 (in February 2021), when households were asked to compare their current monthly income to their average monthly income in the year before COVID-19. We use these data to analyze inequality in income loss over the one-year period after the outbreak of the pandemic in Nigeria and Uganda.
Methodology
To shed light on how different groups were affected in terms of employment, we test whether changes in the early-phase and long-run labor market outcomes described above differ across types of workers and households. First, we regress the relevant work indicator on the respondent's gender, age, education level, family composition, (The presence of children aged 0-4 and age 5-18, as well as interaction terms with gender.) urban vs rural location, and income diversification (whether the household had income from more than one type of source). We then additionally control for pre-COVID-19 industry of work, which is taken from the most recent face-to-face LSMS-ISA survey.
As described in the previous section, the samples are restricted to respondents who were working before the COVID-19 outbreak. To assess common patterns, we run OLS regressions on the pooled sample of respondents across the four countries, controlling for country fixed effects and with standard errors clustered by enumeration area. The main specification used in the paper is the following:

Results: early-phase impacts
Estimation results for the early-phase labor market outcomes are reported in Table 1. In the early phase of the pandemic, women were significantly more likely to lose their job than men (column 1). This finding is in line with the gender difference in employment trends across 40 developing countries, documented by recent research, although the disadvantage for women is more pronounced in our sample. 9 Other studies have also found disproportionate impacts on female workers for China, Italy, UK, and US 28 ; for Spain 18 ; and for South Africa. 29 Likewise, other research has found that women's employment rates declined faster than men's in many advanced and emerging economies, although the gender gaps typically disappeared after three to six months. 30 For example, in the US, the negative impact on employment was larger for women, but the gender gap had disappeared by November 2020. 31 In SSA women are also more likely to be employed in informal contact-intensive sectors, resulting in greater job losses for the female workforce. 11 Conditional on industry (column 2), the gender gap is slightly larger, suggesting it is driven by gender differences in job loss within (aggregate) industries. Again, this is in line with findings for other developing countries. 9 In addition, differential impacts across detailed sectors (such as hairdressing, tailoring, and plumbing) account for a large share of the gender gap in job loss among highly skilled young urban workers in Uganda. 15 This is related to the fact that employed women's work tends to be concentrated in face-to-face services (including food service, hospitality, retail, and wholesale), all of which were disproportionately affected during the lockdowns and mobility restrictions. 32 The gender gap in job loss is driven by urban areas (Table A6), while there is no significant gender difference in the rural sample. (In additional analyses, we found not effect of employment status (unpaid or self-employed worker versus employee) on job loss once we control for pre-COVID-19 industry. Including employment status does not affect the estimated gender gap.)
Early-phase labor market impacts.
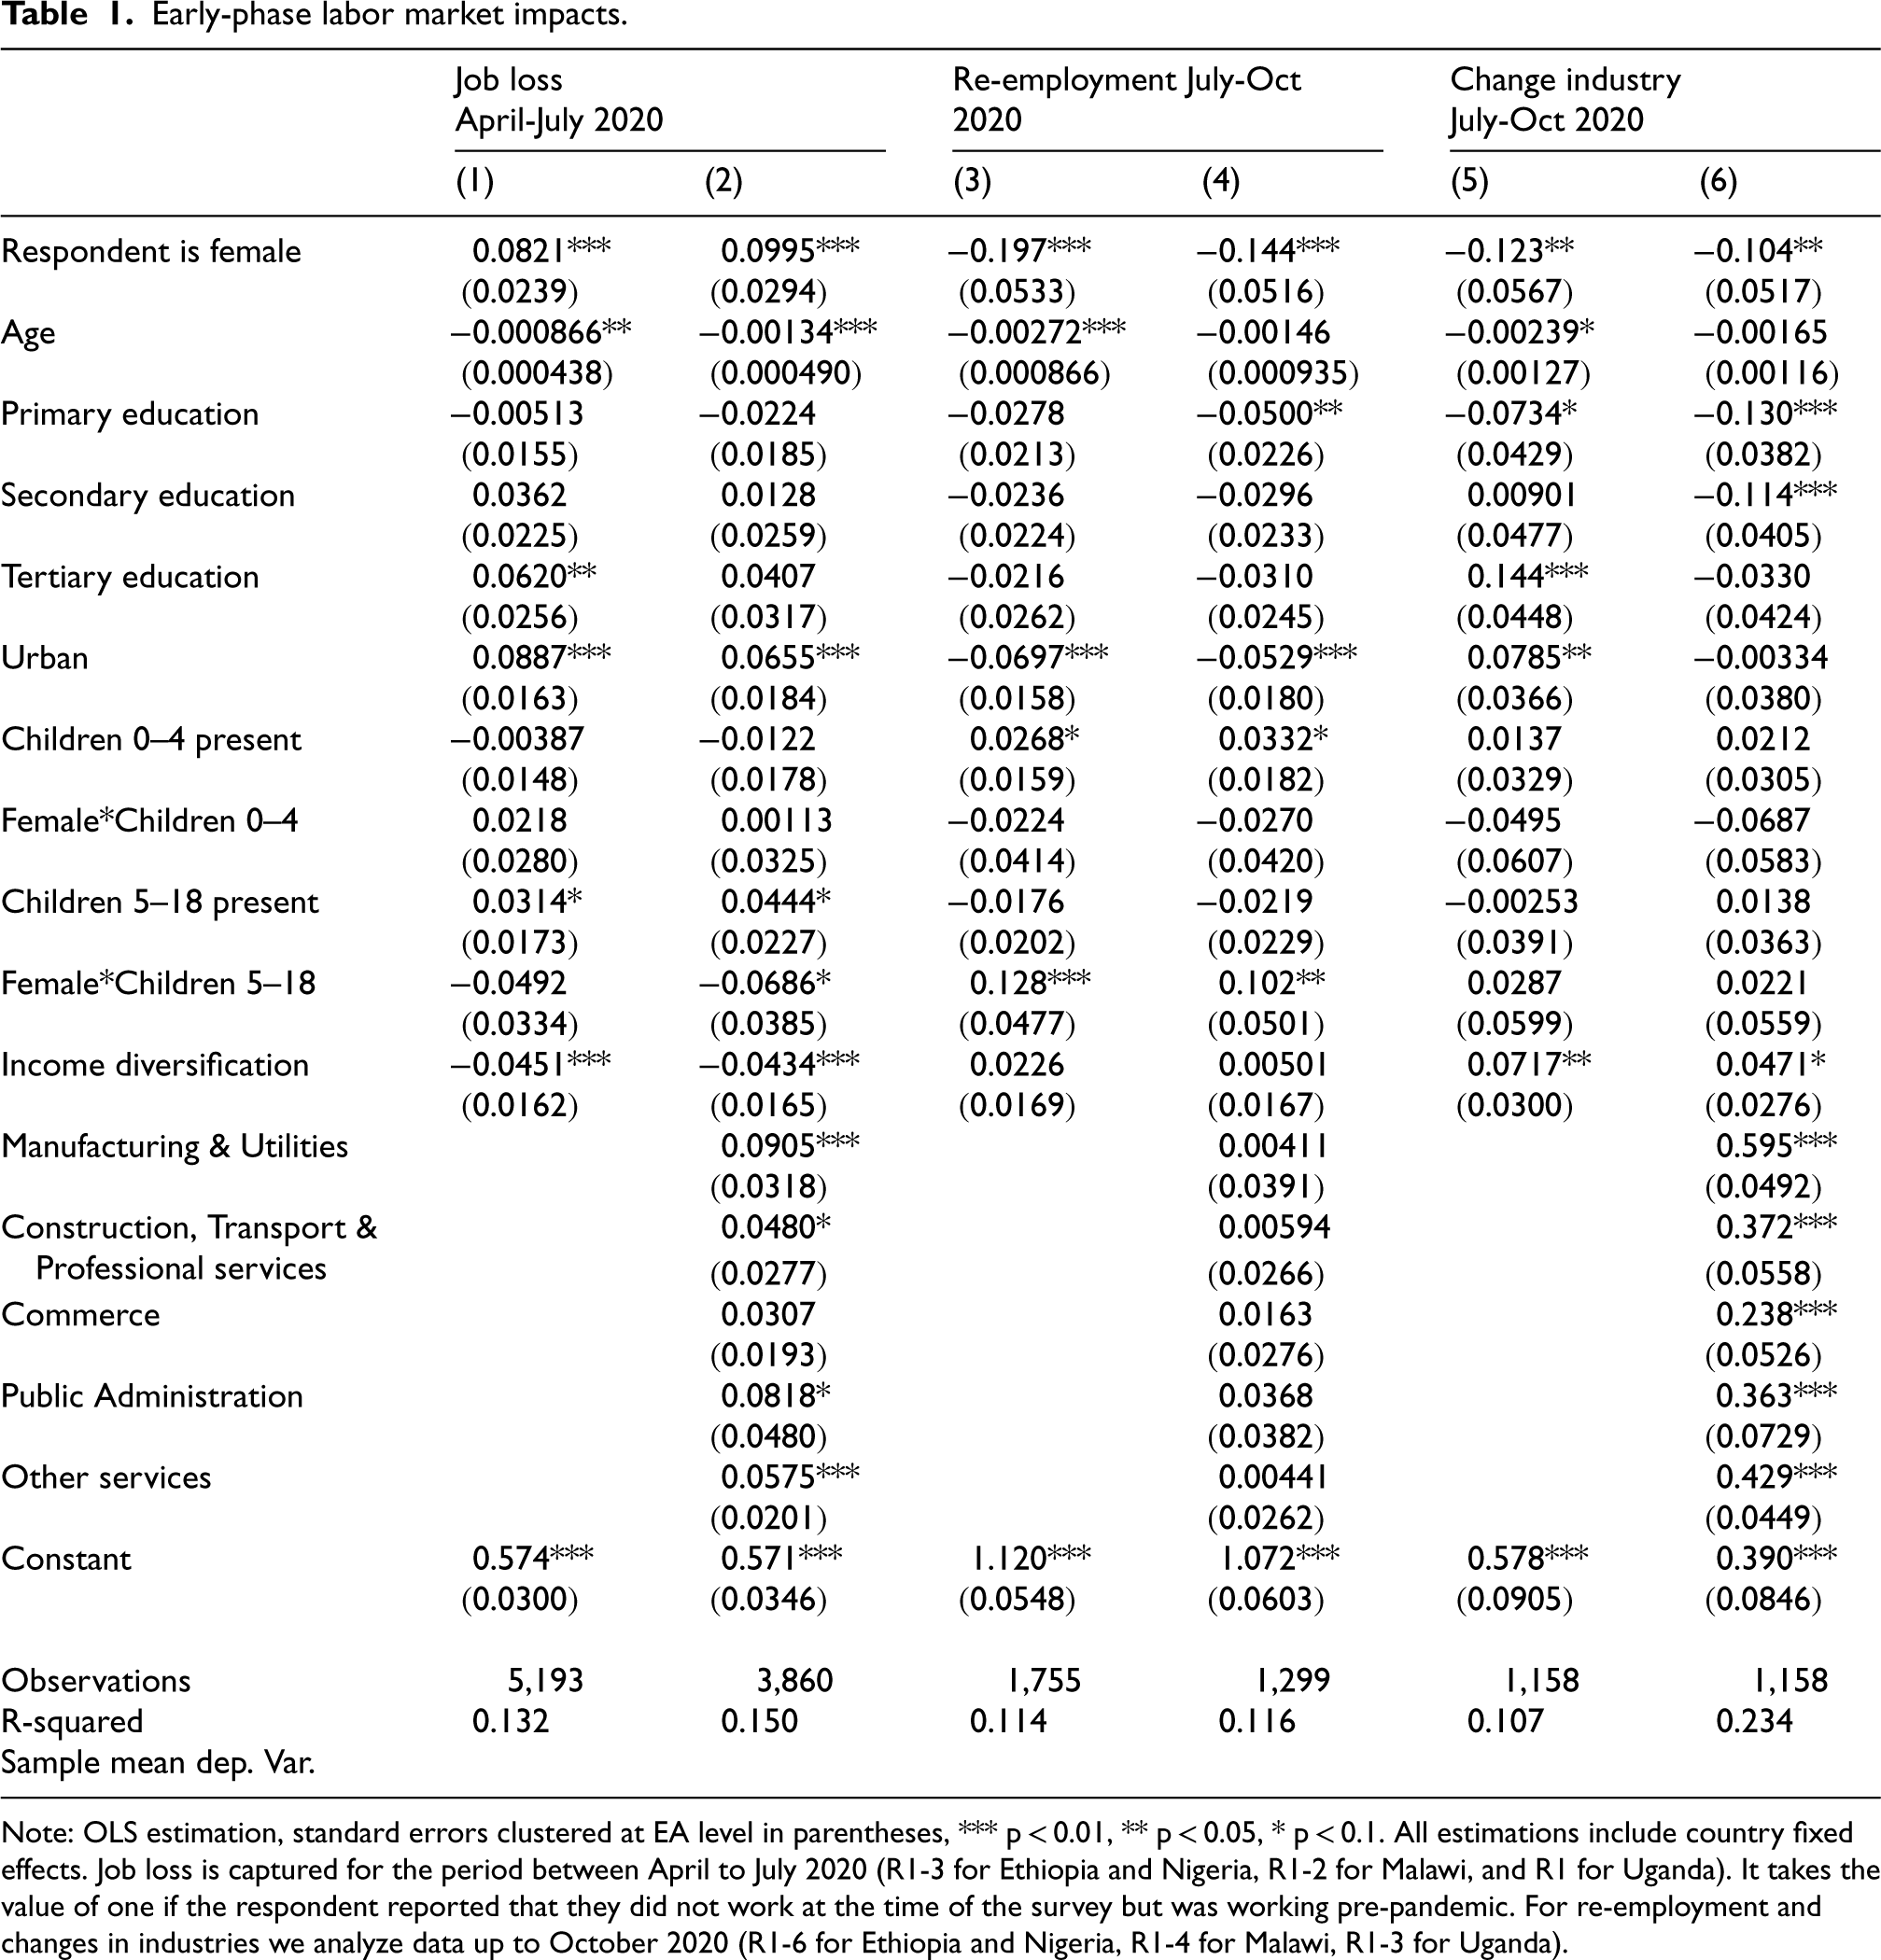
Early-phase labor market impacts.
Note: OLS estimation, standard errors clustered at EA level in parentheses, *** p < 0.01, ** p < 0.05, * p < 0.1. All estimations include country fixed effects. Job loss is captured for the period between April to July 2020 (R1-3 for Ethiopia and Nigeria, R1-2 for Malawi, and R1 for Uganda). It takes the value of one if the respondent reported that they did not work at the time of the survey but was working pre-pandemic. For re-employment and changes in industries we analyze data up to October 2020 (R1-6 for Ethiopia and Nigeria, R1-4 for Malawi, R1-3 for Uganda).
One-year labor market impacts.
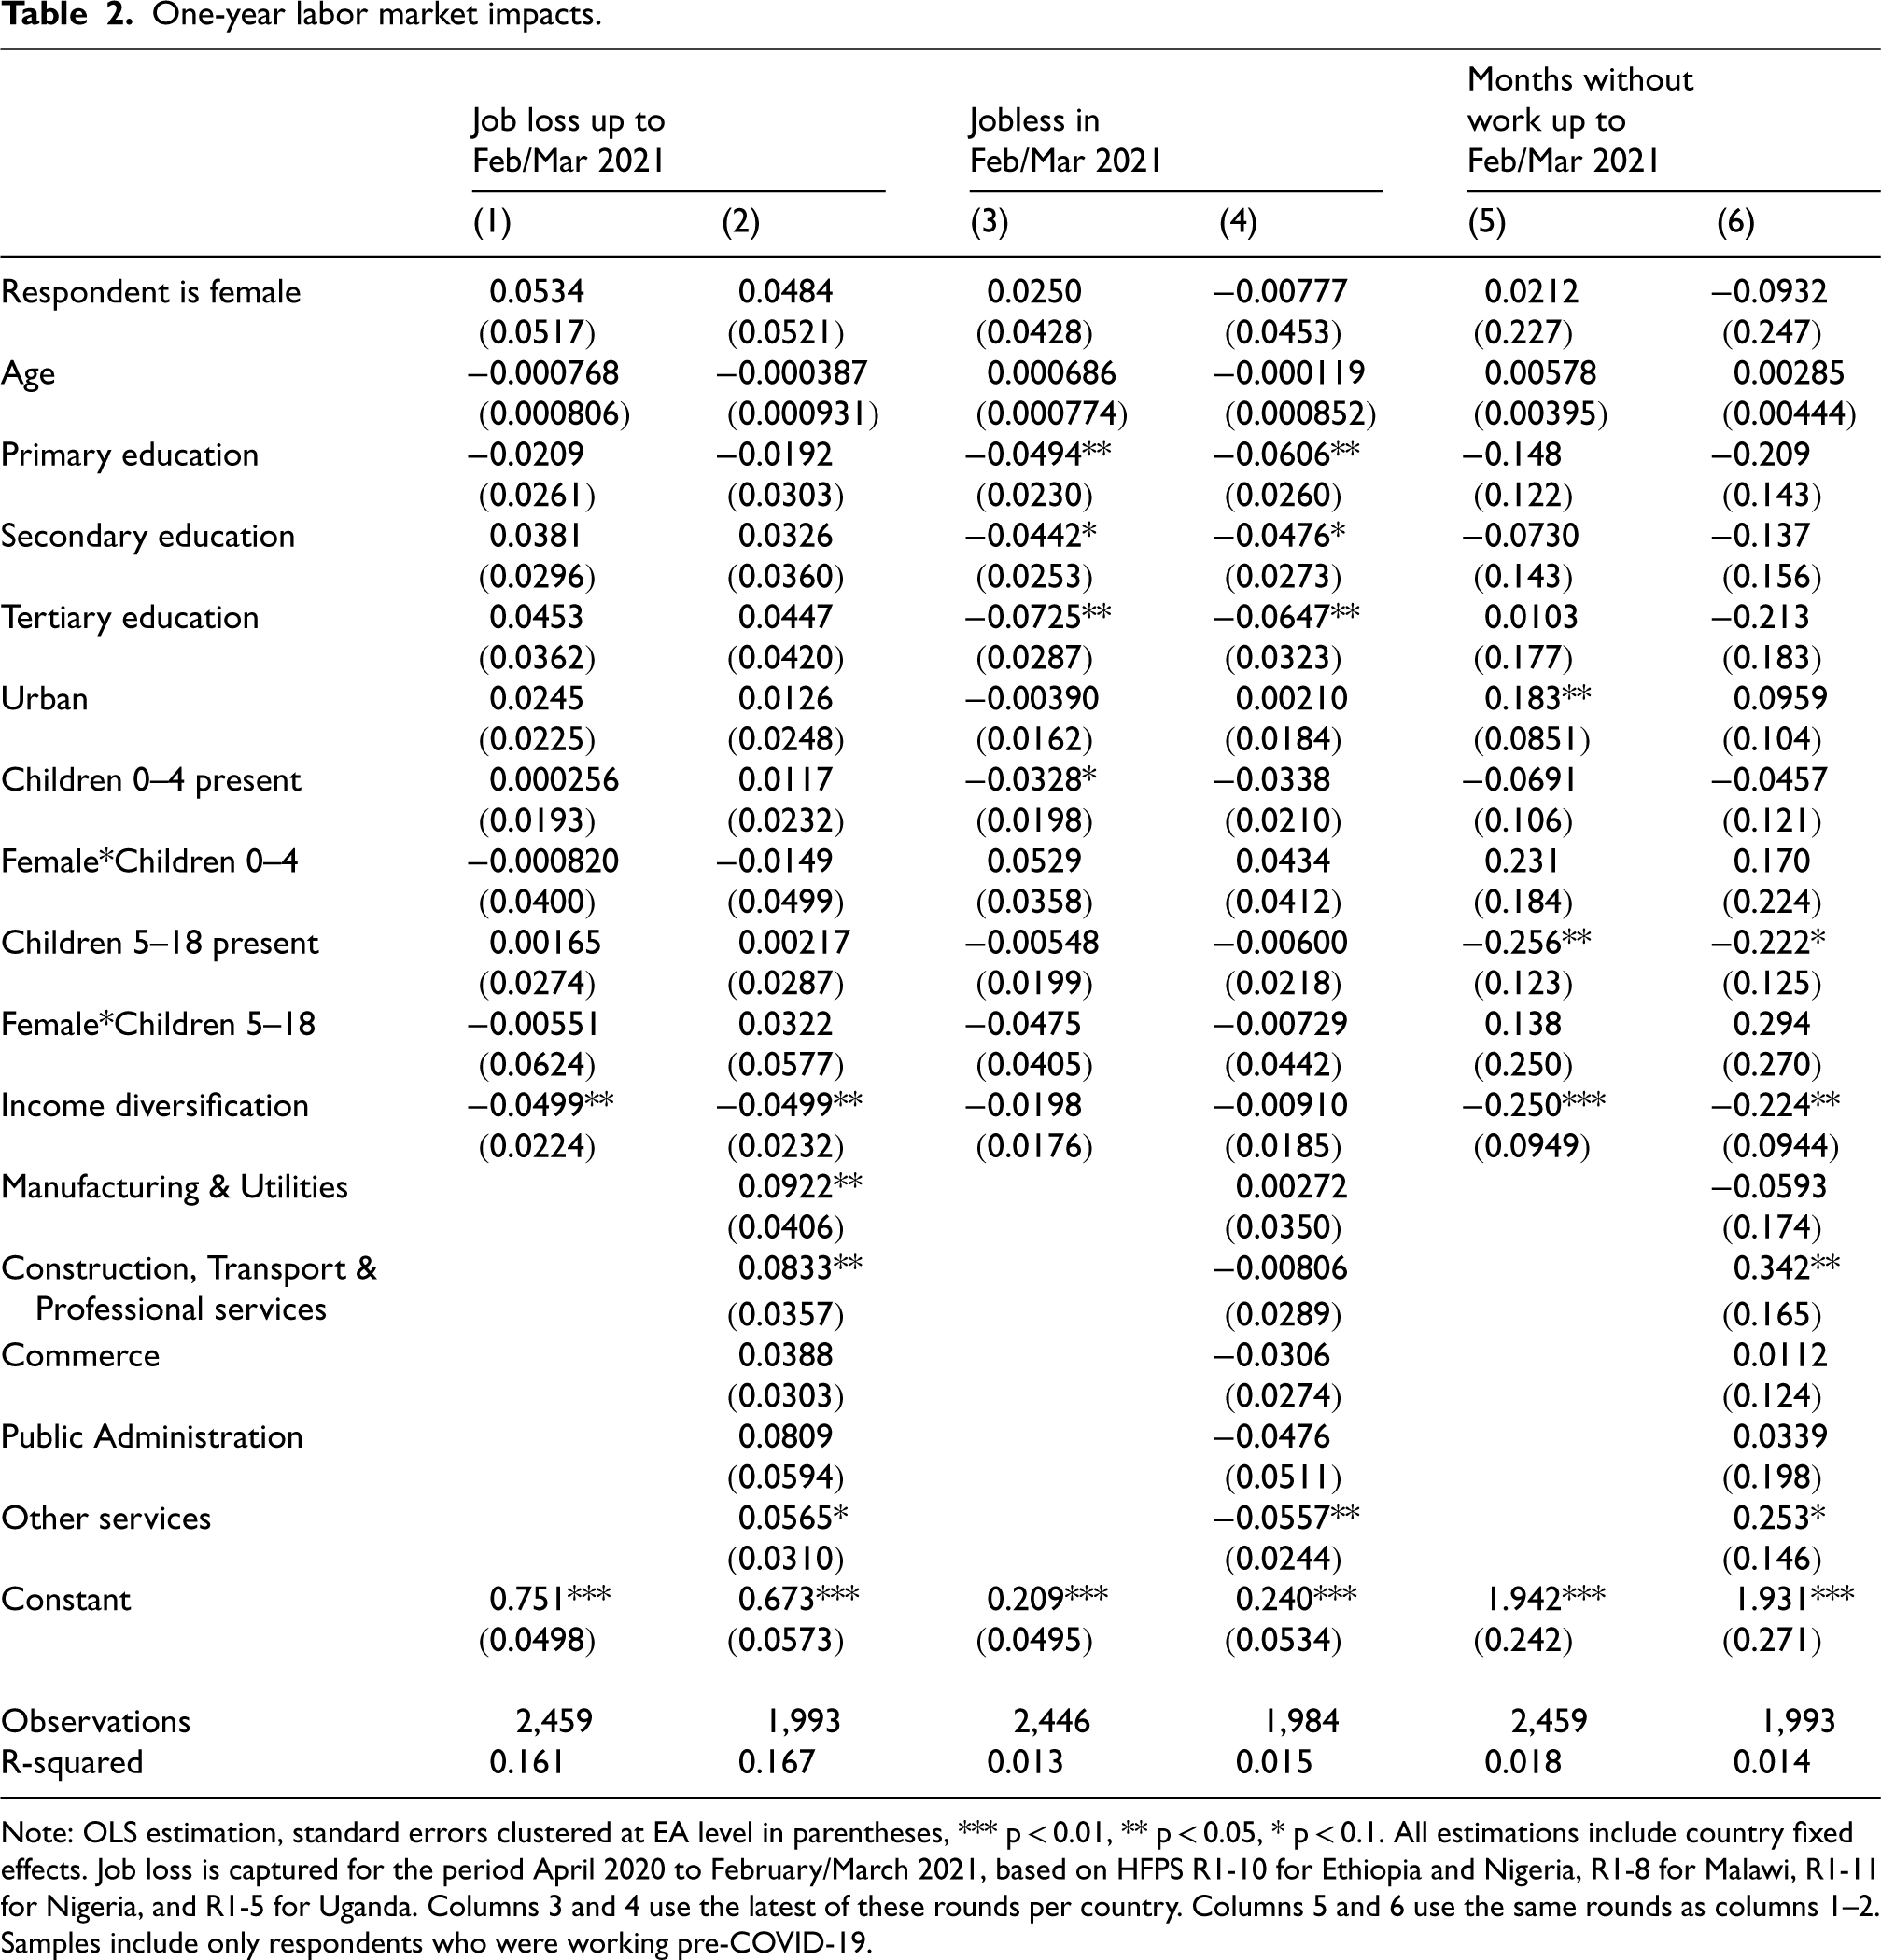
Note: OLS estimation, standard errors clustered at EA level in parentheses, *** p < 0.01, ** p < 0.05, * p < 0.1. All estimations include country fixed effects. Job loss is captured for the period April 2020 to February/March 2021, based on HFPS R1-10 for Ethiopia and Nigeria, R1-8 for Malawi, R1-11 for Nigeria, and R1-5 for Uganda. Columns 3 and 4 use the latest of these rounds per country. Columns 5 and 6 use the same rounds as columns 1–2. Samples include only respondents who were working pre-COVID-19.
Looking at the interaction terms of gender and children in column 1, we find no evidence that higher job loss among women is related to the presence of children aged 5–18 years. However, we find that households with toddlers (0–4 years old) have a significative effect on job losses. If anything, the gender gap in job loss is smaller among respondents with school-age children, suggesting job loss among women was not primarily driven by increased child-care demands related to school closures. In the urban sub-sample (Table A6), however, women with children aged 0–4 were about 11 percentage points more likely to lose their job than men with young children. This seems to be driven mainly by the Nigerian sample. It is possible that care for very young children was most difficult to combine with work in urban areas, while formal or informal childcare was limited during lockdowns. It could also be that urban women were concentrated in specific activities that were more affected by lockdowns, such as hair-dressing and hospitality, which are not captured by our aggregate industries.
The disadvantage of female respondents in terms of job loss was further aggravated by a lower probability of re-employment (Table 1, columns 3–4). By October 2020, women were 14 to 20 percentage points less likely than men to be re-employed after job loss. Again, this gender gap is smaller among respondents with school-age children. Re-employed women were also much less likely to return to a different industry than re-employed men (columns 5–6). Women's lower mobility may be one of the reasons they are less likely to be re-employed at all. The gender gaps in re-employment and change of industry are also driven by the urban sub-sample (Tables A7 and A8).
We find that age is associated with a lower probability of job loss. As described above, the HFPS samples are more likely to overestimate employment among young people relative to older people. We are therefore likely underestimating the relative disadvantage of younger respondents. Older workers were less likely to be re-employed and to change industry, but these age effects are smaller and statistically insignificant once we consider the pre-COVID-19 industry.
We find no clear education gradient in early phase labor market outcomes. Respondents with a tertiary education were more likely to report job loss than those with no education or less than primary education. The association is smaller and insignificant once we control for the pre-COVID-19 industry, suggesting that highly educated workers were more affected due to their industries being harder hit (columns 1–2). (There is similar reduction in the coefficient on tertiary education when we control for pre-COVID-19 employment status, in the smaller sample for which we have this information (results available from the authors). Hence the concentration in wage employment and in particular industries both account for the disproportionately job loss among highly educated workers.) This probably has to do with essential activities that were allowed to continue while restrictions were implemented, which does not require high-skill workers. For example, agriculture sector was less likely to be affected by covid-19 related measures, even started providing livelihoods for those who were not initially working in the sector. 11
There are strong rural-urban differences. Urban respondents were 6 to 9 percentage points more likely than rural respondents to lose their jobs and significantly less likely to be re-employed. These findings are similar if we control for the pre-COVID-19 industry and hence cannot be explained by relatively limited job losses in agriculture, which dominates in rural areas. The stronger impact on jobs in urban areas is in line with descriptive patterns across Sub-Saharan Africa as reported in Kugler et al. (2021) in the Table 3, 9 but is more pronounced in our sample. It is driven by the Nigerian and Ethiopian sample (Tables A6 and A7).
Probability of early-phase income loss, total income and by source.
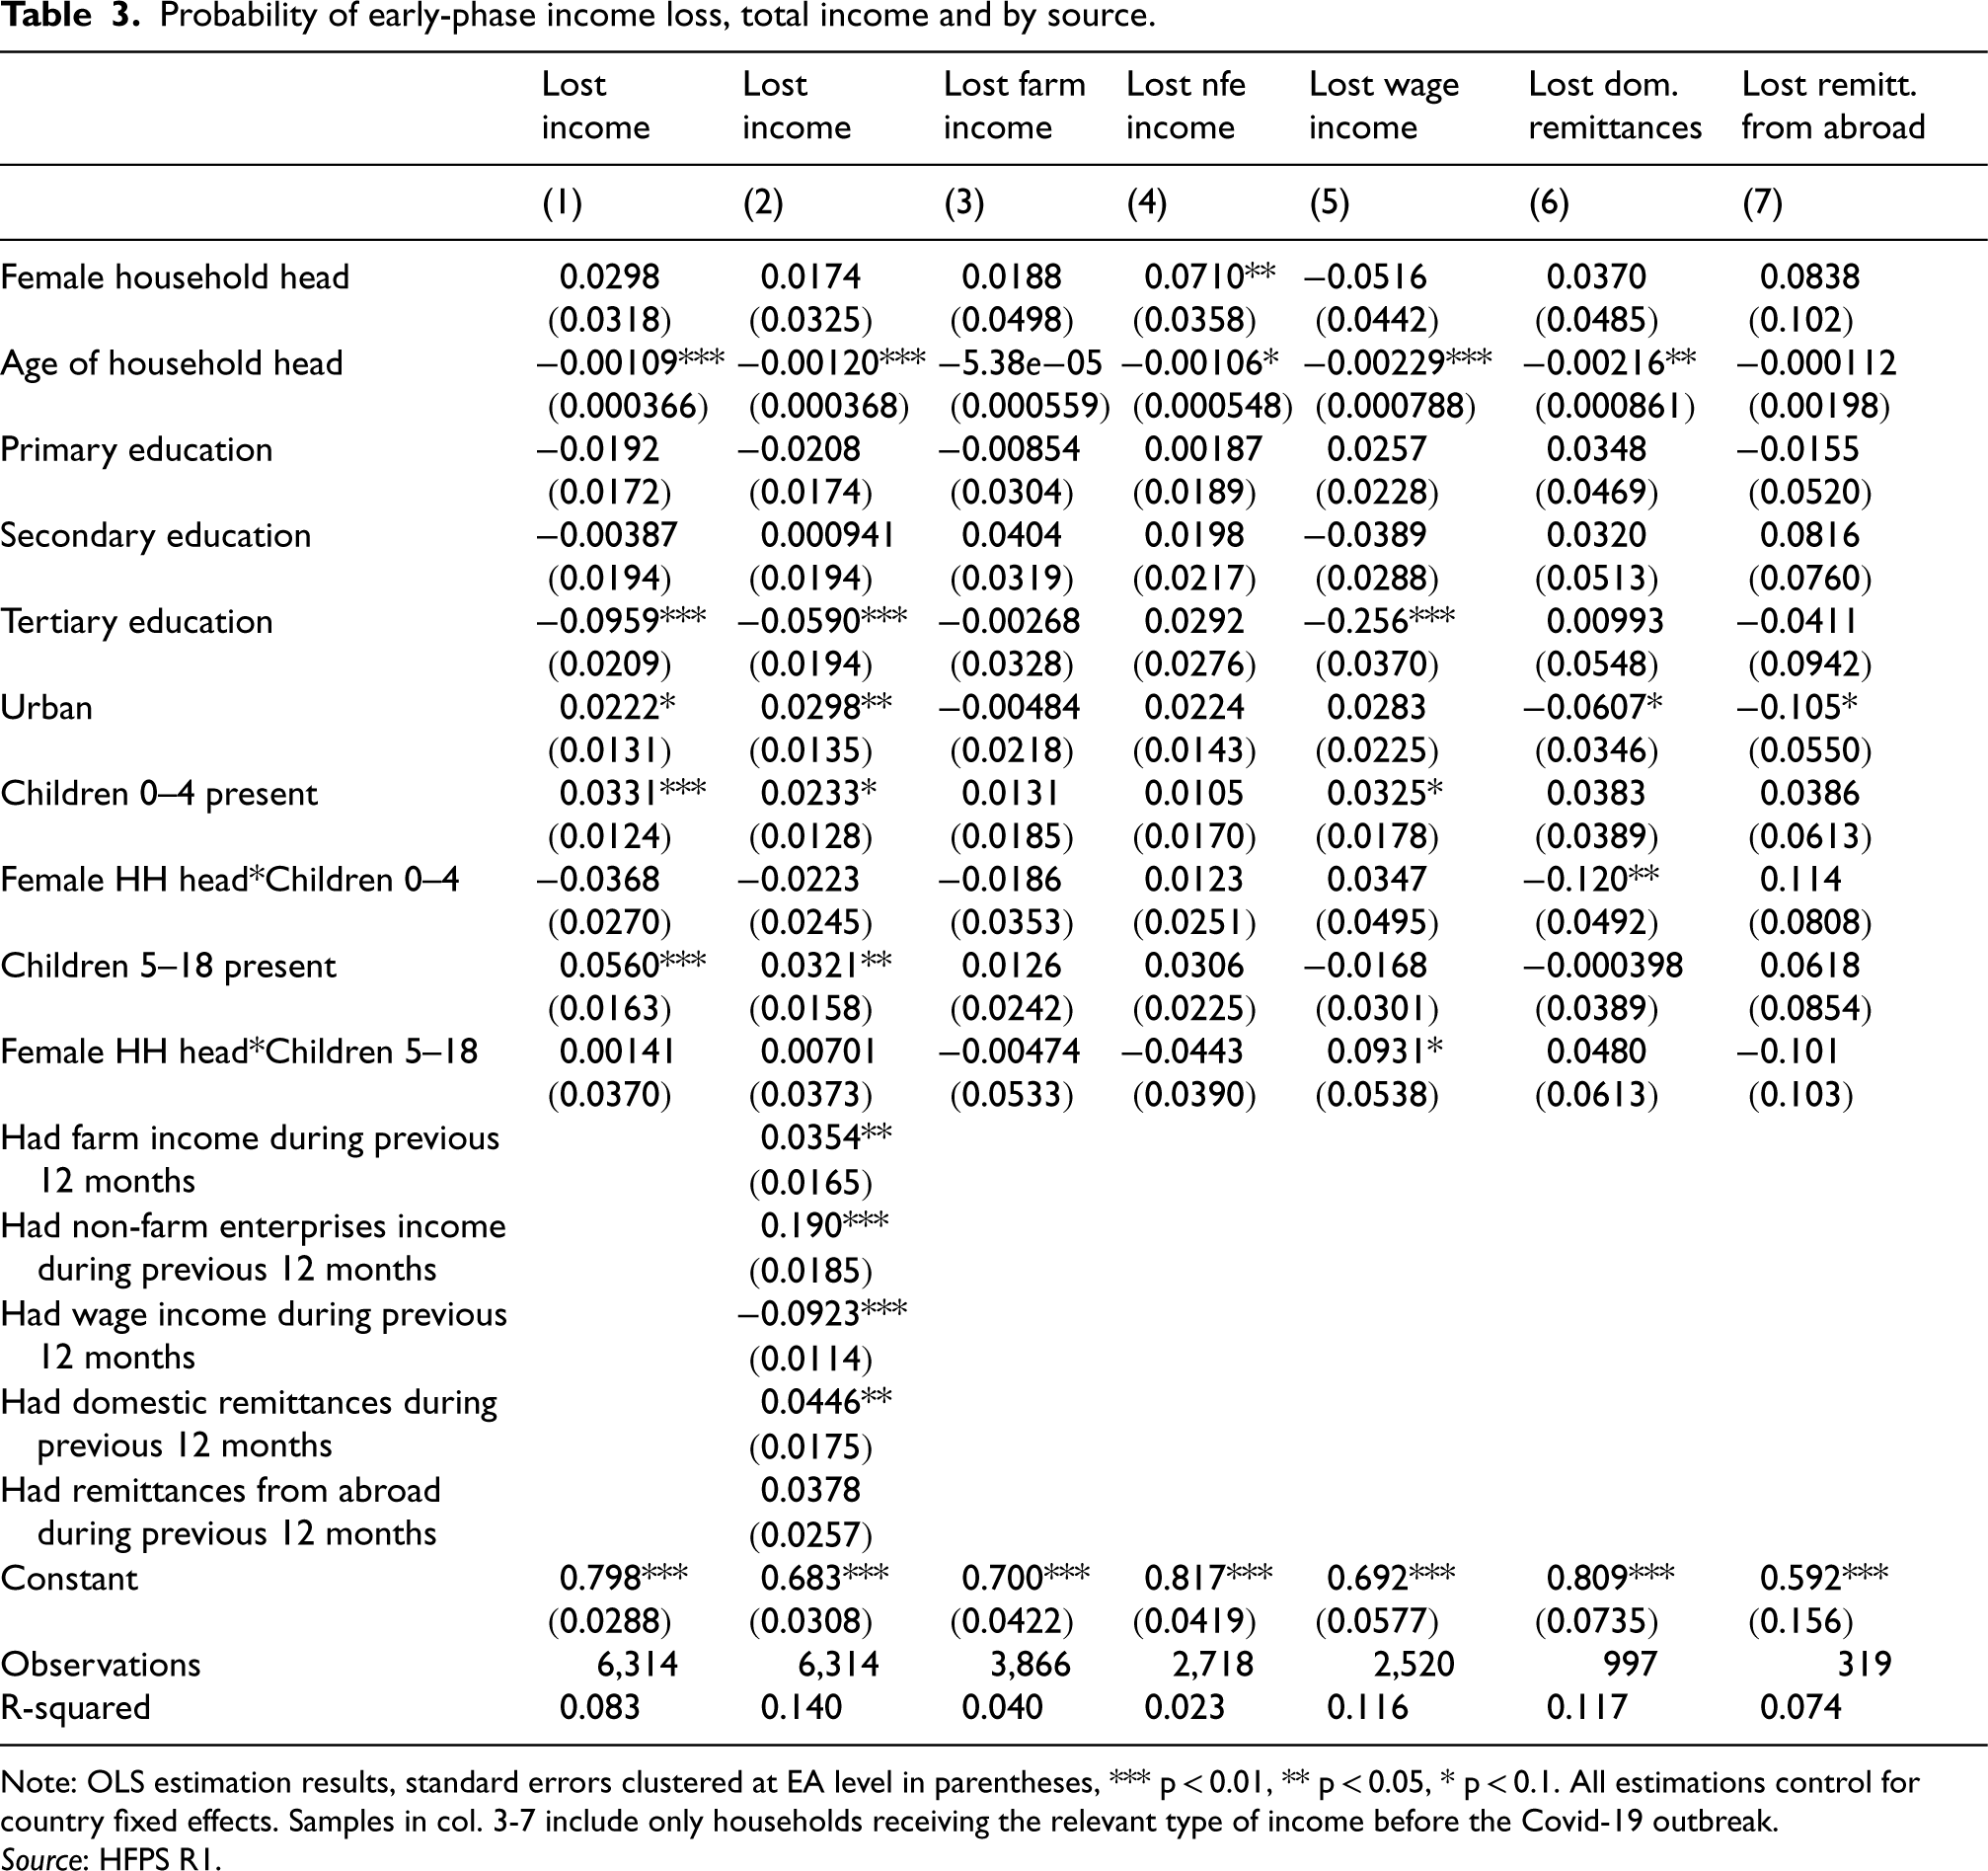
Note: OLS estimation results, standard errors clustered at EA level in parentheses, *** p < 0.01, ** p < 0.05, * p < 0.1. All estimations control for country fixed effects. Samples in col. 3-7 include only households receiving the relevant type of income before the Covid-19 outbreak. Source: HFPS R1.
Income diversification (whether the household had income from more than one type of source such as farming, non-farm enterprises, or wages in the year before the pandemic) is negatively related to job loss, suggesting that the opportunity to reallocate work time to different economic activities undertaken by household members helped ensure employment. It is positively related to changing industry among those re-employed. Finally, workers in agriculture and commerce sector were least likely to report job loss, while manufacturing and utilities and public administration workers were most likely to report job loss (Table 1, column 2). (We use industry of work from the pre-COVID-19 face-to-face survey because the HFPS in Ethiopia did not collect data on industry of work. This means the sample is reduced to respondents who reported, in the HFPS, that they were working pre-COVID-19 and who were working in the last face-to-face survey. Results in column 1 are similar if we limit the analysis to this more restrictive sample.) These results may be related to the fact that agriculture and commerce sector were essential industries with less strict restrictions. The pre-COVID-19 industry is not significantly related to re-employment, but agricultural workers were least likely to return to a different industry. The evidence indicates that agriculture showed resilience, so workers in this sector did not need, to a large extent, to transition to other sectors. 11 On the other hand, agricultural workers have lower educational levels, so they experience greater difficulty relocating to other industries, especially those that require better educational levels or technological skills.
In this section we analyze heterogeneity in labor market outcomes beyond the first few months of the pandemic. The impacts of the pandemic may have evolved differently during the year, as governments lifted or adjusted restrictions, and as people (and their farms and businesses) adapted to the situation. The Nigerian government gradually lifted restrictions between June and October 2020, while most restrictions in Ethiopia and Uganda remained until October. By mid-November, restrictions in all countries were at their lowest level since April 2020 and they did not increase much again until June 2021. Nevertheless, job losses continued after July 2020 in Malawi, Nigeria, and Uganda (see Figure 7).
There is no significant association between gender, age, or rural/urban area and one-year job loss (Table 2, columns 1–2), nor with the probability of being jobless in February/March 2021 (columns 3–4). While coefficient signs in the columns 1 and 2 are the same as for early-phase job loss, they are not statistically significant. We also find no significant gender gap in the urban sub-sample (Tables A9 to A11). Urban respondents were jobless for around 0.2 additional months compared to rural respondents, but the difference gets smaller and insignificant once we condition on pre-COVID-19 industry of work (columns 5–6).
An important result in Table 2 is that education is the key predictor of job status in February/March 2021 (columns 3–4): conditional on working pre-COVID-19, the least educated respondents are four to seven percentage points more likely to be jobless a year later compared to those with primary or higher education. (If we include, in columns 3-4, all respondents in the February/March HFPS round who were working pre-COVID-19 (instead of the subsample of respondents who participated in all HFPS rounds up to Feb/March 2021), the results are very similar (available from the authors).) This is different from the early-phase results, where we found some evidence for a positive relationship between education and job loss. The education effects are similar between columns 3 and 4, indicating they are not driven by differential impacts across industries. Sub-sample results (Table A10) show that the education gradient is strongest in urban areas.
Overall, we find that disparities in the early-phase labor market impacts by gender, age, and rural/urban smoothed out after October 2020. Instead, education appears as the main dimension of inequality a year after the start of the pandemic, when joblessness was significantly higher among the least educated individuals.
Inequality in impacts on household income
In addition to job loss, households’ income could have been affected by reduced business activity, a decrease in working hours, or factors not directly related to employment of the respondent, such as declining remittances or job loss by a household member. In this section we analyze how household demographics and reliance on different income sources are related to the probability of households’ loss of income.
Methodology
First, we regress an indicator for household income loss on gender, age, and education of the household head, rural/urban location, and the presence of children (Table 3, column 1). (Income loss is a dummy variable that takes the value of one if the household reported income loss after the pandemic outbreak during the first round of the HFPS compared with income one year prior to the interview.) Second, we run the same regression but also including indicators for whether the household received income from farming, non-farm enterprises, wages, or remittances, in the year before the pandemic (Table 3, column 2). (Appendix Table A12 reports estimation results for rural and urban subsamples and by country.) By comparing results from these two analyses, we can assess the extent to which differences in income sources account for heterogeneity in income loss by household demographics. Third, we estimate how household characteristics are related to the probability of income loss for each income source (family farming, non-farm enterprises, wages, remittances from within the country, and remittances from abroad), within the subsample of households receiving income from the respective source (Table 3, columns 3–7). These analyses all focus on early-phase income loss based on the pooled data from the four countries’ first HPFS rounds. We then run the same models for one-year income loss, pooling the data from Nigeria's Round 9 and Uganda's Round 5 (as discussed in section 3). The results are reported in Table 4.
Probability of one-year income loss, total income and by source, Nigeria and Uganda.
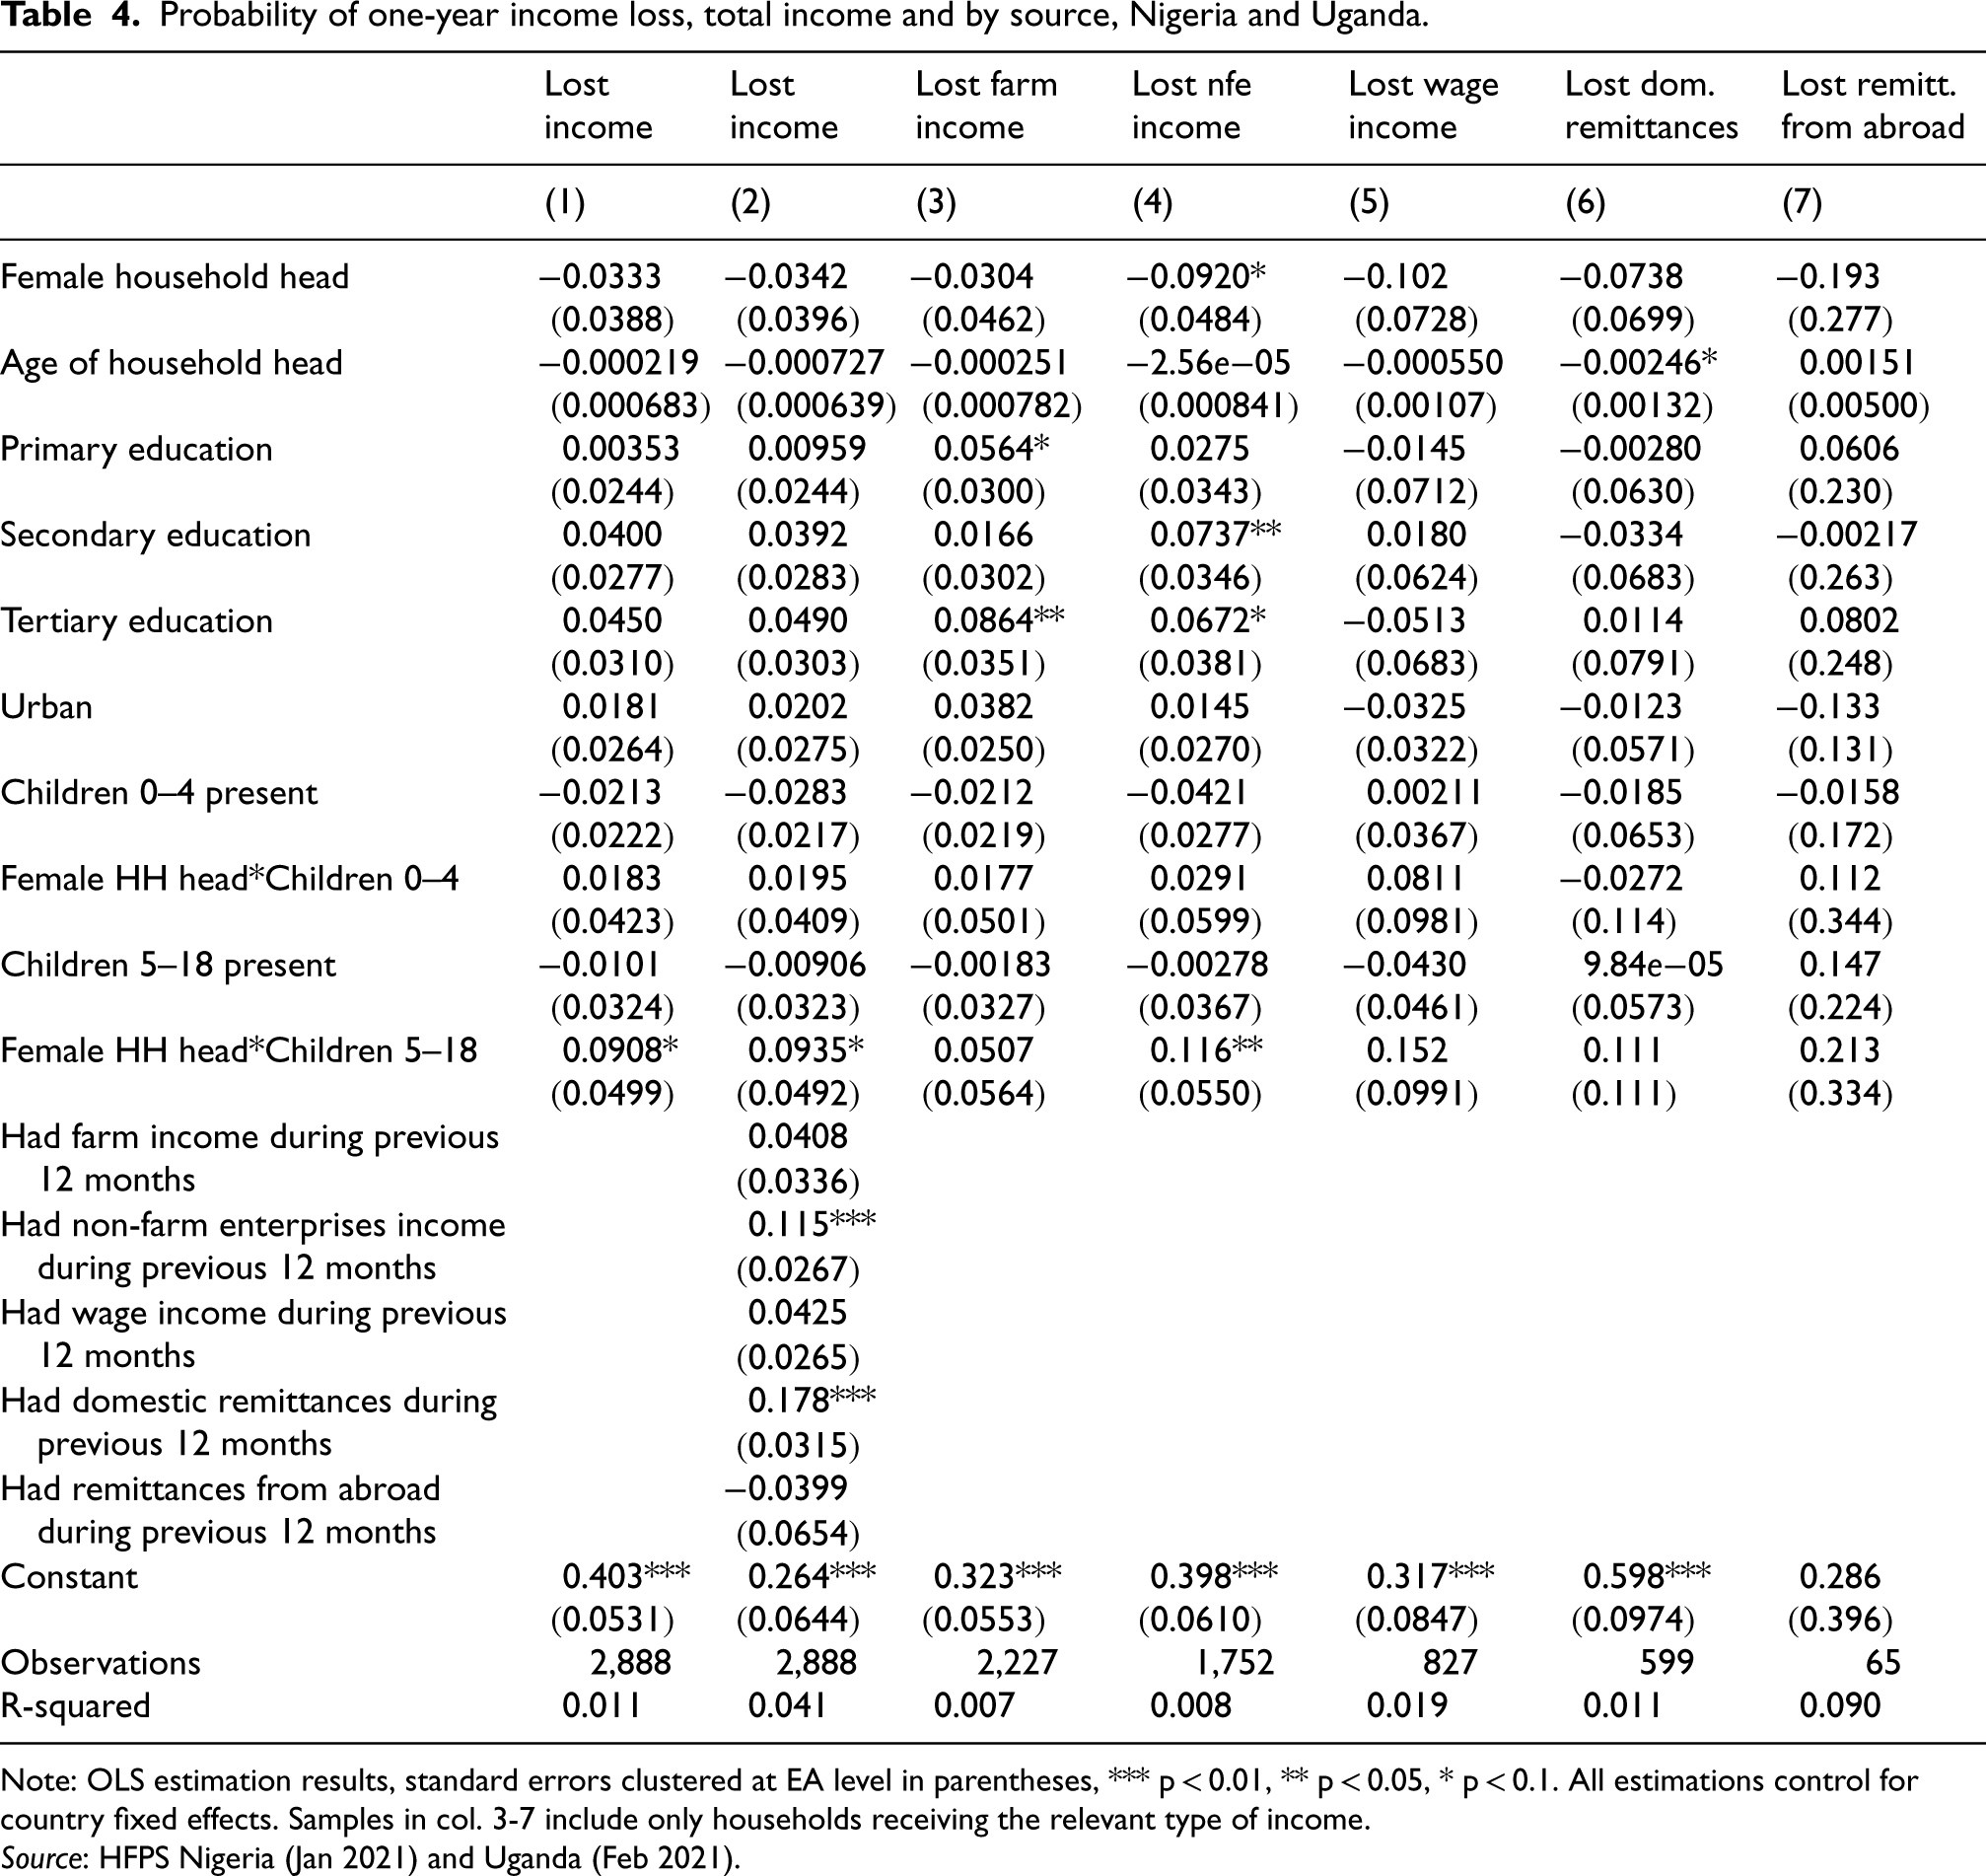
Probability of one-year income loss, total income and by source, Nigeria and Uganda.
Note: OLS estimation results, standard errors clustered at EA level in parentheses, *** p < 0.01, ** p < 0.05, * p < 0.1. All estimations control for country fixed effects. Samples in col. 3-7 include only households receiving the relevant type of income. Source: HFPS Nigeria (Jan 2021) and Uganda (Feb 2021).
In the early phase, urban households and households with children were more likely to lose income, while age and tertiary education of the household head are associated with a significantly lower probability of income loss (Table 3, column 1). These results are similar (in some cases a bit smaller in magnitude) when we condition on income source indicators (column 2), suggesting they are not primarily driven by differences in the types of income sources households relied on.
Income sources do matter (column 2): there is a strong negative association between income from wages and income loss, suggesting that wage employment was an important factor protecting households from income loss, as a relatively secure source of income during the early months of the pandemic. Households with NFE income, on the other hand, were most likely to lose income, while income from family farming and domestic remittances are also associated with a higher probability of income loss. The reduction in NFE income could be related to many of these businesses are informal and do not have access to formal sources of credit and insurance to ease expenditures. 33
The higher probability of income loss among urban households reflects a combination of their higher likelihood of losing NFE income and wage income (columns 4 and 5), although the urban coefficient is not statistically significant in those estimations. The presence of children increases the probability of income loss across all sources (for young children) or most sources (older children), but these effects are also not statistically significant (columns 3–7). Tertiary education of the household head reduces the probability of income loss because it is associated with a 0.26 lower probability of losing wage income (column 5). The negative effect of household head age on income loss is driven by a lower probability of losing wage income and domestic remittances (columns 5 and 6). Finally, while there is no significant association between the gender of the household head and the probability of total income loss, female-headed households are significantly more likely to report a loss of NFE income (column 4).
In general, the results illustrate that inequalities in early-phase income loss varied substantially across income sources. They also confirm that inequalities early-phase individual job loss, which was concentrated among young, urban, and female workers, does not translate into the same pattern of household level income loss inequalities.
Results: One-year impacts
As explained above, given the nature of the HFPS data, we can analyze income loss after the first year of the pandemic only for Uganda and Nigeria. The results for one-year income loss (Table 4) show that the only demographic factor significantly related to income loss is the interaction between female household head and children aged 5–18 (significant at the 10% level). Compared to male-headed households, income loss was nine percentage points more likely in female-headed households with children aged 5–18. In addition, income loss by early 2021 is associated with the different sources of income households relied on during the 12 months before HFPS R1. NFE income and income from domestic remittances are associated with higher probability of income loss. In the medium run, these were the most vulnerable sources of income, relative to farm income, wage income, and remittances from abroad.
Policy Implications
In this paper, we analyze high frequency phone survey data from Ethiopia, Malawi, Nigeria, and Uganda to document the impacts of the COVID-19 crisis on employment and income. We focus on heterogeneity by gender, family composition, education, age, job industry, and between the rural and urban sector. For employment, we compare the early-phase impacts (up to July 2020) with the medium-term (up to February/March 2021).
By July 2020, job loss had affected 18% to 30% of respondents in Ethiopia, Malawi, and Uganda, and a striking 61% of respondents in Nigeria. In all countries, with the exception of Ethiopia, the rate of job loss continued to increase after July 2020. Even without necessarily losing employment, many households were affected in terms of income. Between March and June 2020, 46% of respondents in Ethiopia and more than 75% of respondents in Malawi, Nigeria, and Uganda reported a loss of household income. After one year into the pandemic, 41% of respondents in Nigeria and 49% in Uganda reported household income loss.
We find significant inequalities in the impacts of the pandemic on employment and income. In the early phase of the pandemic, job loss was relatively concentrated among urban, young, and female workers. Within urban areas, women with young children were disproportionately affected. In the longer run, however, the pattern of inequality in employment looks different. By February/March 2021, gender, age, and urban location are no longer related to joblessness, while education appears to be a key predictor. A year after the onset of the pandemic, respondents with less than a primary education were significantly less likely to be working than respondents with more education.
We further find that in the early phase of the pandemic, households relying on non-farm enterprise income were most likely to report a decline in household income, while income from wage employment was relatively secure. Inequalities in the probability of losing income vary across sources. Women and young household heads were disproportionately affected in terms of NFE income, while wage income losses were relatively more likely in households with younger or less educated household heads. For total household income, early-phase income loss is strongly predicted by younger, less educated household heads, urban location, and the presence of children.
For Nigeria and Uganda, we also analyze the probability of income loss in early 2021 compared to pre-pandemic income. Households that received NFE income or income from domestic remittances before the pandemic were more likely to report income loss, so in the medium run these appear to be the most vulnerable income sources. We find no significant relationship between household demographics and the probability of income loss.
Our findings complement previous studies that have documented the extent of job loss and income loss in low- and middle-income countries, by tracing pre-COVID-19 workers up to a year after the start of the pandemic. The early-phase gender and rural/urban disparities in job loss in Ethiopia, Malawi, Nigeria, and Uganda were more pronounced compared to patterns across a broader group of low- and middle-income countries. 9 By February/March 2021, however, those disparities largely disappeared. Instead, lower education turned out to be the main predictor of joblessness in February/March 2021 among those who were working pre-COVID-19. This suggests that re-integration of the least educated inactive or unemployed persons into the labor force should be a priority for governments, as apparently the extended public works programs implemented in Ethiopia, Nigeria, and Uganda 22 have not been able to absorb this group.
The relative vulnerability of NFE income offers further guidance for policy design. A large share of households relies on this income generating activity making it very important for the economy and overall wellbeing. However, these enterprises are relatively difficult to target due to the small scale and informal nature of activities. It would be beneficial to provide incentives for formalizing these businesses and improve targeting possibilities in the future and to design safety net policies particularly targeted at NFEs during crises such as the pandemic.
Finally, this paper has illustrated how high-frequency phone surveys can be a valuable tool in capturing data on outcomes, such as employment status, that are prone to changes and fluctuations. These surveys can also complement face-to-face surveys on more structural characteristics of households and individuals.
Footnotes
Acknowledgements
The authors would like to thank Alain Ntumba Kabundi and Gero Carletto for comments on an earlier draft of the paper. This work has been supported by the World Bank Multi-Donor Trust Fund for Integrated Household and Agricultural Surveys in Low and Middle-Income Countries (TF072496). The funders had no role in study design, data collection and analysis, decision to publish, or preparation of the manuscript.
Funding
The author(s) received no financial support for the research, authorship, and/or publication of this article.
Declaration of conflicting interests
The author(s) declared no potential conflicts of interest with respect to the research, authorship, and/or publication of this article.
Supplemental material
Supplemental material for this article is available online.
References
Supplementary Material
Please find the following supplemental material available below.
For Open Access articles published under a Creative Commons License, all supplemental material carries the same license as the article it is associated with.
For non-Open Access articles published, all supplemental material carries a non-exclusive license, and permission requests for re-use of supplemental material or any part of supplemental material shall be sent directly to the copyright owner as specified in the copyright notice associated with the article.