
Abstract
The paper reviews, represents and captures knowledge about industrial water treatment processes and predicative models, in order to facilitate management of relevant knowledge. The proposed approach is based on a Knowledge Graph (KG), which integrates process knowledge and predictive models, adding context to their application and usage; improves problem and data understanding by facilitating communication between data analysts and process engineers, providing clear, human-readable explanations; and facilitates answering process-related knowledge questions and provides answers that include relevant data elements, models, and key performance indicators (KPIs).Further, the paper includes examples of how the KG can be used in practice. Directions and recommendations are provided, as well as research guidelines of how the KG can augment generative AI approaches, paving the way for the development of retrieval-augmented knowledge management models and systems.
Introduction
Water management in industries is becoming increasingly crucial for enhancing sustainability. Effective water management involves practices aimed at minimizing water consumption and reducing water losses. It also includes the creation of closed-loop systems to recover and reuse water, as well as the implementation of technological solutions for efficient wastewater management and reuse. Water management processes face numerous challenges, such as the complexity of treatment systems, the need for precise monitoring and control of water quality parameters, and the integration of data from various sources. Additionally, industries must comply with environmental regulations and standards.
Water treatment is essential for optimizing various water-dependent industrial processes, such as heating, cooling, processing, cleaning, and rinsing, by reducing operating costs and minimizing risks. Inadequate water treatment allows water to interact with the surfaces of pipes and vessels, leading to issues like scaling or corrosion in steam boilers. These deposits increase the amount of fuel required to heat the same volume of water. Similarly, cooling towers can also suffer from scaling and corrosion; if left untreated, the warm, contaminated water can foster bacterial growth, potentially leading to fatal diseases like Legionnaires’ disease. Water treatment also plays a crucial role in enhancing the quality of water used in manufacturing processes, such as in the production of steel, electronics or food products, and can even be a key ingredient in products like pharmaceuticals. Poor water quality in these applications can result in defective products. In many cases, effluent water from one process can be treated and reused in another, helping to cut costs by reducing water consumption charges, minimizing effluent disposal fees due to lower volume, and saving energy through the recovery of heat from recycled wastewater.
The dynamic industrial environment requires adaptations of industrial processes and therefore constant access to up-to-date knowledge about industrial processes. First principle (mechanistic) and data-driven predictive models are essential for bridging the gap between process experts and data analysts by offering a common framework that helps capture the necessary concepts in industrial water management. Knowledge-based models can support domain experts in transforming their tacit, domain-specific knowledge into a more structured format, capturing all the relevant aspects needed for effective data analytics in this field. This shared knowledge can enhance the problem and data understanding stages of the analytics process by providing a common foundation for describing the domain, the associated problems, and the relevant data. Predictive models are especially important for managing water treatment processes, as they enable predictions of system behavior and optimization of operations.
This paper reviews and models industrial and predictive models using a Knowledge Graph (KG), which captures and organizes knowledge in the following ways:
It integrates process knowledge and predictive models, adding context to their application and usage. It improves problem and data understanding by facilitating communication between data analysts and process engineers, providing clear, human-readable explanations. It facilitates answering process-related knowledge questions and provides answers that include relevant data elements, models, and key performance indicators (KPIs).
In recent years, ontologies have become a widely used knowledge representation approach in industrial process automation, particularly within manufacturing processes. 1 Ontologies offer a robust approach for formally representing knowledge, enabling accurate and shared knowledge codification, as well as explainable inferencing to model and ground industrial processes. Poernomo and Umarov 2 enhance Petri net models with ontologies to create knowledge codifications of these water treatment processes. Andonoff et al. 3 integrate Petri Networks with Objects (PNO) and Workflow Web Services, offering rules that automatically derive OWL-S specifications from PNO specifications. Grüninger et al. 4 introduce the PSL ontology, aiming to create a formalizing process information model related to primarily manufacturing processes.
Ontology-based knowledge representation is a reliable method for capturing industrial process knowledge, 4 though it can be laborious while it requires advanced knowledge engineering competencies. 5 However, it proves valuable for addressing complex competency questions that entail reasoning. To address the shortcomings of ontologies, alternative approaches, such as Knowledge Graphs (KGs), are being used to support process knowledge codification. 6 While KGs and ontologies are closely related, there is no clear consensus on definitions that distinguish the two. Generally, ontologies focus on representing concepts within a domain (though instances can also be defined), while KGs center on data, with their schema built upon ontological concepts to provide a formal knowledge foundation. 7 While much of the existing literature focuses on ontologies for codifying process knowledge (e.g.,2,3,4), we utilize KGs, which do not require advanced knowledge engineering skills and have better tool and technology support.
Knowledge Graphs (KGs), like databases, are closely tied to knowledge engineering, and while they can be application-specific, they are not necessarily so. In the context of Industry 4.0, KGs have diverse applications, such as in maintenance, optimization, and resource allocation. Early studies8,9 explore their potential across various domains, while Bader et al. 10 introduce the Industry 4.0 Knowledge Graph (I40KG) for modeling norms, standards, and their interrelations. Xie et al. 11 propose using KGs to model sensors as subgraphs, facilitating the integration and interoperability of IoT devices. Additionally, research by Dhungana et al. 12 focuses on using KGs and sensor data to generate production plans across factories, considering both static and dynamic information. Our work builds on these studies by applying KGs to water processes, integrating sensor data for real-time monitoring and optimization, with a focus on water quality and treatment process efficiency.
KGs have been utilized in various studies to facilitate the implementation of industrial process knowledge models. For instance, 13 highlights KGs as a key technology for linking and retrieving diverse data, including descriptive and simulation models. In, 14 the feasibility of supporting Digital Twins with enterprise KGs is explored, emphasizing how semantic technologies can strengthen Digital Twins by providing formal representations of their domains. Additionally, 15 employs a graph-based query language to extract and infer knowledge from large-scale production data, enhancing industrial process management with reasoning capabilities. Banerjee et al. 15 also discuss KGs in the context of digital twins in industrial settings. Our work extends this by applying KGs to water treatment processes, creating digital representations for improved monitoring and optimization. Some researchers view KGs as subsets of ontologies, where data instances inserted into ontological terms form a KG, 15 while others, like Ehrlinger et al., 6 differentiate between ontologies and KGs. The rise of KGs offers an enterprise-level data framework, akin to the Semantic Web, integrating knowledge storage with intelligent discovery. To uncover additional insights from KGs, graph embedding techniques are often used. 16
Conceptual approach
Knowledge engineering approach
To fulfill the goals presented in the beginning of the paper, the proposed approach needs to offer user-friendly means, such graphical tools, that enable data analysts and process/domain experts to create, visualize, query, filter, and navigate among process elements. Moreover, the model should follow formal semantics so that it can processed by software systems and enable functions such as model validation and verification.
The proposed approach provides a meta-model that defines meta-classes to formally describe concepts such as water treatment data, focusing on the water treatment process and its optimization using predicting and mechanistic methods. It includes key elements such as process performance, equipment, data descriptions, and predictive models, helping to explain how these concepts relate to water treatment processes (Figure 1). This model serves as a common framework for communication between domain experts and data analysts by offering a shared vocabulary and structure, making implicit knowledge explicit. It improves the data analytics process by helping both parties understand domain-specific problems and data characteristics more clearly.
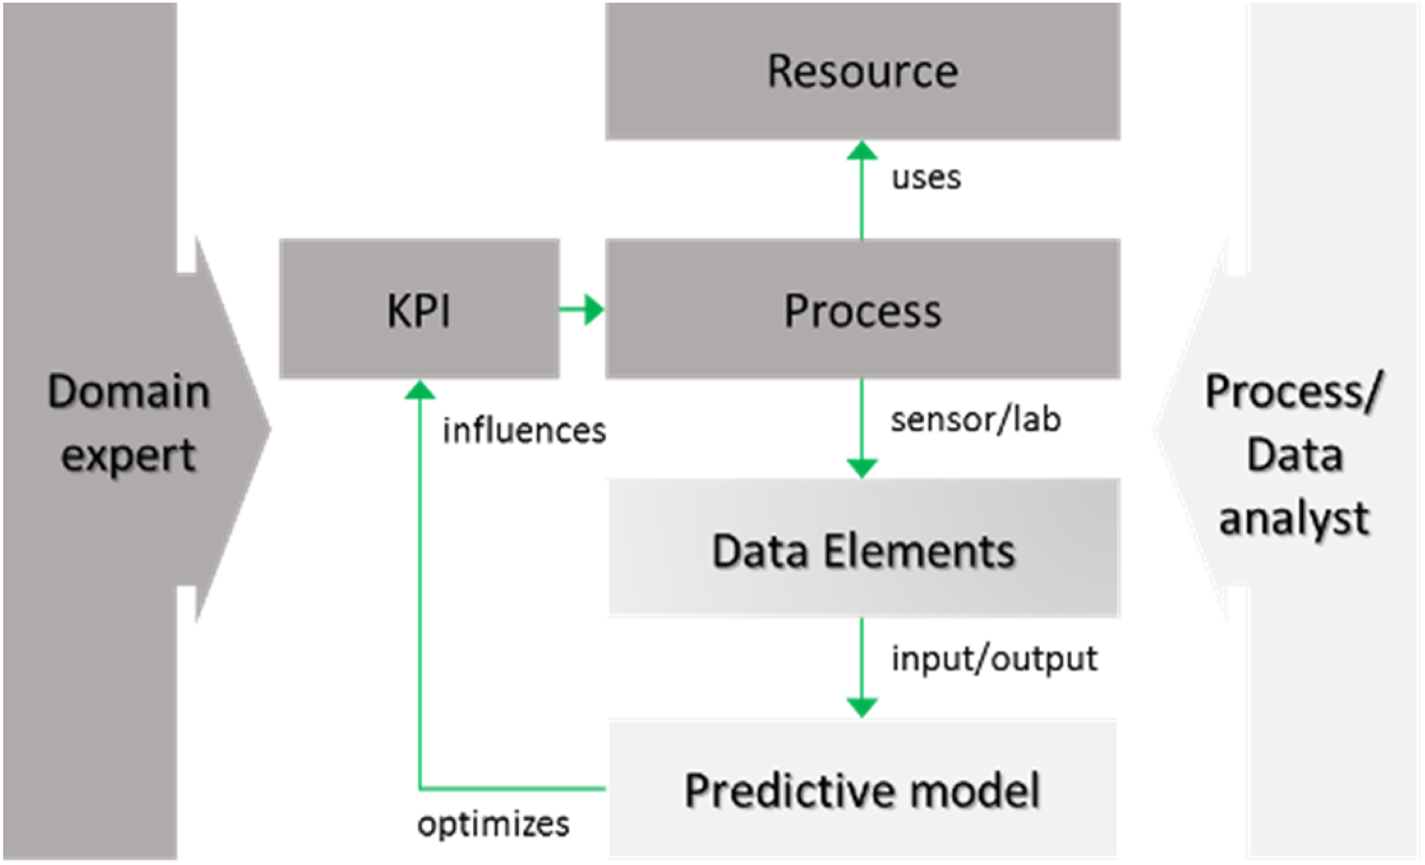
Modeling approach (adapted from 17 ).
The top-level concepts can be organized into three primary classes
17
:
Process scenarios, which detail the engineering technology used for water treatment and the related discrete process steps. Data modelling, which provides the conceptual foundations for representing data elements and KPIs. Predictive modelling, which defines how predictive and mechanistic (first principle) models are conceptualized.
In addition to this shared vocabulary, the model links these concepts to operational workflows, often represented graphically. This bidirectional linkage allows for a clearer connection between elements of the process (such as data points, KPIs, and predictive models) and their representation in workflow diagrams, enhancing collaboration and understanding among stakeholders.
Competency questions serve as practical benchmarks to validate the expressiveness and utility of the knowledge graph (KG). First, they test linguistic-semantic alignment by probing whether domain-specific terminology (e.g., “water quality” as a KPI) maps unambiguously to formalized concepts and relationships (e.g., Process→Influences→KPI). Simultaneously, they assess query language compatibility, ensuring the model's schema supports the operational needs of the users. Discrepancies in this translation—such as unrecognized terms or unsupported logical operations—reveal gaps in the model's expressiveness or computational design, necessitating schema refinements like introducing new edge types or redefining class hierarchies. By converting these questions into structured queries, we evaluate the knowledge graph's capability to retrieve interconnected information, verify semantic relationships, and facilitate decision-making processes. We provide six indicative competency questions, with a more comprehensive set developed for our research. The following competency questions were derived from use cases in water treatment plants:
Process-Parameter Association: Which parameters (e.g., pH, flow rate) are monitored or controlled by a specific process? Resource Allocation: What physical or chemical resources (e.g., activated carbon, sludge) are utilized by an industrial system? KPI Relevance: Which key performance indicators (e.g., energy efficiency, effluent quality) are linked to a system or subprocess? Model Applicability: What predictive or simulation models (e.g., ANN-based fouling detection) can optimize a given process? Process Connectivity: Which elements (e.g., equipment, data streams) are directly connected to a process? Input-Output Mapping: What input nodes (e.g., raw water intake) feed into the system, and what is their current stock/resource status?
These questions are intentionally scoped to avoid redundancy and ambiguity, focusing on granular, actionable insights. For instance, the last question emphasizes not only identifying input nodes but also their stock levels, enabling inventory-aware operational planning. By resolving such queries through graph traversals (e.g., edge filtering, node property retrieval), the KG demonstrates its capacity to unify fragmented data and contextualize it for domain-specific problem-solving. This structured approach ensures the KG aligns with industrial requirements, bridging the gap between abstract knowledge representation and practical, data-driven decision-making.
Water treatment knowledge model
To effectively represent an industrial water treatment process, we employ a structured framework that integrates domain expertise, operational data, and predictive analytics. This approach addresses challenges such as resource optimization, regulatory compliance, and sustainability by unifying knowledge into a semantically rich, machine-actionable model. We categorize concepts into three broad areas:
Water Treatment Process Modeling: This outlines the actual treatment process, detailing the necessary assets and components required for its operation. Processes are modeled as interconnected workflows (e.g., coagulation, filtration). Data Modeling: This encompasses essential data elements and key performance indicators (KPIs) pertinent to the water treatment process, grounded in domain-specific ontologies. Predictive and Simulation Modeling: This emphasizes the elements and parameters of fundamental and data analytics models related to the water treatment process, ensuring the integration of raw sensor data, expert heuristics, and AI-driven insights within a cohesive graph-based framework.
By formalizing entities (e.g., processes, resources, sensors) and relationships (e.g., causal dependencies, resource flows) our framework bridges the gap between human expertise and computational reasoning. The result is a scalable knowledge backbone that preserves institutional expertise and transforms it into a dynamic asset for innovation and efficiency.
Engineering methods
Engineering methods are industrial processes that improve the quality of water to make it appropriate for a specific end-use. Water treatment processes may vary slightly at different locations, depending on the technology of the plant and the water they need to process, but the basic principles are largely the same.
To effectively manage engineering methods, we break them down into discrete components. 17 These components collectively define workflows by simplifying complex operations into manageable steps, such as chemical dosing or filtration cycles. Each industrial process consists of these individual steps, which can be further divided into specialized sub-processes (e.g., anaerobic digestion within wastewater treatment). This hierarchical decomposition enables precise control over resource allocation and operational efficiency. A process part strategically combines human expertise (e.g., engineers, operators) and infrastructural resources (e.g., sensors, reactors) required to execute each step.
Water treatment processes can be physical, chemical, physico-chemical; we outline below that prominent ones:
Granular activated carbon filtration
GAC has been widely implemented for water treatment due to its large surface area that allows the adsorption of dissolved organic substances18,19 its capability to operate continuously without requiring a carbon-liquid separation 20 and small particle sizes. 21 GAC has been used for the removal of various pollutants from wastewater, such as COD. 22 The influencing parameters are the pH of the solution, the concentration of the target pollutant in the inlet, EBCT, dosage and surface groups of activated carbon and temperature.19,20
Membrane bioreactor
A Membrane Bioreactor (MBR) is a water treatment technology that combines biological treatment processes with membrane filtration. It integrates a biological treatment system, typically activated sludge or other microbial processes, with a membrane filtration unit (often microfiltration or ultrafiltration) to separate treated water from the sludge and other contaminants. MBRs have been widely studied for industrial wastewater treatment, focusing on COD, phosphorus, ammonium and nitrates removal. MBR's process model encompasses both biological and physical treatment, described by an activated sludge model and a membrane filtration model. 23
Key components of an MBR are the bioreactor and the membrane filter. The biological treatment occurs in the bioreactor. It houses microorganisms (such as bacteria) that break down organic matter in the wastewater. It functions similarly to a conventional activated sludge process, but typically operates in a more controlled environment within a tank. The membrane acts as a physical barrier to remove suspended solids, bacteria, and other contaminants from the water. The treated water (permeate) passes through the membrane, while the remaining solids (sludge) are retained within the bioreactor. Membranes can be made of materials such as ceramic, polymer, or stainless steel and operate based on processes like microfiltration or ultrafiltration.
Micro-filtration, ultra-filtration and nano-filtration
Microfiltration (MF), ultrafiltration (UF), and nanofiltration (NF) are all types of advanced membrane filtration technologies used in water treatment. These systems use semi-permeable membranes to remove particles, microorganisms, and contaminants from water. The primary differences between them lie in the pore size of the membrane and the types of substances they can filter out. The most common technologies applied in these filters, either alone or in combination, are sedimentation, activated carbon, membranes, ceramics. Each filtration method offers unique advantages depending on the level of treatment needed and the specific contaminants in the water being treated. MF is ideal for coarse filtration, removing large particles and microorganisms like algae and suspended solids. UF is more effective for filtering out smaller particles, bacteria, and viruses, making it suitable for fine filtration of water. NF provides more advanced filtration, capable of removing dissolved salts, organic compounds, and softening water by removing hardness-causing ions.
Reverse osmosis
Reverse osmosis (RO) is a water purification method that employs a semi-permeable membrane to separate water molecules from other substances. By applying pressure, RO overcomes osmotic pressure, which typically promotes balanced distribution. This process can eliminate dissolved or suspended chemicals and biological contaminants, like bacteria, and is commonly used in industrial applications and for producing drinkable water. In RO, the solutes remain on the pressurized side of the membrane, while the purified solvent moves to the other side. The size of the molecules determines what can pass through, with ‘selective’ membranes blocking larger molecules but allowing smaller ones, such as water molecules, to pass through.
Activated carbon absorption
Activated carbon filtration is a widely used method that relies on the adsorption of contaminants onto the surface of a filter. It is particularly effective at removing certain organic compounds (like unwanted tastes and odors, micropollutants), as well as chlorine, fluorine, and radon from drinking water or wastewater. However, it is not effective for removing microbial contaminants, metals, nitrates, or other inorganic substances. The efficiency of adsorption depends on the type of activated carbon, the composition of the water, and operational conditions. There are various activated carbon filter designs available to meet the needs of households, communities, and industries. While these filters are relatively simple to install, they require energy and skilled labor, and their maintenance can be costly due to the need for frequent filter replacements.
Coagulation-flocculation
Coagulation-flocculation is a chemical water treatment technique typically applied prior to sedimentation and filtration (e.g., rapid sand filtration) to remove suspended solids, particles, and contaminants from water and enhance the ability of a treatment process to remove particles. Coagulation is a two-stage process employed in various industrial processes where water quality is important, and its goal is to remove fine particles that are too small to be removed by simple filtration. Coagulation is the first stage of the process, where chemicals are added to water to destabilize and neutralize the electrical charges on suspended particles (colloids). This destabilization allows these particles to clump together and form larger aggregates. Flocculation is the second stage of the process, following coagulation. During this stage, the small, coagulated particles are agitated gently to promote the formation of larger, heavier aggregates called flocs. These flocs are large enough to settle out of the water or be removed by filtration.
Flotation/sand-filtration
Sand filtration is a purely physical water purification method. Sand filters provide rapid and efficient removal of relatively large, suspended particles. For optimal performance, sand filtration needs proper pre-treatment (typically coagulation-flocculation) and post-treatment (usually chlorine disinfection). Both the construction and operation can be costly. It's a more complex process, often requiring powered pumps, routine backwashing or cleaning, and careful control of the filter outlet flow.
Ion exchange
Ion exchange is a water treatment process that removes unwanted ionic contaminants by replacing them with less harmful ions. The process involves exchanging ions of the same electrical charge (either positive or negative) between the contaminant and the replacement substance.
Advanced oxidation processes
Advanced Oxidation Processes (AOPs) are efficient methods to remove organic contamination not degradable by means of biological processes. AOPs are a group of highly effective water and wastewater treatment technologies designed to degrade and remove organic pollutants, microorganisms, and other contaminants from water using powerful oxidants. These processes involve the generation of highly reactive oxidizing agents, particularly the hydroxyl radical (•OH), which is one of the most potent and non-selective oxidizing agents known. AOPs are particularly useful for treating persistent, non-biodegradable organic contaminants, which are difficult to remove using traditional water treatment methods. AOPs rely on external energy sources like electricity, ultraviolet (UV) radiation, or solar light, which makes them generally more costly than traditional biological wastewater treatment methods. Additionally, AOPs can be used for disinfecting water and air, as well as for cleaning contaminated soils.
Ultraviolet radiation
Concentrated ultraviolet (UV) light is widely used for its bactericidal properties in various applications, including drinking water treatment. UV tube devices are simple, low-cost, and efficient for quickly disinfecting water by killing harmful microorganisms. These devices typically consist of a pipe through which water flows slowly, with a UV light bulb powered by electricity or solar energy. UV systems can be designed for use at the household, community, or institutional level. While highly effective, UV disinfection does not address chemical or physical pollutants like salinity, heavy metals, or turbidity, and lacks a residual disinfection effect unlike chlorine.
Data modelling
Industrial water treatment processes often involve complex systems that generate vast amounts of data, such as sensors, machines, human inputs, and environmental factors. Data modeling refers to the creation of a structured representation (model) of the data involved in the water treatment operations. This model defines the relationships between various data elements and describes how data is captured, stored, processed, and used in the industrial environment.
Data elements in water treatment systems are modeled through a dual-layered abstraction framework. 17 The logical layer defines semantic attributes—role (e.g., input/output), type (e.g., pH, turbidity), and quantity—of each element, aligning with the Knowledge Graph's schema to ensure interoperability with standards like SAREF4WATR. For instance, input elements (e.g., raw water conductivity) serve as inputs to predictive models, while output elements (e.g., treated water quality) are derived from these models, enabling closed-loop optimization. Concurrently, the physical layer maps these elements to sensor measurements (e.g., IoT devices, ERP records), forming the KG's instance-level data backbone.
Key Performance Indicators (KPIs) are essential for modeling the overall performance parameters of a water treatment process. 17 These KPIs, which can be organized hierarchically according to standards like ISO 14031, 24 measure both process efficiency (e.g., energy consumption) and environmental impact (e.g., quality of discharged water). They can be linked to specific processes or process parts, serving as indicators of performance or impact within the water treatment plant. By employing inferencing methods such as graph traversals or rule-based reasoning, KPIs can be dynamically interconnected. For example, a performance KPI like the quality of water from a treatment filter can be converted into an environmental impact KPI, such as the volume of water discharged. This integration of logical-physical data modeling and KPI hierarchies facilitates semantic querying (e.g., competency questions) and supports the knowledge graph's role in merging predictive analytics with operational decision-making. This approach ensures that KPIs not only represent the current state of the process but also enable dynamic and adaptive management strategies.
The Smart Data Models (https://smartdatamodels.org) initiative compiles more than 400 data models for various application domains including water treatment & management. The models are released with an open license allowing the user the free use, free modification, and free sharing of the modifications without any other restriction. Source for the models is available at GitHub (https://github.com/smart-data-models). It is a collaborative effort, so it's possible to evolve the model and to suggest modifications and new data models. Considering the Smart Data Models already published, the one that is relevant to water treatment processes is ‘WaterQuality’ which represents water quality observations inside the water network.
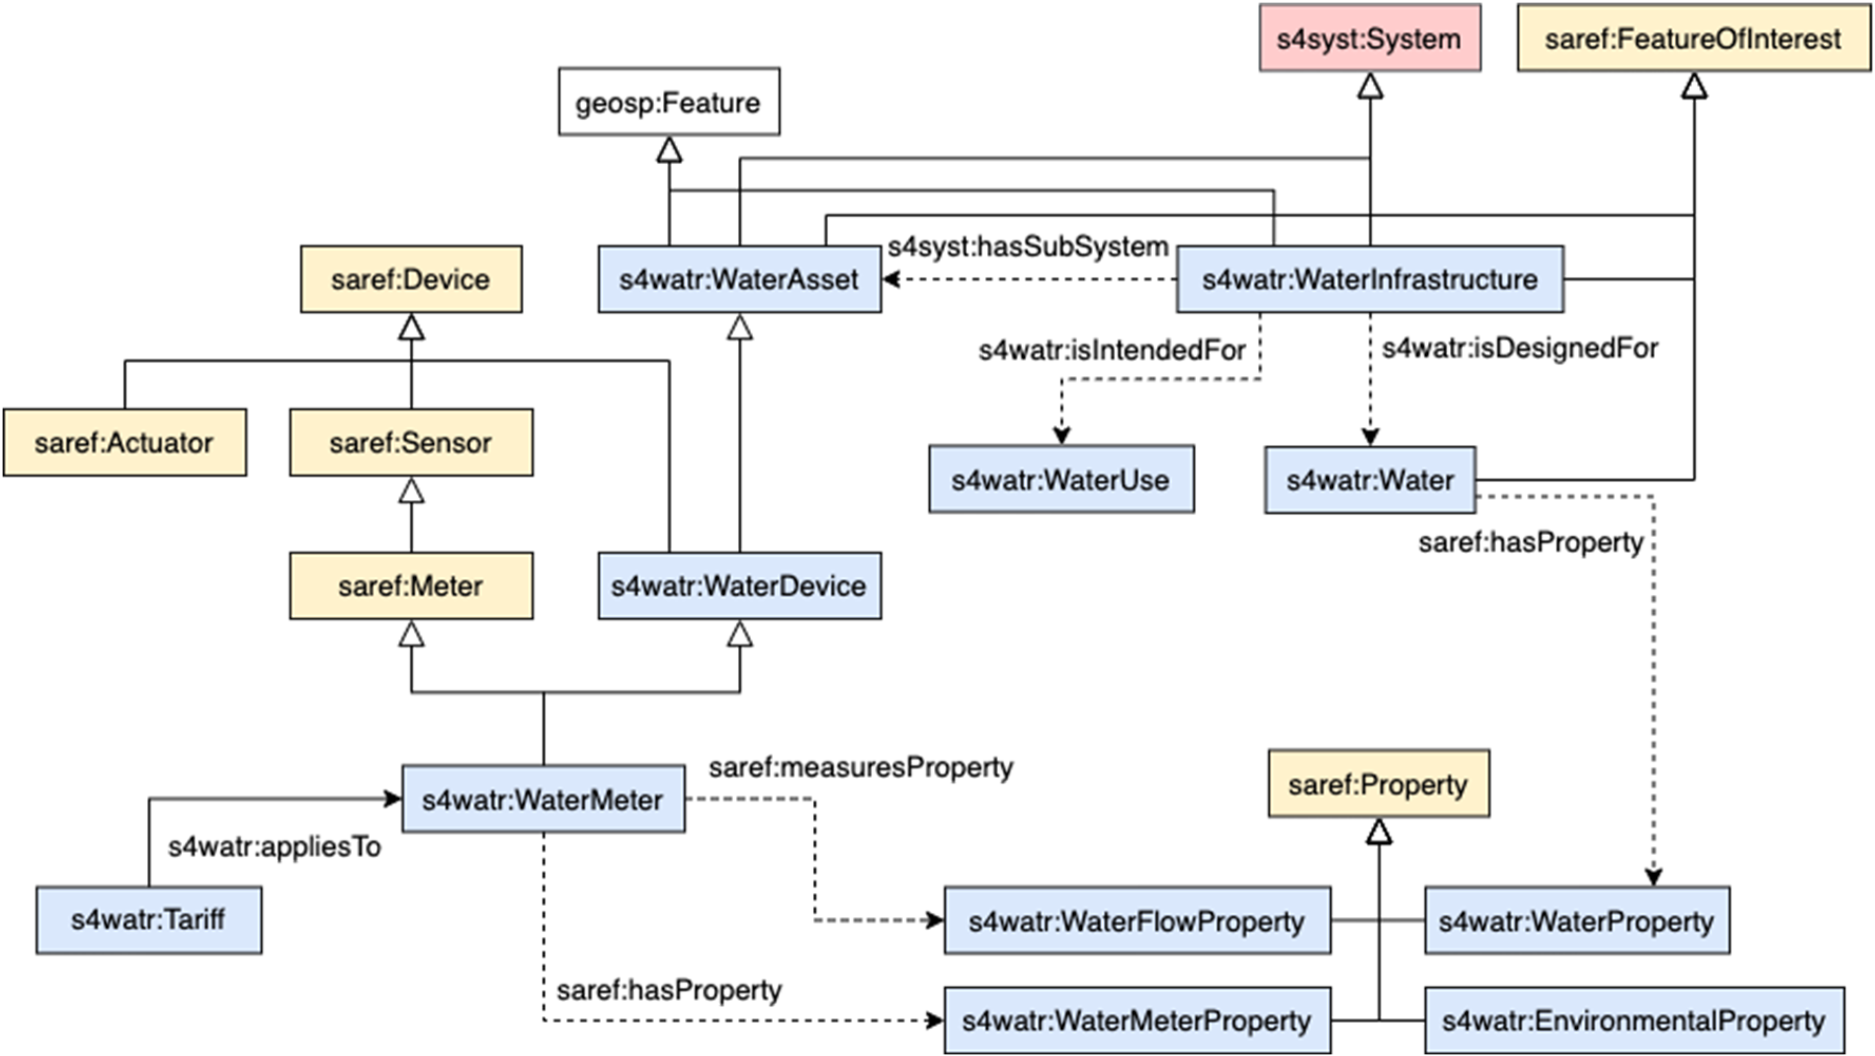
SAREF4WATR overview.
Another relevant initiative is the Smart Applications REFerence ontology (SAREF (Source: ETSI TS 103 264)), published by the European Telecommunications Standards Institute (ETSI) and intended to enable interoperability between solutions from different providers and among various activity sectors on the Internet of Things (IoT). SAREF has been extended to a broad of domains to be established as a cross-domain interrelationship between IoT information. Among them, SAREF4WATR is the extension that covers the Water domain. The SAREF4WATR extension is mainly focused on representing water infrastructure and the corresponding measurements. Despite this focus, the extension considers water quality monitoring and the alignment of different water quality events with different types of waters.
In our work, we adopt the Smart Data and SAREF4WATR models. Figure 2 presents an overview of the classes and the properties included in the SAREF4WATR extension. We follow the Observation and Measurement pattern for the representation of water data measurements. Under this pattern, specific measurements (saref:Measurements) are interlinked with specific Devices (saref:Device) to catalogue the specific digital system that performs the observation procedure. Both devices and measurements refer to a specific property (saref:Property). This property refers to the specific types of measurement (e.g., water flow, temperature, energy flows, etc.). These properties and subsequent measurements are observed in real elements or feature of interests (saref:FeatureOfInterest). These real objects normally are related to a geospatial representation (geosp:Feature) that covers points or specific areas (e.g., polygons, multi-polygons, etc.). Geospatial features are modeled using the Open Geospatial Consortium standards: https://www.ogc.org/standards/geosparql. Measurements are specified by a temporal specification (time:TemporalEntity) and a unit of measure (saref:UnitOfMeasure). There exists a special measurement related to the feature of interest to measure specific general indicators over a region.
Figure 3 shows the core data schema used for representing water treatment processes. This schema includes the main categories and their relationships, such as processes, data, predictive models, and key performance indicators (KPIs). The figure illustrates how various treatment technologies are connected to the resources and data they generate or consume. Under the general structures of the Smart Data and SAREF4WATR data models, we have built the interrelationships between resources and the specification of the corresponding industrial variables accordingly to several processes to be monitored and controlled within specific eater treatment processes. This aspect has served to represent under the model the main industries, processes and technologies used. Complementary to this aspect, we represented into the core schema (Figure 3) the interrelationship between the process technologies and the different resources (data) generated or consumed. A detailed listing of the water data properties employed in our work and the corresponding mapping to the Smart Data and SAREF4WATR data models is provided in Appendix A.
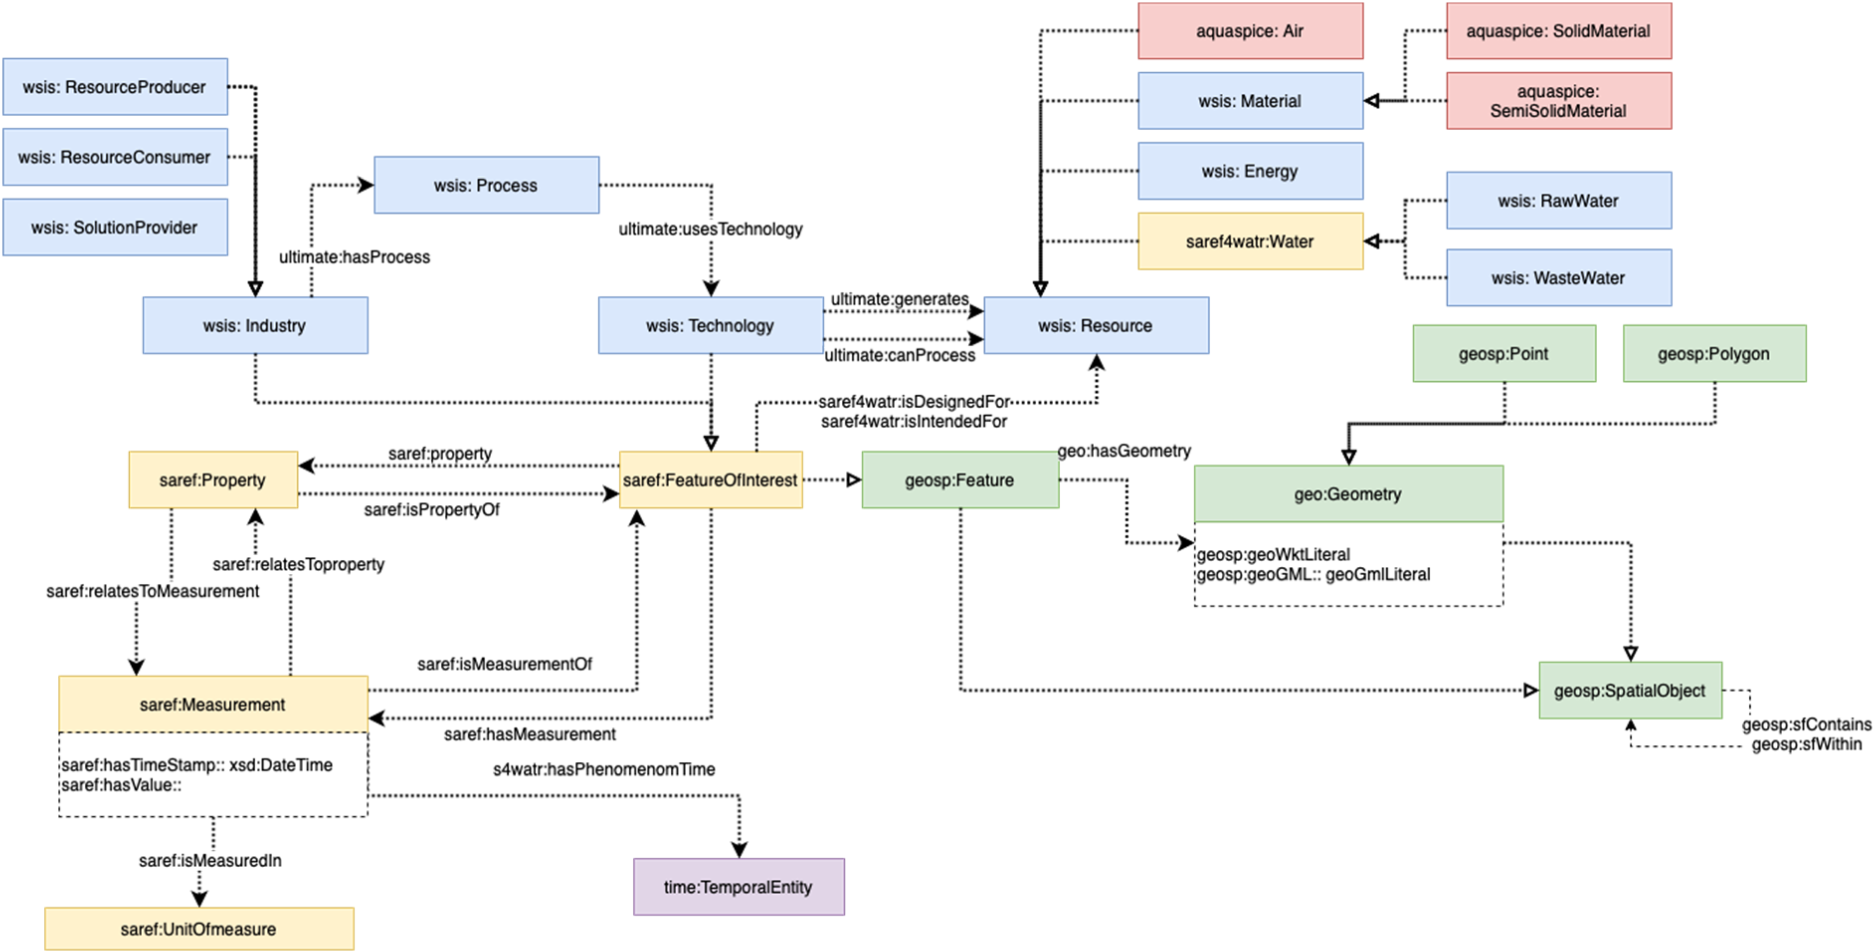
Core data schema.
Predictive modeling involves creating mathematical and computational representations (models) of the various processes involved in treating water. These models simulate the behavior of different physical, chemical, and biological processes that occur during water treatment, allowing for better understanding, optimization, prediction, and management of water quality. A predictive model represents a logical definition of the data-driven or first principle (mechanistic) model developed to predict / simulate parts of the treatment process.25,26
The main goal of predictive modeling in water treatment is to improve decision-making, enhance system efficiency, and optimize resource utilization (e.g., energy, chemicals, water). It also helps in predicting outcomes under different conditions, optimizing operational performance, and ensuring regulatory compliance. 27 Predictive models within the industrial water treatment framework are classified into three primary methodologies: mechanistic models (e.g., computational fluid dynamics for simulating membrane efficiency 23 ), data-driven models (e.g., LSTM networks for real-time fouling detection 25 ), and logical rule-based systems (e.g., threshold-triggered alerts for effluent quality compliance). While non-parametric methods exist, most models rely on parameterized structures Parameters vary by model type: mechanistic models use empirical constants derived from physicochemical laws, data-driven models optimize trainable weights (e.g., neural network layers predicting sludge retention), and logical systems encode domain heuristics into decision trees. These parameters are formalized as metadata within the knowledge graph in order to enable semantic querying.
In the remaining of this chapter, we outline the fundamental types of data-driven models, we survey prominent models from each type, and we highlight the key model elements and attributes we used for representing them in the KG.
Data acquisition and soft-sensing models
The integration of data acquisition and sensing technologies forms the foundation of modern wastewater treatment plants, enabling precise monitoring and providing critical data for informed decision-making in complex treatment processes. A variety of traditional measurement and analysis instruments, such as pH analyzers, turbidity sensors, and water quality monitors, are essential for gathering real-time data on various water quality indicators. However, these systems are often limited by high installation and maintenance costs, as well as by their susceptibility to sensor degradation over time. Recent advances in AI and ML have introduced innovative approaches to data collection, reducing the dependency on hardware-based systems using soft sensors.28,29
A soft sensor is software that estimates a hardware-like signal. It is utilized to indirectly measure variables that are difficult to measure due to cost or technical limitations. Soft sensors use process data as model input to predict the target variables. The process data can typically be obtained relatively easily and are composed of signals from hardware sensors and actuators. The prediction model can be classified as data-driven, knowledge-based, or hybrid.30–32
Process monitoring and anomaly detection models
Effective process monitoring and anomaly detection are critical to the stability and efficiency of wastewater treatment operations. The inherently dynamic and complex nature of wastewater data makes it challenging to maintain consistent treatment performance. 25 Traditional control systems rely on mechanistic models, which often fail to capture the variability and non-linearity of data in real-time. Advanced monitoring systems enhance the control of the water treatment process by detecting malfunctions, and sensor faults as well as identifying abnormal process operations or conditions.29,33 The adoption of AI/ML models in process monitoring has provided a solution by enabling more adaptive and robust control systems that continuously analyze process data, detect deviations from expected patterns, and identify potential malfunctions.
Outlier detection and anomaly detection concern the identification of observations that fall outside of an expected distribution or pattern; such abnormal observations are called outliers or anomalies. 34 Outlier detection targets simpler deviations, while anomaly detection is more suited to identifying complex patterns. Outlier detection techniques, such as clustering and principal component analysis, can be used to recognize data points that fall outside normal operating conditions, indicating potential sensor faults and process anomalies. Anomaly detection methods, often driven by deep learning, can identify complex patterns and suspicious events that traditional statistical analysis might miss. Anomalies identification can act as an early warning system, allowing operators to take proactive measures, preventing costly downtime, ensuring regulatory compliance and enabling predictive maintenance. 35
Performance evaluation and water quality assessment models
Assessing the performance of water treatment processes is essential to ensure compliance with environmental regulations and to optimize the efficiency of treatment processes. The performance of a treatment plant is evaluated via the degree of reduction of BOD, COD and SS, which constitute organic pollution. 36 The performance efficiency of a treatment plant depends not only on proper design and construction but also on good operation and maintenance.37,38 Traditionally, performance evaluation involves periodic laboratory analyses, which can be time-consuming and may not provide the real-time insights needed to address process inefficiencies promptly.
In recent years, AI/ML models have been gradually employed as powerful tools for enhancing performance evaluation through water quality prediction. Water quality refers to recommended standards for the quality of the final effluent or the inflow of a water treatment plant and is determined by measuring water quality indicators against parametric standard values and regulatory requirements. Water quality indicators include physical, chemical (inorganic and organic) and microbiological characteristic parameters.39,40
Process simulation and optimization models
Process simulation and optimization play a crucial role in enhancing the efficiency, cost-effectiveness, and sustainability of wastewater treatment plants. 41 Given the complexity and variability of the data characteristics, traditional mechanistic models are often insufficient to capture the full scope of interactions within treatment processes. 38 AI/ML models offer a more flexible and adaptive approach, enabling the simulation of complex systems and optimizing operations based on real-time data. 42
AI-enhanced process simulation uses data-driven models to replicate the behavior of treatment processes under various scenarios. For example, reinforcement learning algorithms can optimize aeration control in biological treatment tanks, minimizing energy consumption while maintaining treatment efficacy. 43 Similarly, genetic algorithms and neural networks can be used to optimize chemical dosing, reducing the cost of reagents while ensuring compliance with effluent quality standards. 44 By continuously learning from historical and current data, these models can adapt to changes in influent composition, providing dynamic optimization that improves plant performance over time. Additionally, what-if scenario analysis tools allow operators to evaluate the impact of different operational strategies, promoting data-driven decision-making. 45
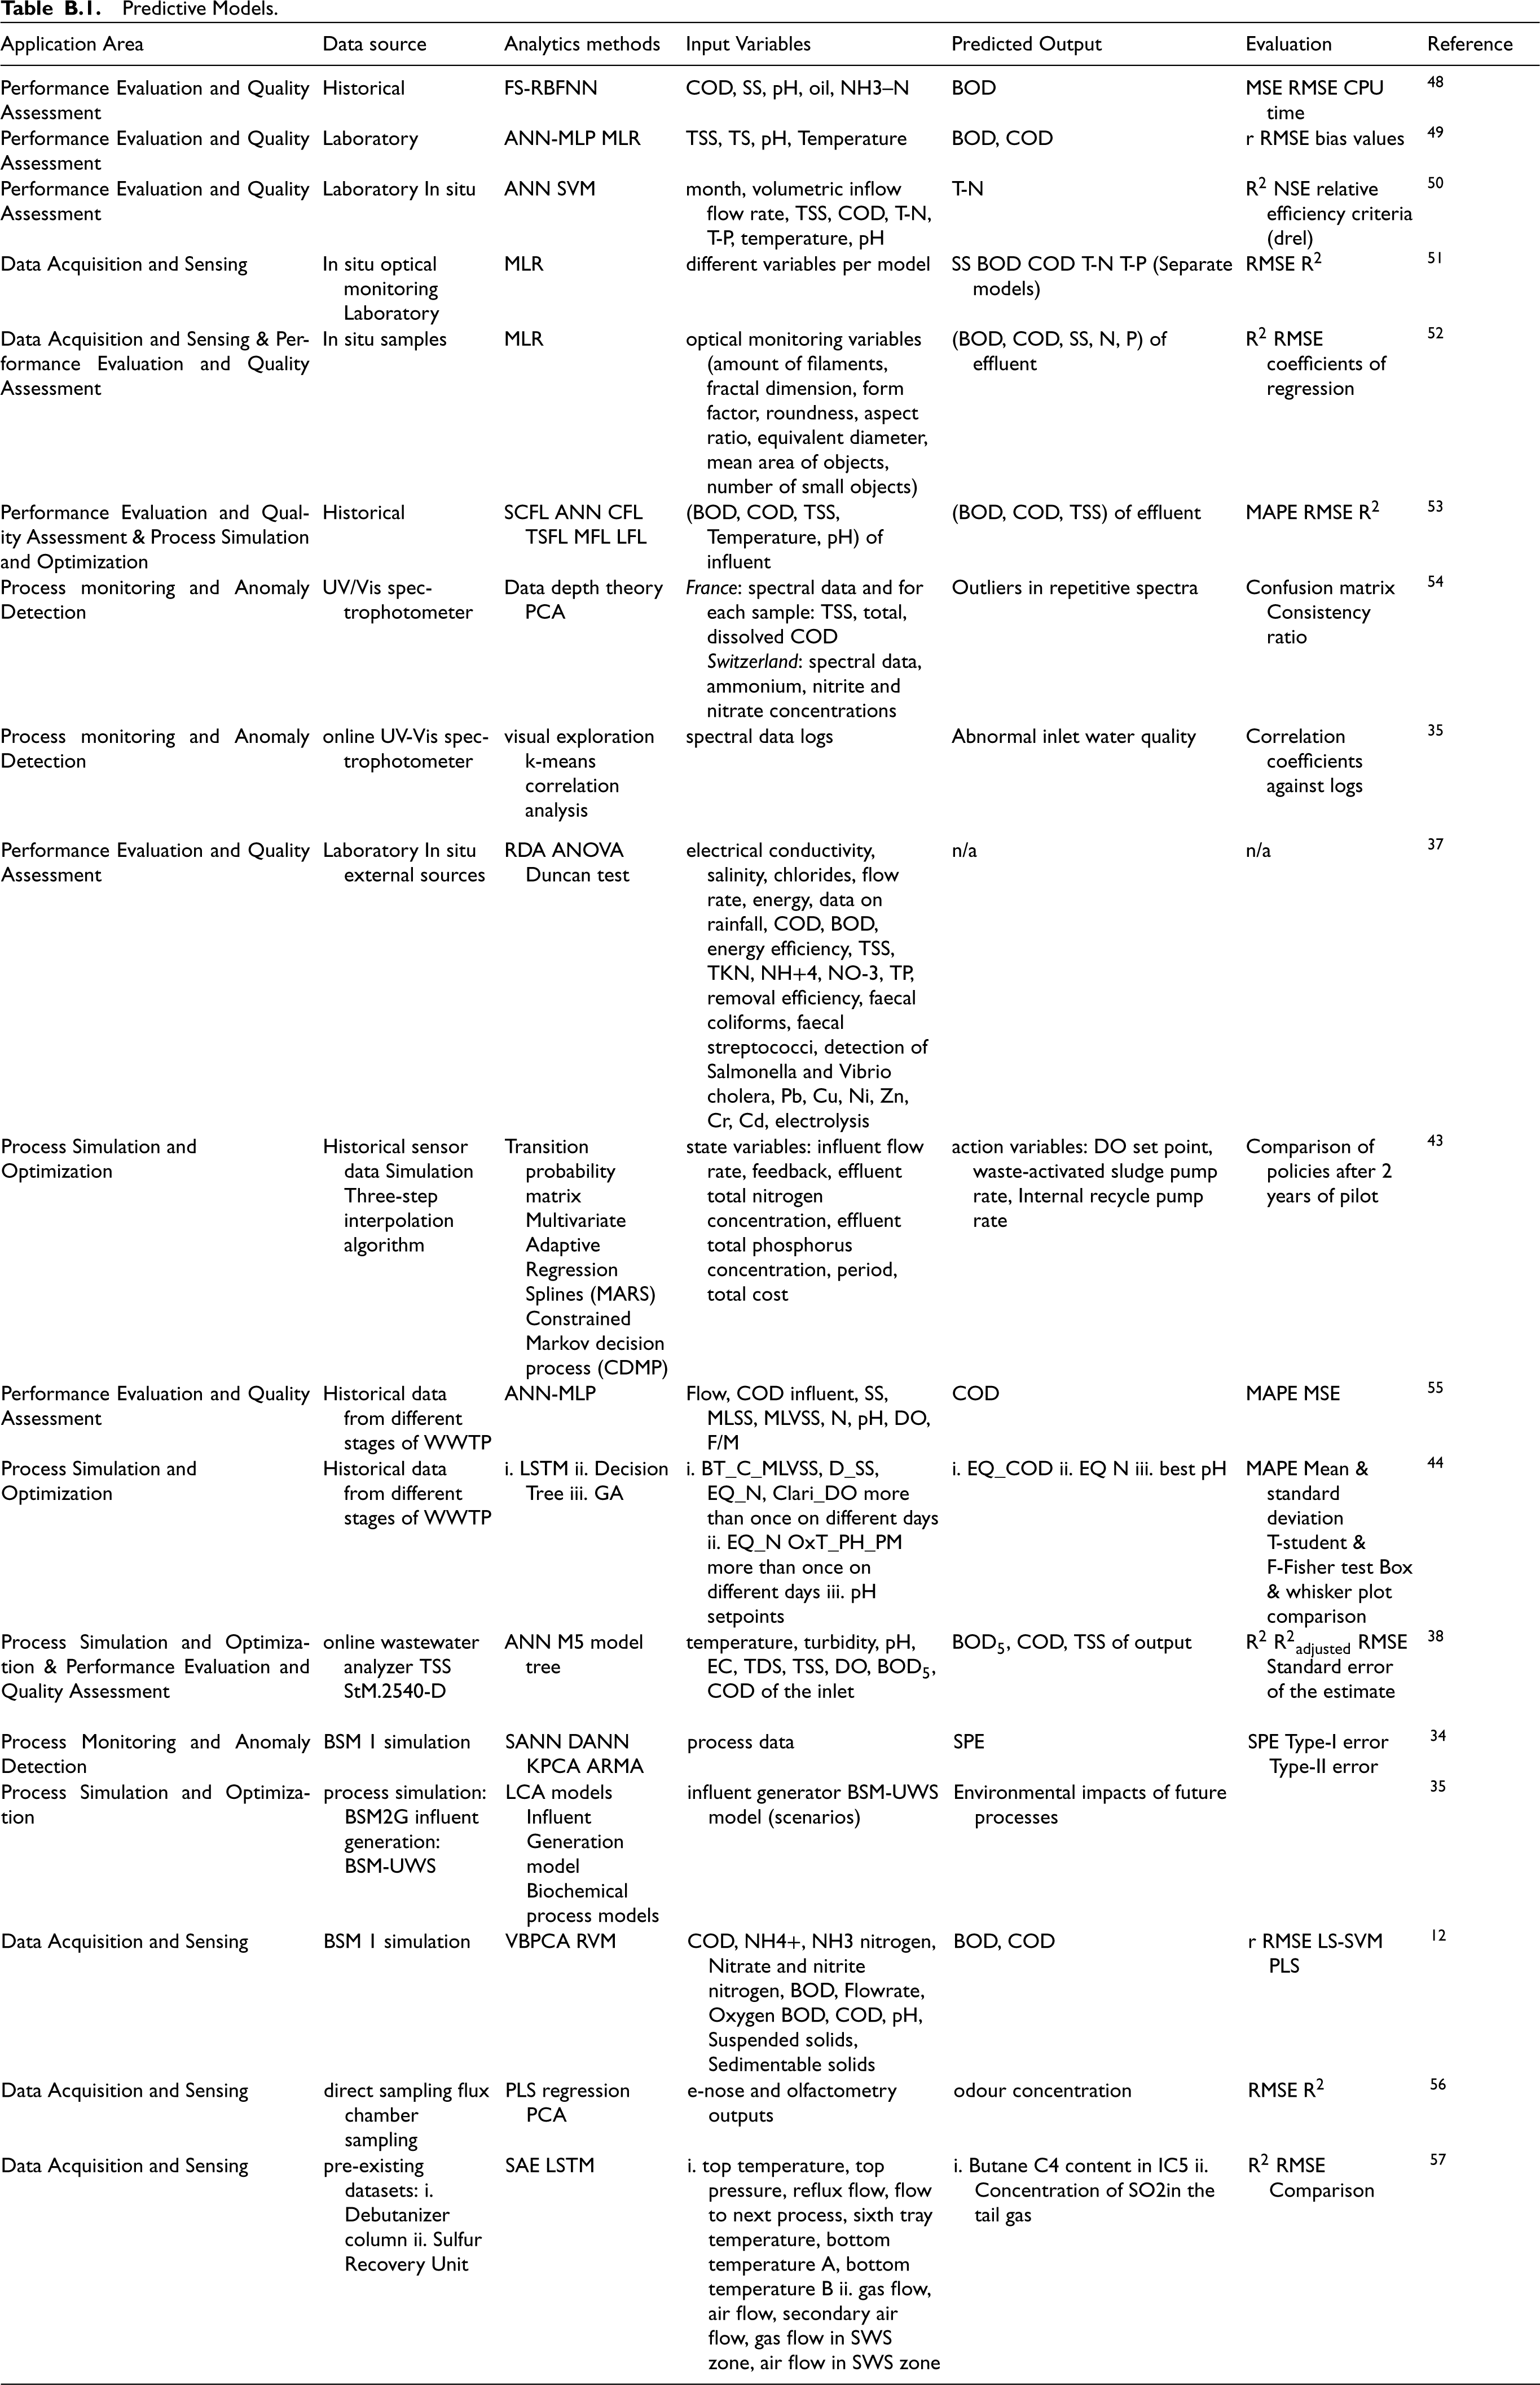
Detailed information about the predictive models derived from the literature is comprehensively summarized in a dedicated section in Appendix B.
Methodology & implementation
Implementing a KG representing industrial water treatment knowledge involves creating a structured, interconnected schema that captures the complex relationships and entities involved in water treatment processes. This KG integrates data from diverse sources, such as treatment methods, chemical agents, equipment, water quality parameters, regulatory standards, and operational procedures. By modeling these elements as nodes and the relationships between them as edges, the KG enables a semantic representation of the entire water treatment lifecycle and fostering advanced searches through intuitive query capabilities. This chapter describes the design of the KG schema and the KG implementation.
Schema
The knowledge graph (KG) schema structures industrial water treatment systems as a semantic framework comprising nodes (vertices) and edges (arcs) that define relationships between entities (Figure 4). At its core, an Industrial System vertex aggregates interconnected Processes, each annotated with Parameters (e.g., pH, flow rate) and optionally linked to Predictive Models (e.g., mechanistic simulations, AI/ML algorithms). Performance is quantified via KPIs (e.g., energy efficiency, effluent quality), which are associated with the Industrial System through HasKPI edges and further detailed by KPIParameter nodes representing measurable attributes.
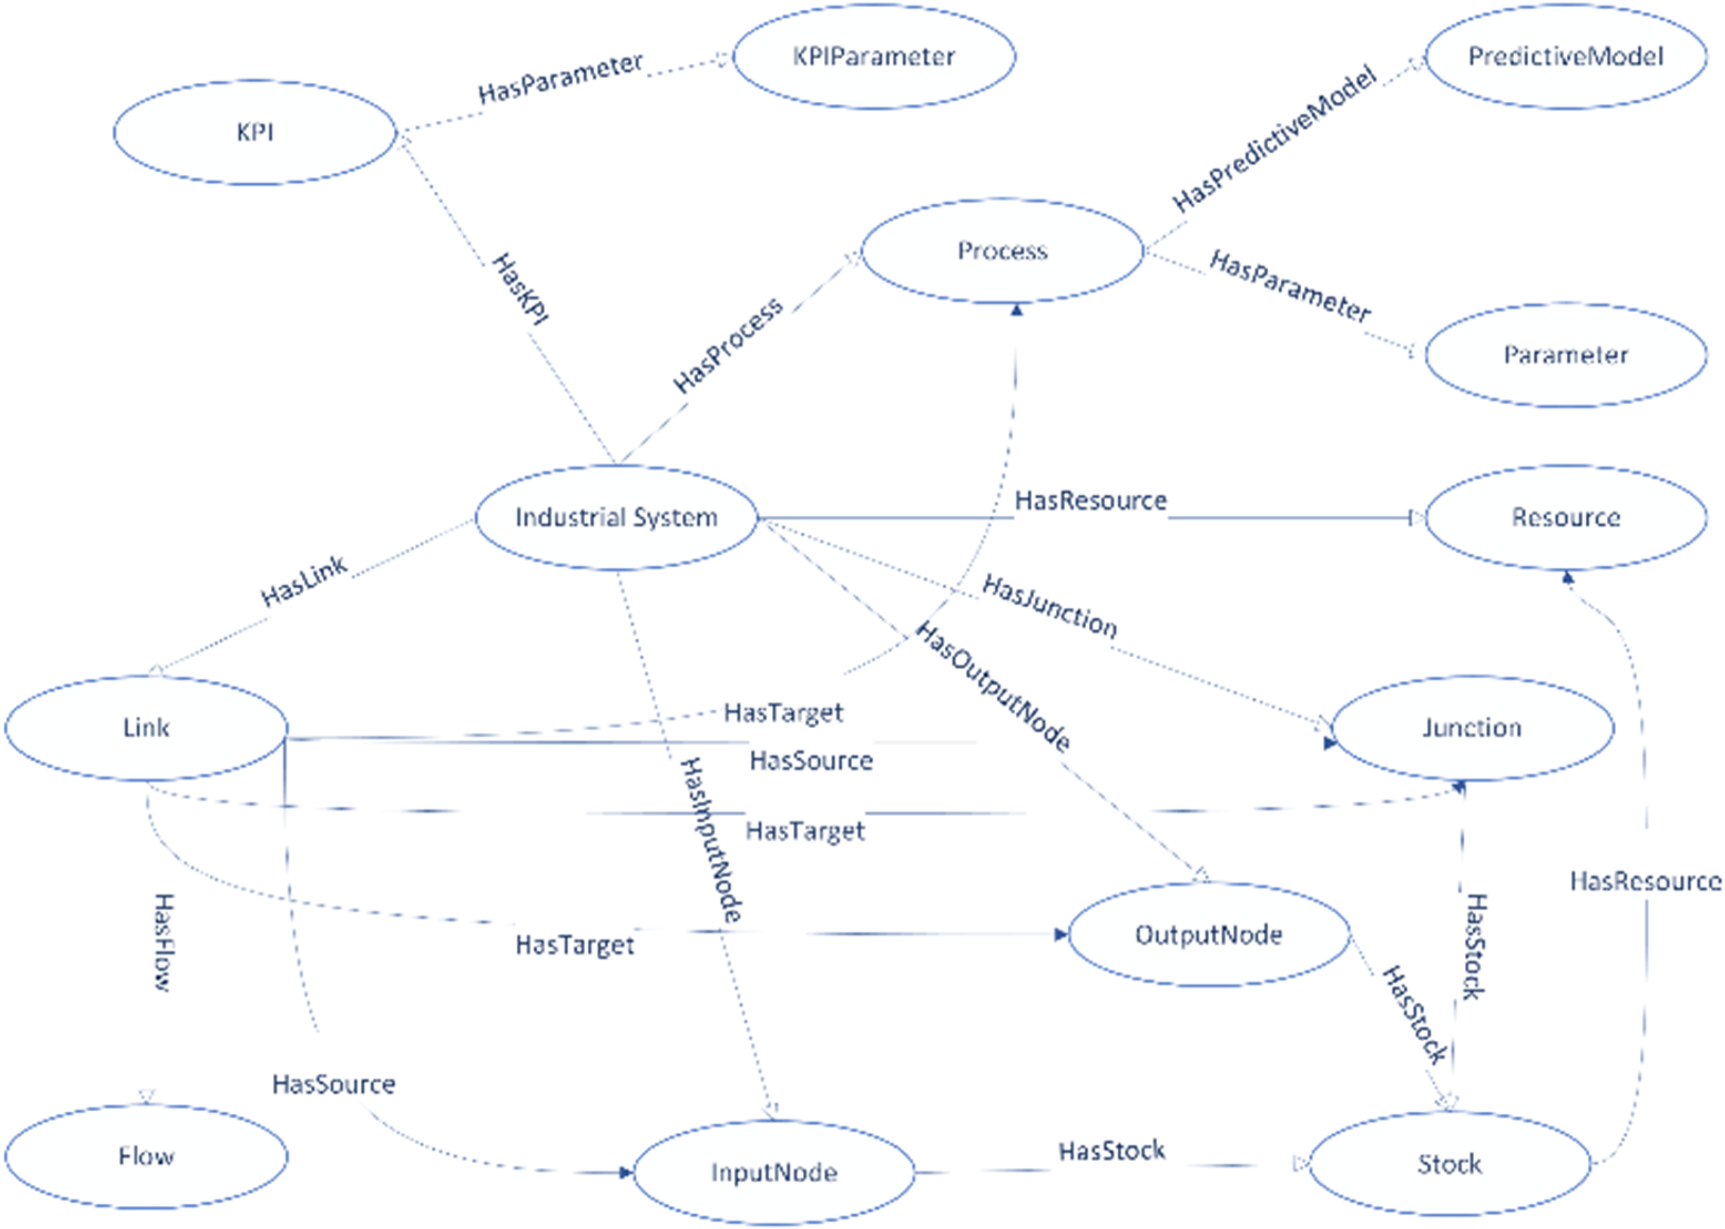
KG schema.
The Industrial System integrates Resources (e.g., Water, Sludge, NaOH) and Junctions—nodes that manage resource inventory via Stock edges. Links model material or data flows (e.g., "Sludge Out," "Conductivity In") between Input/Output Nodes, Processes, and Junctions, ensuring traceability across the treatment lifecycle. For instance, a Link may originate from an InputNode (source) and target a Process (e.g., coagulation), with its Flow type defining the transferred substance or metric.
Figure 5 shows a visualization of a KG instance, where different edge and vertex classes are denoted with different colors, while edges are depicted with lines connecting vertices, which are shown as circles. The figure demonstrates how various categories of data and processes are interconnected, providing a holistic representation of knowledge for water treatment processes.
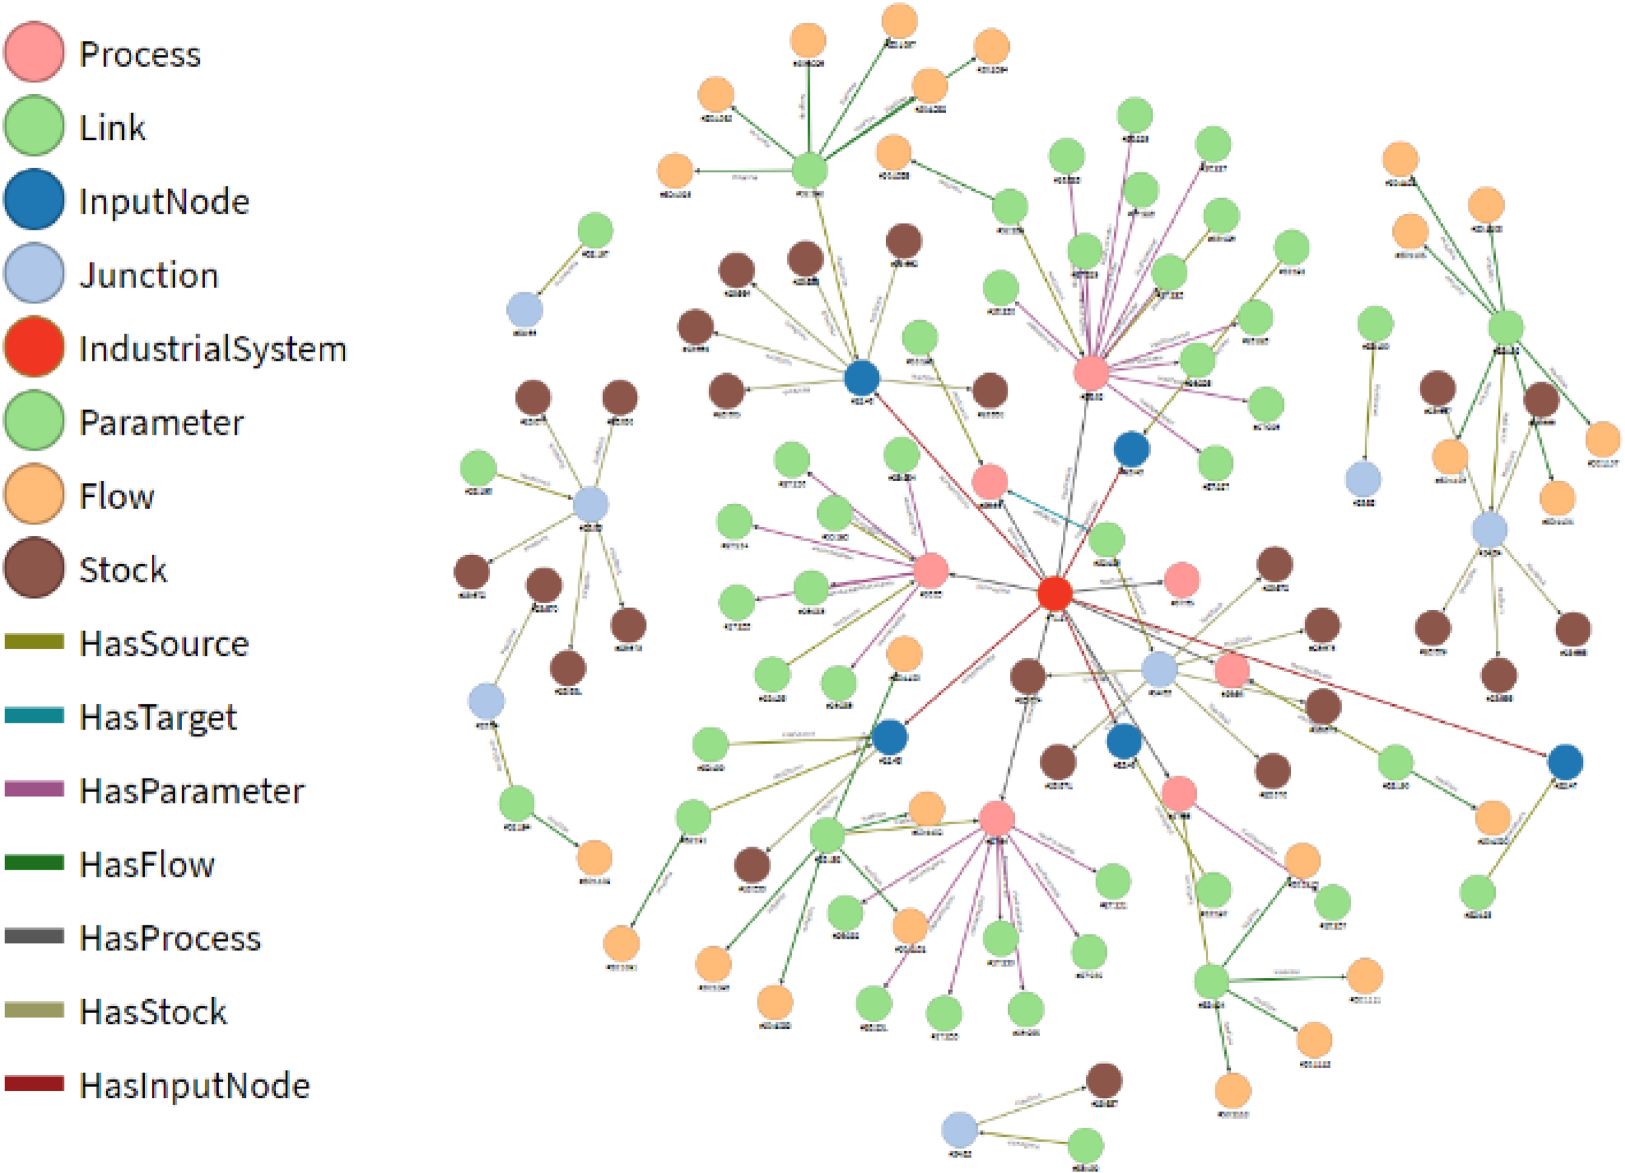
KG instance example.
The selection of a graph database platform is driven by the operational demands of industrial water treatment systems, which require scalability to manage high-velocity sensor data, semantic rigor to enforce compliance with standards like ISO 14031, and interoperability with legacy systems such as ERPs and IoT networks. Security mechanisms, including role-based access and encryption, are prioritized to safeguard sensitive operational metrics, while expressive query languages enable complex traversals for resolving competency questions, such as identifying inefficiencies in resource flows.
The implementation unfolds in four stages, beginning with schema definition to formalize the industrial ontology into machine-readable classes (e.g., Process, KPI) and edges (e.g., HasParameter). Data integration follows, combining manual inputs from domain experts, automated scripts for structured data conversion, and semi-automated ETL pipelines to harmonize heterogeneous sources. Query execution accesses the knowledge base through both simple retrievals (e.g., listing all processes) and complex queries (e.g., correlating membrane efficiency with sludge levels), while visualization tools provide intuitive exploration of graph structures.
Graph databases are evaluated through a taxonomy of schema models. Schema-less systems, while flexible, risk inconsistencies in industrial settings, whereas schema-full systems offer auditability but lack adaptability. Hybrid systems, such as OrientDB, strike a balance, enforcing strict hierarchies (e.g., IndustrialSystem → Resource) while permitting runtime extensions (e.g., ad-hoc sensor nodes), making them ideal for dynamic environments.
OrientDB emerges as the optimal choice, meeting industrial requirements through ACID compliance for transactional integrity, native ETL support for legacy system integration, and query versatility via SQL-like syntax and Gremlin compatibility. Its real-time visualization tool, OrientDB Studio, enables bidirectional editing, allowing plant managers to interactively refine the KG while maintaining alignment with operational KPIs. Trade-offs inherent to hybrid schemas, such as potential inconsistencies, are mitigated through governance rules (e.g., mandatory metadata fields).
The implementation (Figure 6) aligns with our research objectives by embedding predictive model parameters (e.g., LSTM weights, CFD constants) as KG metadata, directly linking simulations to actionable KPIs. Semantic interoperability—the consistent alignment of data semantics across heterogeneous systems—combined with strict schema enforcement (adherence to predefined structural and relational constraints) ensures compliance with schema requirements.
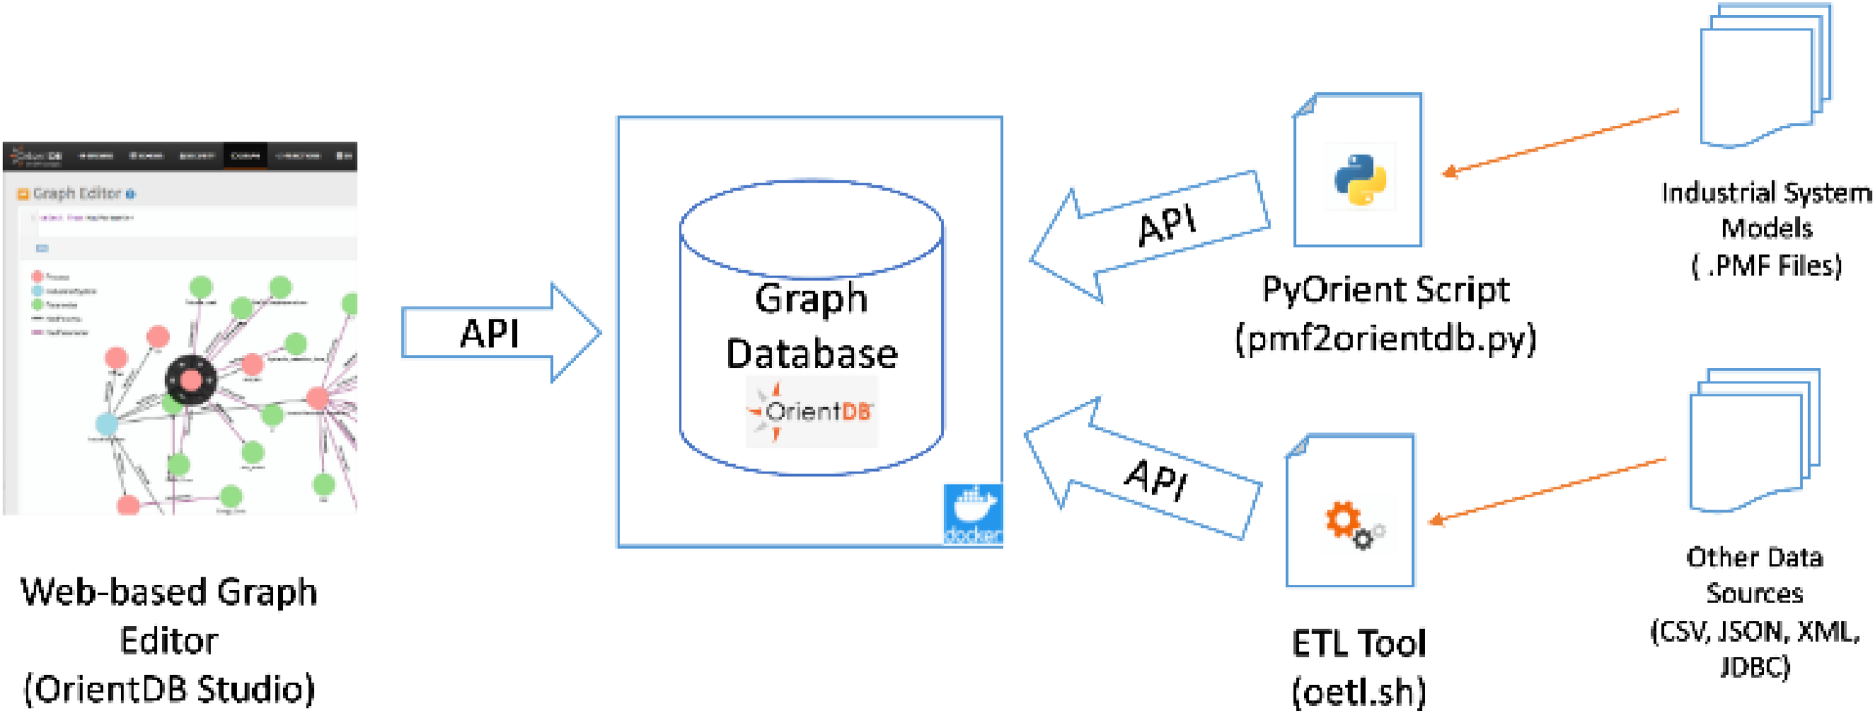
KG implementation approach.
In conclusion, the selected platform enables the transformation of fragmented industrial knowledge into a unified, queryable framework. By leveraging OrientDB's hybrid schema and integration capabilities, the KG bridges operational agility with auditability through data lineage tracking, directly addressing the research goal of enabling data-driven decision-making in water treatment ecosystems. This alignment ensures adherence to schema requirements while maintaining semantic consistency and capturing dependencies between predictive models and process workflows.
The data storage layer utilizes OrientDB, an open-source ACID-compliant (Atomicity, Consistency, Isolation, Durability) NoSQL database management system designed to handle both graph-based and document-oriented data models. With a capacity to store up to 120,000 records per second, OrientDB is able to support high-throughput industrial applications. Its horizontally scalable architecture enables seamless distribution across servers via a zero-configuration multi-master framework, ensuring linear scalability and enhanced performance as infrastructure expands.
OrientDB supports 23 native data types, including STRING, BOOLEAN, INTEGER, and DOUBLE, and offers flexible schema management through schema-less, schema-full, or hybrid modes. In hybrid mode, predefined fields coexist with custom extensions, balancing structure and adaptability. The system employs optimistic concurrency control (OCC) for transactions and atomic operations, minimizing data locks to maximize availability while ensuring transactional integrity. Extensibility is achieved through plugins, which add functionalities such as automated backups, syslog integration, and advanced monitoring.
For querying, OrientDB integrates SQL (augmented with graph-specific extensions) and Apache TinkerPop 3's Gremlin language. While Gremlin provides graph-native traversal capabilities, this work prioritizes SQL for its familiarity and compatibility with relational query patterns. Data integration is streamlined via APIs for Python, Java, JavaScript, and PHP, alongside a customizable Extract-Transform-Load (ETL) tool (oetl) for efficient knowledge graph population.
The embedded OrientDB Studio offers a web-based interface for graph visualization and manipulation. Users can manually edit schemas, auto-generate data entry forms for schema validation, and explore relationships interactively. Data is rendered dynamically as graphs or tabular results, accommodating both technical and non-technical users.
Security is robust: SSL/TLS 1.2 secures communications, AES encryption protects disk-stored data, and granular role-based access control (RBAC) governs permissions (CREATE, READ, DELETE) at database and server levels. Administrators assign roles to users, ensuring compliance with organizational security policies.
The proposed software platform enables Knowledge Graph (KG) population through three complementary methods, each addressing specific data integration requirements in industrial water treatment systems. These approaches—automated scripting, semi-automated ETL workflows, and manual graph editing—are detailed below, with references to their technical implementation.
Automated KG population with custom scripts
Custom scripts leverage OrientDB's TCP/IP APIs to programmatically interact with the database, enabling remote creation and population of graph instances. Development teams utilize these APIs to build utilities (compiled programs or interpreted scripts) tailored to specific data formats. A critical application involves processing XML-based. PMF files generated by the Process Simulation & Modelling (PSM) tool, 45 which encapsulates water treatment process configurations. By integrating OrientDB's PyOrient Python library with XML parsing modules, the pmf2orientdb.py tool translates PMF data into SQL commands that align with the KG schema (Section 4.1). This automation ensures efficient mapping of entities such as flow parameters into nodes and edges, preserving semantic relationships defined in the schema.
Semi-Automated population with the ETL tool
OrientDB's oetl tool facilitates Extract-Transform-Load (ETL) workflows for heterogeneous data sources, including tabular (CSV), hierarchical (JSON/XML), and relational (JDBC) formats. The tool extracts raw data, applies transformation rules (e.g., data type conversion, null handling), and loads structured records into local or remote graph instances. For example, KPI datasets stored in CSV files (Figure 7).are mapped to the KPIParameter class (Section 4.2), with columns like targetValue and measurementUnit validated against schema constraints. This semi-automated method balances efficiency and precision, enabling users to refine transformations before final ingestion.
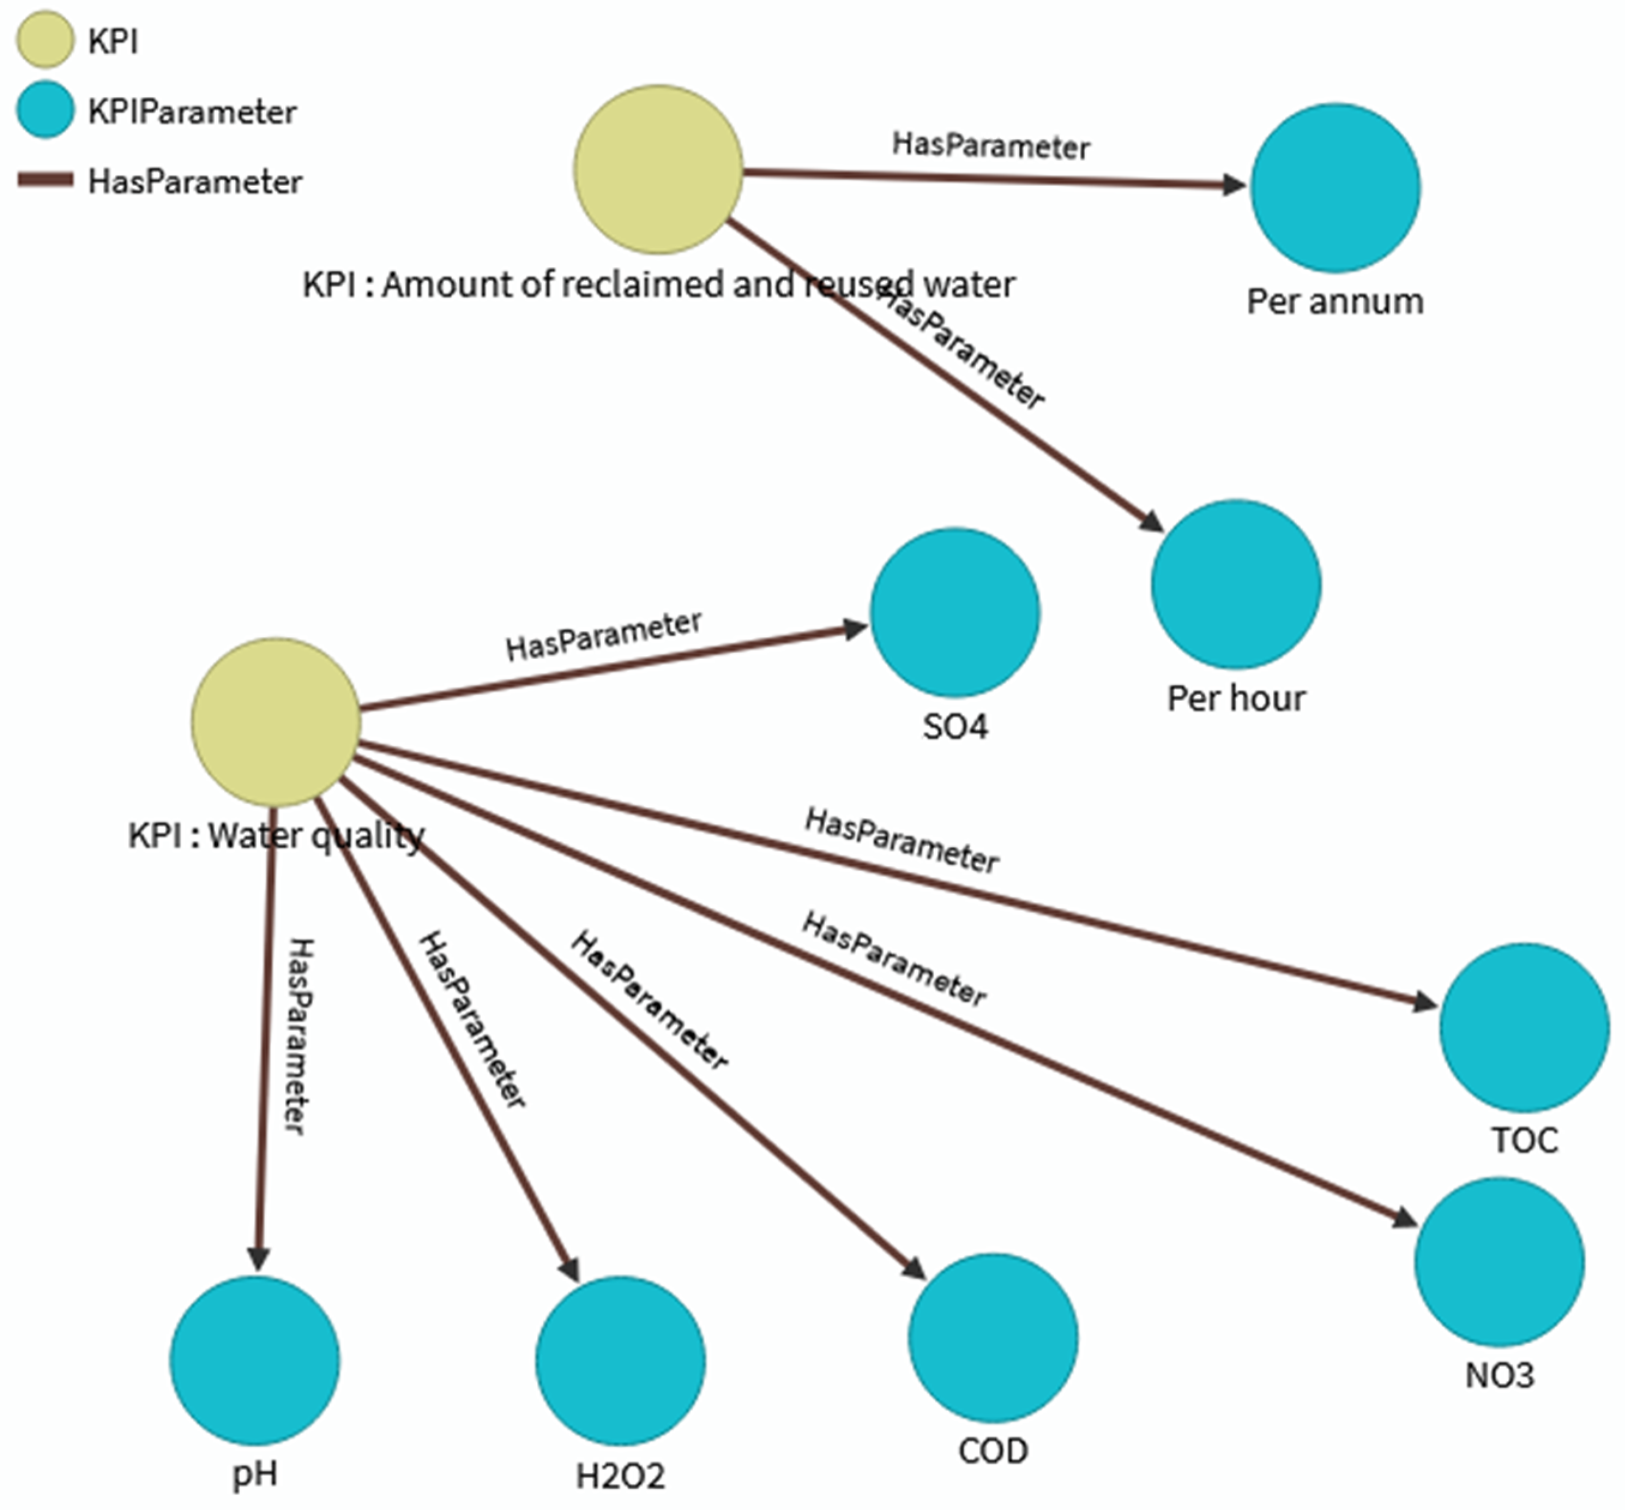
KPIS and their parameters.
OrientDB Studio provides a web-based interface for manual KG manipulation, accessible to users with appropriate permissions. Administrators assign roles (e.g., read, write) to control access to database resources, ensuring compliance with security policies. Users connect to populated KGs via credentials or initialize new instances using SQL “IMPORT” commands. The editor auto-generates forms for node/edge creation, enforcing schema-defined properties (e.g., Resource nodes require unit fields). Real-time visualization allows users to explore relationships, such as links between processes and predictive models, while tabular views support bulk edits. Manual methods are ideal for ad-hoc updates, such as correcting sensor metadata or refining simulation parameters, with schema validation preventing inconsistencies. The OrientDB Studio SCHEMA tab allows graph schema navigation. Vertices, subclasses of the "V" class, and edges, subclasses of the "E" class, are explorable within this tab (Figure 8). Users can view and modify predefined class properties.
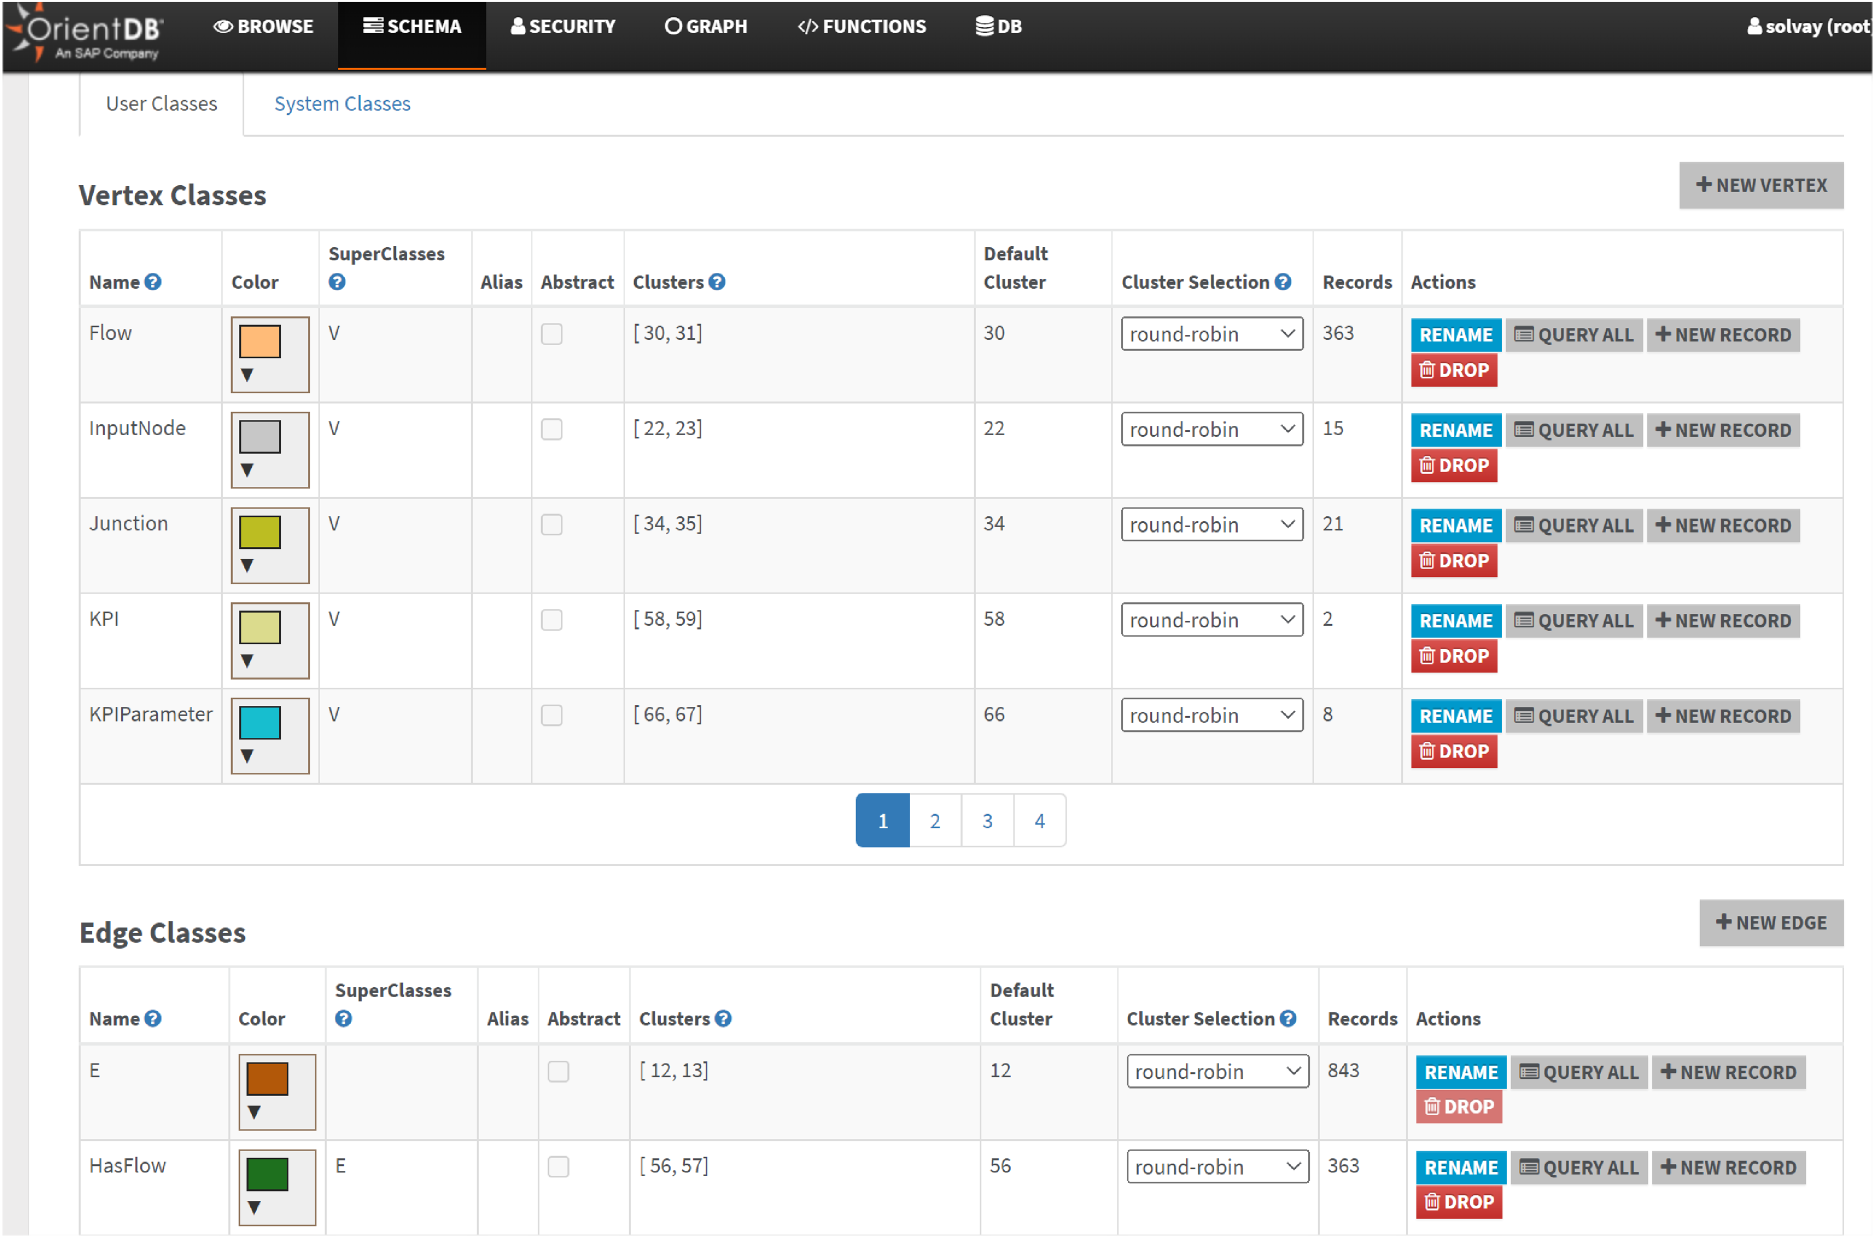
KG schema in orientDB studio.
A defined schema for a class enables a data entry form (Figure 9) with all fields for that class upon clicking "+ NEW RECORD".
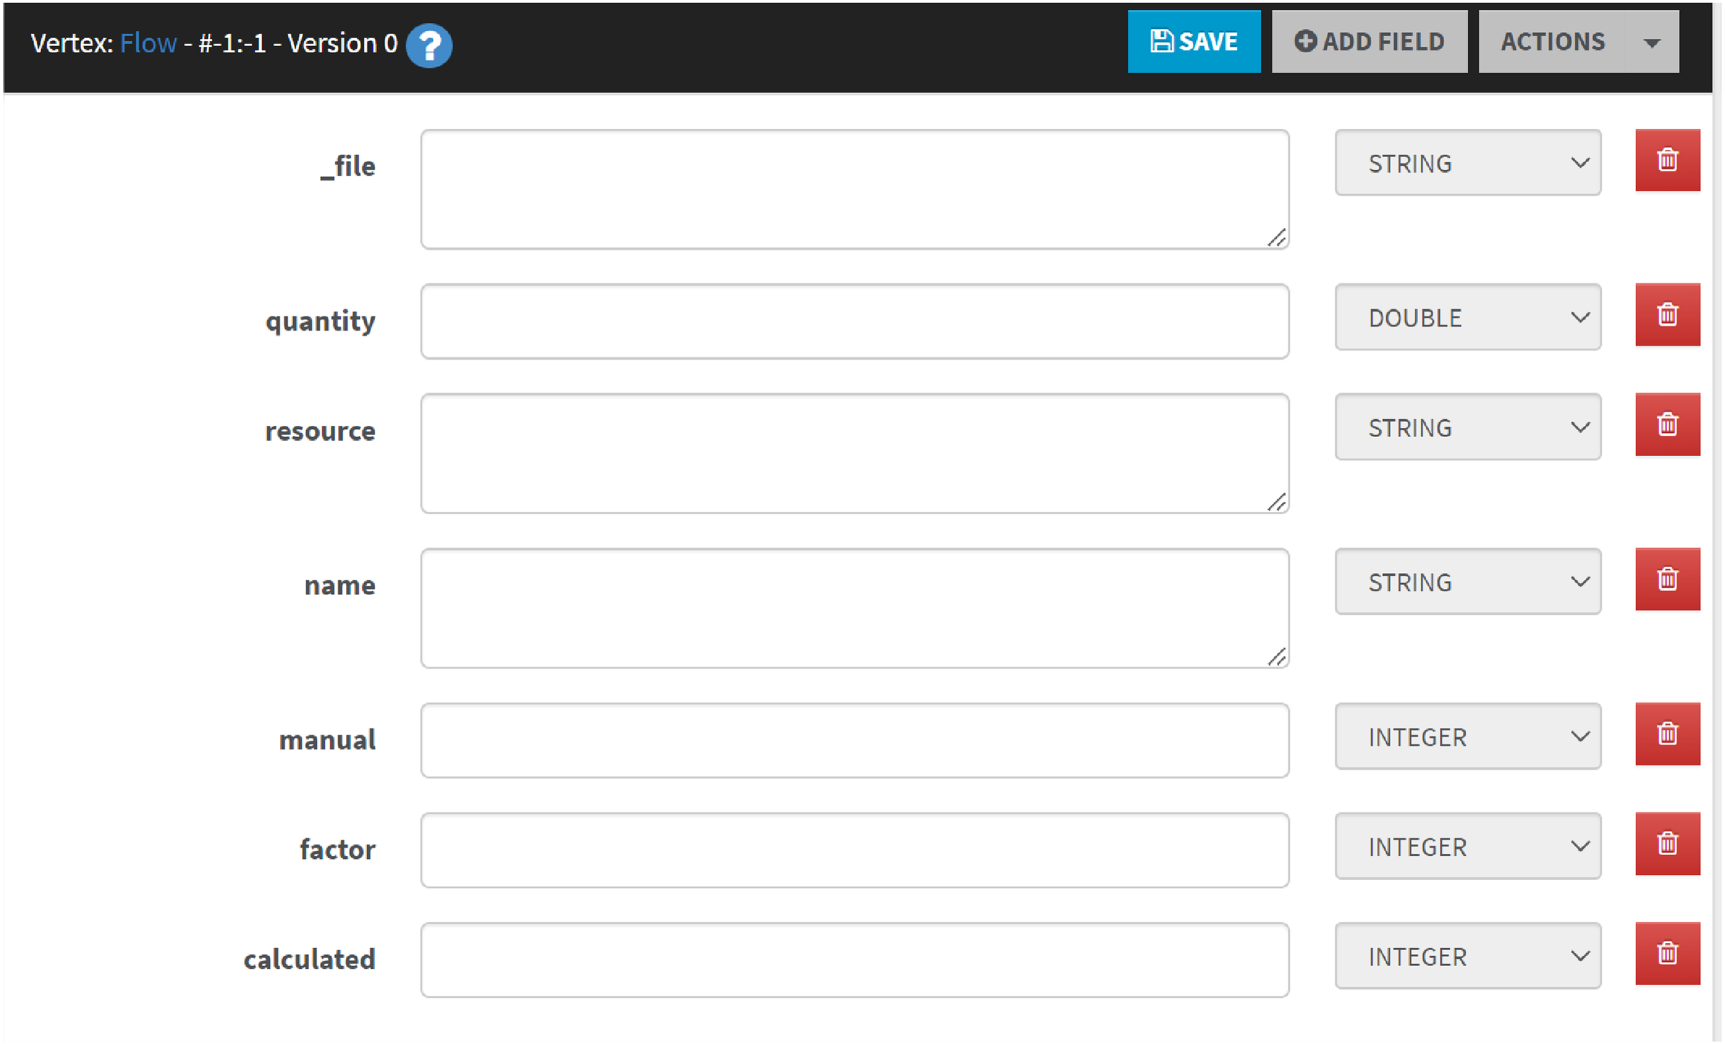
‘Flow’ Vertex edit form.
In the schema editor of OrientDB Studio, clicking "QUERY ALL" for a class directs users to the data browser. The query field is pre-populated with the necessary SQL query. Executing this query displays results in a table. Queries can be bookmarked or transferred to the graph editor/visualizer. The "GRAPH" tab allows users to visualize data by submitting queries that progressively add results to the graph (Figure 10).
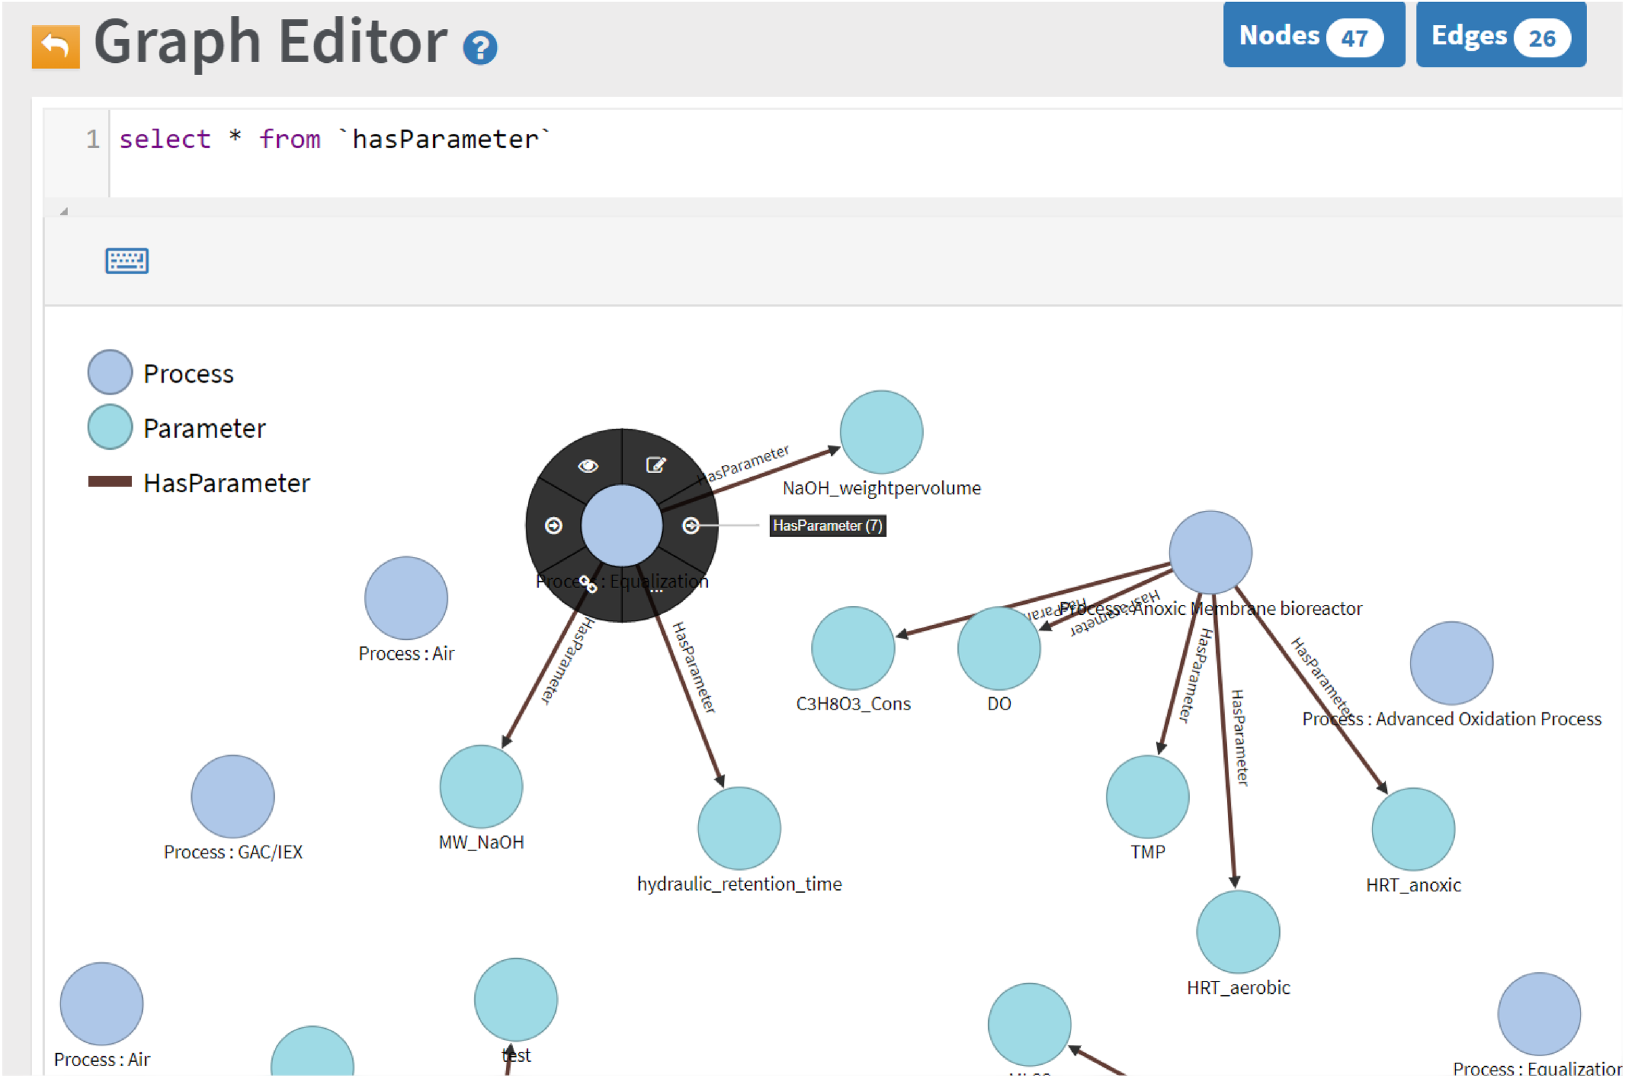
Exploring the incoming edges (HasProcess) of a vertex.
Clicking on a graph node provides access to various actions. These include viewing and visualizing incoming and outgoing relationships, editing vertex or edge data using auto-generated forms, creating new edges and vertices, and deleting existing ones.
Figure 10 illustrates process vertices and their parameters. Clicking the edit button on a vertex or edge allows users to modify properties using an auto-generated form (Figure 11) based on schema definitions. More complex queries are detailed in the next section.
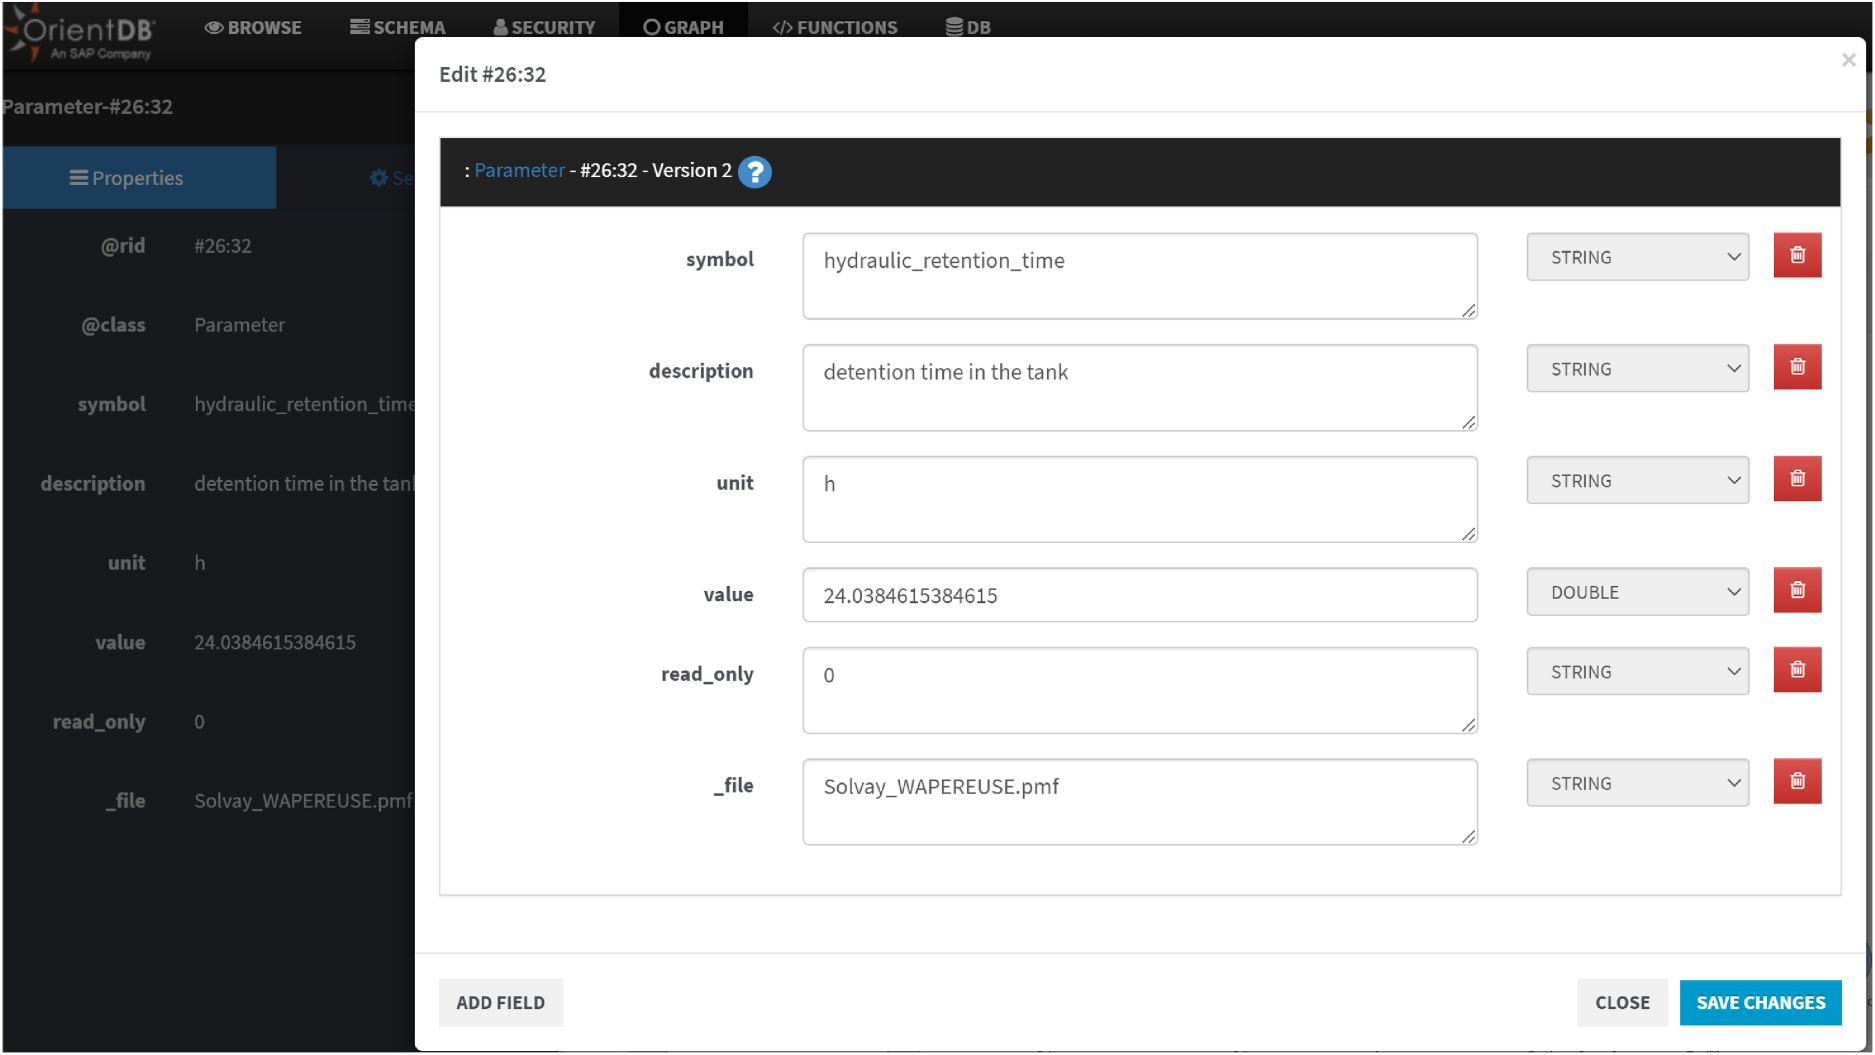
Vertex edit form in the graph editor.
In this section, we demonstrate how to verify that the knowledge graph (KG) and its hosting software platform can answer 'competency questions’. A competency question is a natural language query that a knowledge model should be able to answer. The ability to answer these questions is measured by the possibility of specifying one or more queries using a chosen query language and the concepts and relationships of the knowledge model. To compile a suitable set of competency questions, various real-world scenarios covering most case studies must be considered, while invalid questions should be removed. This includes redundant, incomplete questions, and those that cannot be answered due to the limitations of the formalism used.
Query results are displayed in tabular and graph formats, each suited to different use cases. Graphs visualize relationships between domain elements, while tables provide a detailed view of graph node properties. Iterative querying, output evaluation, and modifications enhance knowledge quality (accuracy and completeness) to meet domain needs. The queries addressing the defined competency questions and their results are as follows:
Which parameters (e.g., pH, flow rate) are monitored or controlled by a specific process?
This query aims to uncover all the critical data parameters that are actively monitored or regulated within a specific process in an industrial water treatment system. The expected outcome is a set of parameters, such as pH, flow rate, temperature, and chemical concentrations, that are essential for maintaining process efficiency and compliance. Understanding these parameters helps in identifying the data requirements and dependencies necessary for effective process management and optimization. Additionally, this information can be used to develop predictive maintenance strategies and improve overall system reliability.
Using the Graph Editor, this query can be answered by retrieving all Process Vertices and filtering by Process name (Figure 12), regardless of complete KG schema knowledge.
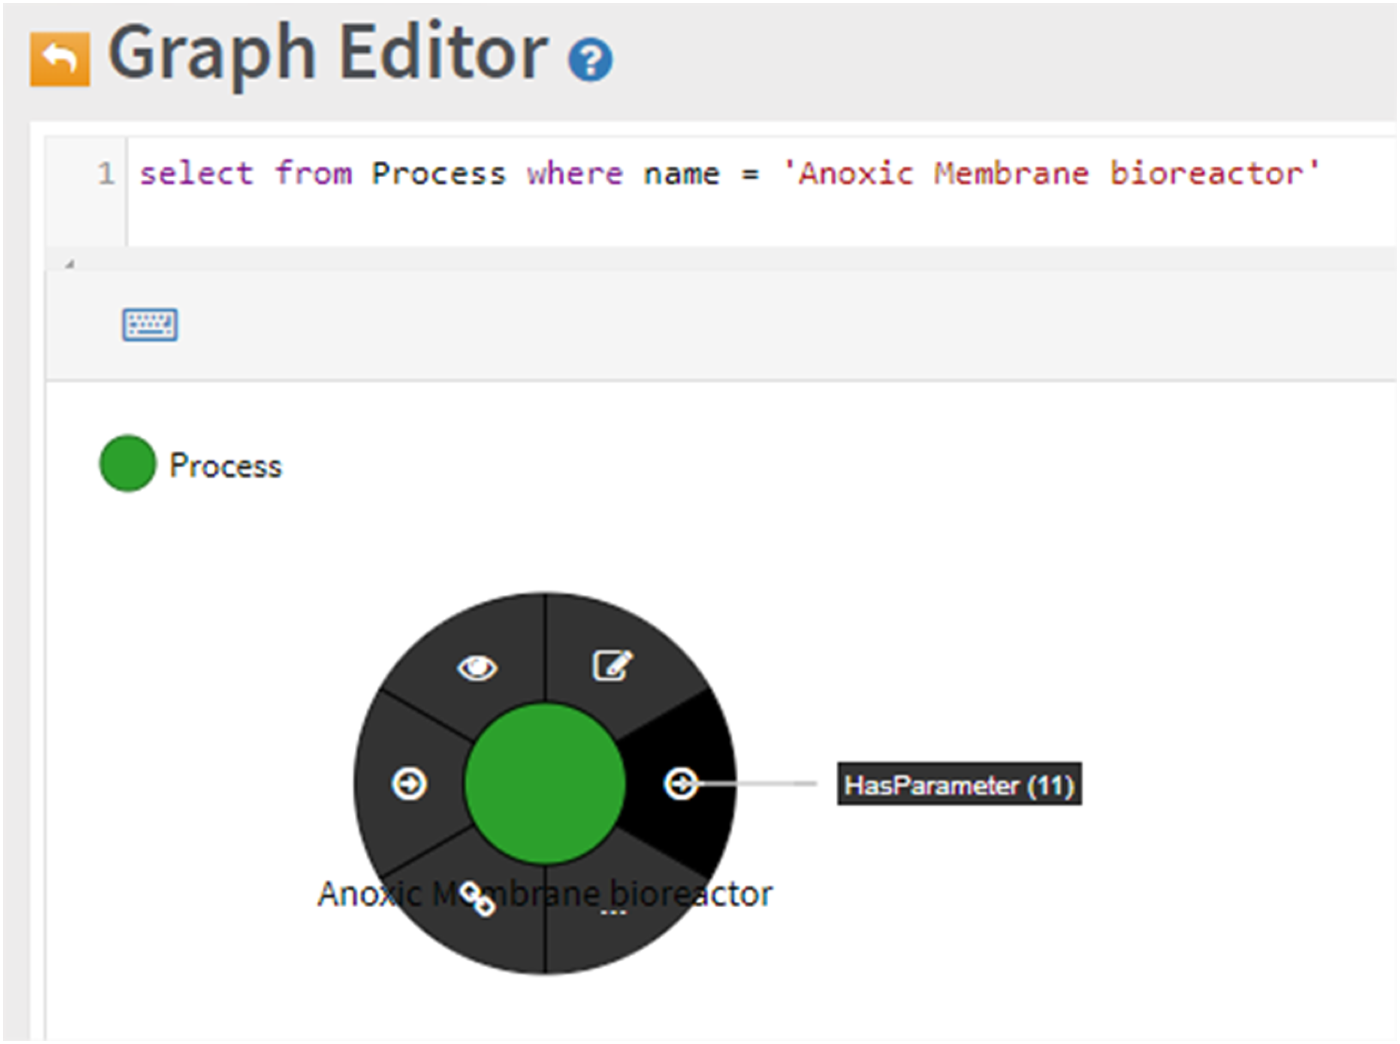
Kg filtering by name property and interactive relationship exploration.
Figure 12 shows a vertex linked to eleven other elements by the 'HasParameter' relationship. The 'HasParameter (11)' label provides automatic population of the graph editor, enabling visualization of this KG extract without requiring schema or query language knowledge. An equivalent SQL query is:
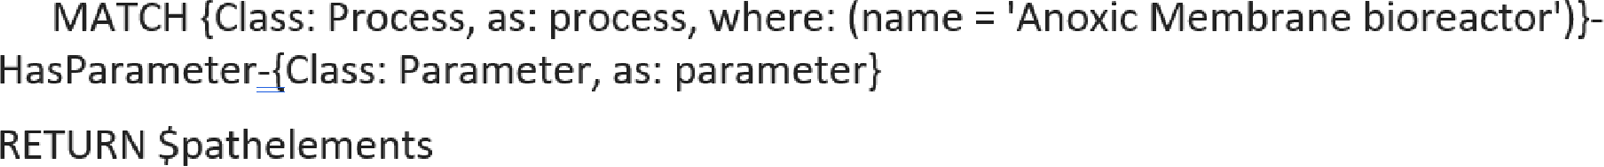
Results can be displayed either graphically or in tabular form. The next section will cover more complex queries.
What physical or chemical resources are utilized by an industrial system?
This query seeks to identify all the physical and chemical resources that are either consumed or produced by a specific industrial system. The expected result is a comprehensive list of resources, including water, chemicals (e.g., coagulants, disinfectants), energy, air, and by-products like sludge. This information is crucial for resource planning, allocation, and optimization, ensuring that the system operates efficiently and sustainably. Furthermore, understanding resource utilization can help in reducing waste, lowering operational costs, and improving environmental compliance.
Which key performance indicators are linked to a system or subprocess?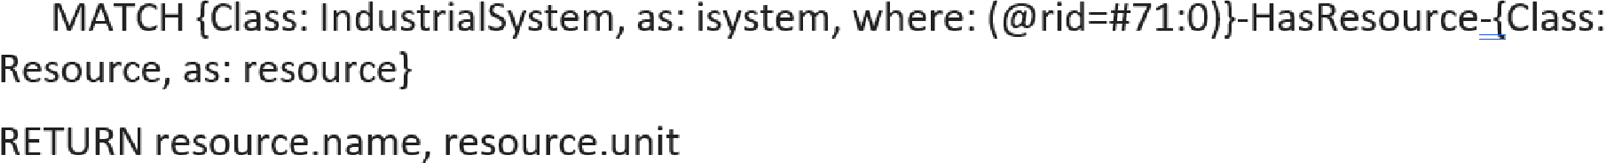
This query is designed to identify the key performance indicators (KPIs) that are relevant to a specific industrial system or subprocess. The expected outcome is a list of KPIs, such as energy efficiency, effluent quality, chemical usage efficiency, and water recovery rate, that measure the system's performance and effectiveness. These KPIs are essential for monitoring, evaluating, and improving the system's operational goals. Additionally, tracking these indicators can help in identifying areas for improvement, ensuring regulatory compliance, and achieving long-term sustainability objectives.
What predictive or simulation models can optimize a given process?
This query aims to determine the predictive or simulation models that can be utilized to optimize a specific process within the water treatment system. The expected result is a list of models, such as process simulation models, machine learning algorithms, computational fluid dynamics (CFD), and kinetic models, that provide insights into potential optimization strategies. These models can help in improving process efficiency, reducing operational costs, and enhancing system performance. Additionally, leveraging these models can support decision-making processes, enabling proactive maintenance and minimizing downtime.
Which elements are directly connected to a process?
This query focuses on identifying all the elements that have a direct relationship with a specific process within the industrial water treatment system. The expected outcome is a list of elements, including equipment (e.g., pumps, filters), data streams (e.g., sensor data), other processes (e.g., pre-treatment, secondary treatment), and resources (e.g., water, chemicals). Understanding these direct connections is essential for comprehending the immediate interactions and dependencies within the system. This information can also aid in troubleshooting, process integration, and ensuring seamless system operations.
What input nodes feed into the system, and what is their current stock/resource status?
This query seeks to identify all the input nodes associated with the industrial system and their current stock or resource status. The expected result is a detailed list of input nodes, such as raw water intake, chemical storage tanks, energy supply, and air supply, along with their current stock levels. This information is vital for inventory management, ensuring that the necessary inputs are available for the system's operations. Additionally, monitoring stock levels can help in preventing shortages, optimizing resource utilization, and maintaining continuous system performance. Real-time tracking of resource status can also support predictive analytics and improve operational planning.

Using KGs to manage knowledge of industrial water treatment processes can have several practical implications, from improving operational efficiency to enhancing decision-making capabilities. As shown in this paper, KGs offer a way to represent complex relationships and data in a more intuitive and structured form, which can help in many areas of industrial water treatment, such as process optimization, predictive maintenance, regulatory compliance, and overall resource management.
Of particular importance is the capability of KGs to integrate disparate data sources. Industrial water treatment involves data from multiple sources, such as sensors (flow, pressure, temperature), chemical dosing systems, water quality monitors, maintenance records, and historical performance data. KGs can seamlessly integrate these diverse data types into a unified framework, providing a holistic view of the entire water treatment process.
Moreover, a KG can store relationships between different process variables (e.g., pH, turbidity, chemical dosing rates) and water quality outcomes. By analysing this data, operators can identify hidden patterns, correlations, and anomalies that may lead to inefficiencies or failures, allowing for early interventions. Similarly, KGs can be used to model relationships between equipment (e.g., pumps, filters, membranes) and their performance over time. Using these relationships, operators can predict when equipment is likely to fail or require maintenance, reducing downtime and improving asset longevity. By incorporating real-time sensor data into a KG, operators can receive alerts when specific thresholds are breached (e.g., when water quality falls below acceptable standards). These alerts can be based on a combination of real-time data and predictive models, offering early warnings of potential issues.
KGs can provide a context-rich environment for decision-makers by integrating real-time data with historical trends, predictive models, and domain-specific knowledge. This can enable better-informed decisions regarding process adjustments, maintenance schedules, and resource allocation. The integration of predictive models in particular, enables decision-makers understand historical patterns, diagnose causes of events, predict future trends, and prescribe optimized actions for efficient process management. Each type of analytics contributes uniquely to the overall effectiveness of water treatment systems, enabling operators to make informed decisions based on comprehensive data analysis. Descriptive analysis examines historical data to interpret what has occurred over a specific period of time. By analysing past events, through statistical analysis and data visualizations, descriptive analytics produces reports that identify patterns, outliers, and trends, facilitating an understanding of the current status of the water treatment processes. Diagnostic analytics goes deeper by identifying the root causes of observed phenomena and trying to explain the reason behind the occurrence of an event. Methods like data correlation and pattern recognition are used in this context to reveal underlying factors affecting water treatment efficiency. Predictive analytics employs statistical models and machine learning techniques to anticipate future outcomes about what is likely to happen next 46,47. The outcomes are produced by estimating probabilities and forecasting potential changes in key water quality parameters, predicting future anomalies, or computing parameters that are difficult or expensive to measure. Prescriptive analytics focuses on recommending actions based on the predictive models’ outcomes; it often integrates optimization algorithms to suggest the most effective decisions for process adjustments, such as chemical dosing or flow rate modifications.
KGs enable the creation of a comprehensive, real-time dashboard that provides visibility into the entire water treatment process. Operators can quickly assess key performance indicators, water quality parameters, and equipment status, facilitating faster response times. Moreover, as water treatment plants are subject to a range of environmental regulations and standards (e.g., discharge limits, effluent quality, chemical usage), KGs can be used to track compliance by linking operational data with regulatory standards. They can flag instances where processes are not in compliance and provide a traceable record of actions taken.
KGs help break down silos between engineering and operations teams, and foster cross-functional collaboration. Different teams (e.g., operations, maintenance, engineering, quality control) can work with the same data structure, ensuring alignment and reducing miscommunication. Moreover, KGs can be used to develop training simulations that mimic real-world water treatment scenarios. New employees can use the graph to understand how various parameters and processes interconnect, enhancing their learning and decision-making capabilities. For less experienced staff, KGs can provide decision support by offering suggestions based on past performance data, helping them understand the impact of their actions within the broader water treatment process.
The development of KGs to manage industrial water treatment processes is still a relatively young but promising field. There are several emerging research directions that could significantly improve how KGs are leveraged for water treatment, providing both technological advancements and practical solutions for industries. One research direction is the development of techniques for fusing data from different domains (e.g., sensors, databases, reports, expert knowledge) using semantic technologies. This requires creating ontologies and data models that can capture domain-specific terms and relationships in water treatment, such as those related to chemical interactions, physical processes, and maintenance protocols. Another research direction is real-time data stream processing: Water treatment facilities generate real-time sensor data that needs to be continuously updated in the KG. Research could focus on real-time data ingestion techniques to dynamically update the graph and provide real-time insights, predictive analytics, and decision support. The ability to model not just static relationships but also dynamic events (e.g., changes in water quality, system faults, equipment failure) and their impact on the system in real-time. Developing event-driven KGs can enable quick responses and adaptive process management in industrial settings.
For operators and managers to trust and act on insights generated from KGs, it is important that recommendations and decisions are interpretable. Although KGs are inherently explainable because they can illustrate visually how results are generated, further research could focus on developing explainable AI techniques that use the KG to provide clear, understandable explanations for the recommendations made by linked predictive or prescriptive models. Moreover, advanced tools, such as intuitive graphical interfaces, decision support dashboards, and scenario modelling tools for querying and visualizing the KG, may further enhance decision making, enabling operators to interact with and explore the relationships within the KG in a meaningful way. Research can also focus on improving the scalability and performance of KG technologies to handle large-scale, real-time data in industrial applications. Given the size and complexity of industrial water treatment systems, a distributed approach to managing KGs might be required. Research could explore distributed architectures, data partitioning, and federated KGs, where multiple decentralized sources contribute to the overall graph, enabling faster and more efficient querying. With the increasing prevalence of IoT devices in water treatment plants, KGs can be integrated with IoT sensor networks to represent sensor data in a more structured form, enabling real-time analysis and predictive maintenance. Finally, research could explore how blockchain technology can be used in conjunction with KGs to ensure data provenance, security, and transparency, particularly for regulatory compliance and audit purposes in the water treatment industry.
Conclusions
This paper presents a network-based method for representing and managing industrial water treatment process knowledge. A KG was constructed by collecting, processing, and organizing industrial knowledge about physical and logical entities, their interrelations, and interactions. The KG incorporates production, operational, business, and meta-knowledge (including goals, targets, and performance criteria) as nodes. Consequently, all relevant process knowledge is either embedded within the KG structure (nodes, relations, properties) or linked to it, enabling integration of heterogeneous data from various sources and facilitating comprehensive knowledge and data queries.
Footnotes
Abbreviations
Acknowledgment
This work is partly funded by the European Union's Horizon 2020 project AquaSPICE (Grant agreement No 958396). The work presented here reflects only the authors’ view and the European Commission is not responsible for any use that may be made of the information it contains. the information it contains.
Funding
The author(s) disclosed receipt of the following financial support for the research, authorship, and/or publication of this article: The authors received funded by the European Union's Horizon 2020 project AquaSPICE (Grant agreement No. 958396).
Declaration of conflicting interests
The authors declared no potential conflicts of interest with respect to the research, authorship, and/or publication of this article.
Appendix A: Water data properties
The following table presents a listing of the water data properties employed in our work and the corresponding mapping to the sf4watr (Figure A-1) and saref (Figure A-2) data models.
Predictive Models.
| Application Area | Data source | Analytics methods | Input Variables | Predicted Output | Evaluation | Reference |
|---|---|---|---|---|---|---|
| Performance Evaluation and Quality Assessment | Historical | FS-RBFNN | COD, SS, pH, oil, NH3–N | BOD | MSE RMSE CPU time | 48 |
| Performance Evaluation and Quality Assessment | Laboratory | ANN-MLP MLR | TSS, TS, pH, Temperature | BOD, COD | r RMSE bias values | 49 |
| Performance Evaluation and Quality Assessment | Laboratory In situ | ANN SVM | month, volumetric inflow flow rate, TSS, COD, T-N, T-P, temperature, pH | T-N | R2 NSE relative efficiency criteria (drel) | 50 |
| Data Acquisition and Sensing | In situ optical monitoring Laboratory | MLR | different variables per model | SS BOD COD T-N T-P (Separate models) | RMSE R2 | 51 |
| Data Acquisition and Sensing & Performance Evaluation and Quality Assessment | In situ samples | MLR | optical monitoring variables (amount of filaments, fractal dimension, form factor, roundness, aspect ratio, equivalent diameter, mean area of objects, number of small objects) | (BOD, COD, SS, N, P) of effluent | R2 RMSE coefficients of regression | 52 |
| Performance Evaluation and Quality Assessment & Process Simulation and Optimization | Historical | SCFL ANN CFL TSFL MFL LFL | (BOD, COD, TSS, Temperature, pH) of influent | (BOD, COD, TSS) of effluent | MAPE RMSE R2 | 53 |
| Process monitoring and Anomaly Detection | UV/Vis spectrophotometer | Data depth theory PCA | France: spectral data and for each sample: TSS, total, dissolved CODSwitzerland: spectral data, ammonium, nitrite and nitrate concentrations | Outliers in repetitive spectra | Confusion matrix Consistency ratio | 54 |
| Process monitoring and Anomaly Detection | online UV-Vis spectrophotometer | visual exploration k-means correlation analysis | spectral data logs | Abnormal inlet water quality | Correlation coefficients against logs | 35 |
| Performance Evaluation and Quality Assessment | Laboratory In situ external sources | RDA ANOVA Duncan test | electrical conductivity, salinity, chlorides, flow rate, energy, data on rainfall, COD, BOD, energy efficiency, TSS, TKN, NH+4, NO-3, TP, removal efficiency, faecal coliforms, faecal streptococci, detection of Salmonella and Vibrio cholera, Pb, Cu, Ni, Zn, Cr, Cd, electrolysis | n/a | n/a | 37 |
| Process Simulation and Optimization | Historical sensor data Simulation Three-step interpolation algorithm | Transition probability matrix Multivariate Adaptive Regression Splines (MARS) Constrained Markov decision process (CDMP) | state variables: {influent flow rate, feedback, effluent total nitrogen concentration, effluent total phosphorus concentration, period, total cost} | action variables: {DO set point, waste-activated sludge pump rate, Internal recycle pump rate} | Comparison of policies after 2 years of pilot | 43 |
| Performance Evaluation and Quality Assessment | Historical data from different stages of WWTP | ANN-MLP | Flow, COD influent, SS, MLSS, MLVSS, N, pH, DO, F/M | COD | MAPE MSE | 55 |
| Process Simulation and Optimization | Historical data from different stages of WWTP | i. LSTM ii. Decision Tree iii. GA | i. {BT_C_MLVSS, D_SS, EQ_N, Clari_DO} more than once on different days ii. {EQ_N OxT_PH_PM} more than once on different days iii. pH setpoints | i. EQ_COD ii. EQ N iii. best pH | MAPE Mean & standard deviation T-student & F-Fisher test Box & whisker plot comparison | 44 |
| Process Simulation and Optimization & Performance Evaluation and Quality Assessment | online wastewater analyzer TSS StM.2540-D | ANN M5 model tree | temperature, turbidity, pH, EC, TDS, TSS, DO, BOD5, COD of the inlet | BOD5, COD, TSS of output | R2 R2adjusted RMSE Standard error of the estimate | 38 |
| Process Monitoring and Anomaly Detection | BSM 1 simulation | SANN DANN KPCA ARMA | process data | SPE | SPE Type-I error Type-II error | 34 |
| Process Simulation and Optimization | process simulation: BSM2G influent generation: BSM-UWS | LCA models Influent Generation model Biochemical process models | influent generator BSM-UWS model (scenarios) | Environmental impacts of future processes | 35 | |
| Data Acquisition and Sensing | BSM 1 simulation | VBPCA RVM | {COD, NH4+, NH3 nitrogen, Nitrate and nitrite nitrogen, BOD, Flowrate, Oxygen} {BOD, COD, pH, Suspended solids, Sedimentable solids} | BOD, COD | r RMSE LS-SVM PLS | 12 |
| Data Acquisition and Sensing | direct sampling flux chamber sampling | PLS regression PCA | e-nose and olfactometry outputs | odour concentration | RMSE R2 | 56 |
| Data Acquisition and Sensing | pre-existing datasets: i. Debutanizer column ii. Sulfur Recovery Unit | SAE LSTM | i. {top temperature, top pressure, reflux flow, flow to next process, sixth tray temperature, bottom temperature A, bottom temperature B} ii. {gas flow, air flow, secondary air flow, gas flow in SWS zone, air flow in SWS zone} | i. Butane C4 content in IC5 ii. Concentration of SO2in the tail gas | R2 RMSE Comparison | 57 |