
Abstract
The main objective of this article is to question the hypothesis of the role of transport infrastructures in regional economic growth by comparing Central Eastern Europe (supported by the EU structural and cohesion funds) and the Greater Mekong Subregion (mainly supported by the “economic corridors” of the ADB). Three main components of trade efficiency are scrutinized and compared: (1) the historical development of trade agreements, (2) the supra-national (regional) capacity of trade regulation, and (3) the micro level of governance between the different actors involved in trade. The comparison between CEE and the GMS is all the more warranted because of two paradoxes that need to be explained: The first one results from the existing link between transport and growth in the case of the GMS, and the lack of a link in the case of CEE. The second paradox insists on the fact that despite their very different institutional frameworks, both subregions continue to face similar challenges concerning the implementation of trade agreements and the exchange of facilities at the local level – pointing towards the issue of governance.
Introduction
The European Union (EU) and Southeast Asia (SEA) are two distinctive, dynamic regions whose respective powers are collectively expanding in the international arena. Both regions are distinctly different in terms of culture, values, development levels and economic and political systems. However, they share one common important feature that renders a Europe-Southeast Asia comparison a fascinating subject for research: both regions are engaged in the processes of economic and political integration (albeit at different stages and in different ways). 1 While the EU continues to consolidate its enlargement and seek greater political integration, SEA continues on its own trajectory in its regional integration efforts. The question frequently raised, however, is if the European model of integration has created a paradigm that the SEA region can follow, especially given the current economic crisis in which both regions are facing similar challenges – such as migration, cohesion and sustainable growth.
Regional economic integration is defined here as the formation of closer economic linkages between countries that are in close geographical proximity to each other. Political integration refers to “sovereignty pooling” as exemplified by the EU (and not by the Association of Southeast Asian Nations (ASEAN)).
Rather than extending our analysis to the entire EU and to the whole of SEA, the focus is on two subregions: Central Eastern Europe (CEE) on the one hand and the Greater Mekong Subregion (GMS) on the other. 2 There are several reasons for carrying out this comparison. First, all of the states involved are among the poorest in their respective regions and have launched national plans to “catch up”. Within these plans, infrastructure projects are the most important elements. Second, most of these countries were previously centrally-planned economies (“Soviet-type economies”) and face similar difficulties with their governance structure, as well as decentralization issues. Importantly, although most CEE economies are said to have completed their transition towards being market economies, state-building is still in progress in many of the GMS economies, and also the civil societies are in flux. Finally, the economies in both subregions have undergone, and are still undergoing, extensive processes of economic integration (in the case of the EU, there has also been extensive political integration). As cited in Murray (2008: 6), a comparative analysis, such as this one, can reveal the dynamics underpinning the regional integrative processes and thus help us to “understand and rethink the incentives for, and constraints on” stronger regional integration.
The GMS economies are comprised of Cambodia, Lao People's Democratic Republic (Lao PDR), Myanmar, Thailand, Vietnam, the Yunnan Province and the Guangxi Zhuang Autonomous Region in the People's Republic of China (PRC).
The role of transport infrastructure is of considerable importance for economic integration in both regions. In SEA, the Asian Development Bank (ADB) is financing investment in an extensive network of motorways. These are referred to as “the economic corridors”, to indicate the expected economic impact that this transport infrastructure will have on regional development. In the EU, there are two policy tools that encompass physical infrastructure development: the Cohesion Fund, which shapes the EU's spatial planning by supporting some transnational infrastructure projects (on the environment and transport), and the Structural Funds where a large proportion of the fund is ear-marked for developing transport infrastructure. As such, there are at least three important questions that need to be addressed on the assumed impact of transport infrastructure on regional development. First, since transport infrastructure is supposed to foster growth by lowering transaction costs and facilitating trade activities, what are the main institutions that support this objective? Second, since transport infrastructure increases access to public goods for the most underdeveloped regions and populations, what is the link between this development goal and the genuine impact for some landlocked regions or countries? Finally, since transport infrastructure creates different networks by connecting different groups of activities, which groups of actors are involved? The economic advantages associated with transport infrastructure supposedly have a considerable political impact by reducing regional disparities, particularly between urban and rural areas, and by facilitating access to public goods and by creating shared activities for unequally endowed populations. Economic convergence is therefore considered to be conducive to political stability.
The main objective of this article is, therefore, to further explore the role of transport infrastructure in regional economic growth. By pointing out the definite importance of infrastructure, and by questioning the links between transport infrastructure and regional development, we intend to identify three main components of trade efficiency: (1) the historical development of trade agreements, (2) the supranational (regional) capacity of trade regulation and (3) the micro level of governance between the different actors involved in trade. The comparison between CEE and the GMS is all the more warranted because of two apparent paradoxes that need to be explained. The first one results from the existing link between transport and growth in the case of the GMS, and the lack of such a link in the CEE case. The second paradox arises from the fact that, despite their very different institutional frameworks, both subregions continue to face similar challenges concerning the implementation of trade agreements and the exchange of facilities at the local level – pointing towards the significance of the issue of governance.
The following section first presents the common assumptions held about the links between transport infrastructure and economic development. Section 2 explains the main ideology behind the regional integration and cooperation programs in the GMS and CEE, and their respective transport infrastructure programs. Subsequently, in Section 3, we turn to look at the differences in transport network developments and trade and economic growth in the GMS and CEE. Following on, we then attempt to provide some useful explanations for the variation in experiences, and review the role of transport infrastructure in regional development, which is the focus of Section 4. Finally, we conclude, in Section 5, by pointing out the fundamental challenges that are faced by both regions in their regional development efforts. 3
This article stems from a larger study that was conducted by a group of Master of Public Affairs (MPA) students at Sciences Po Paris, with the aim of contributing to the debate by exploring the experiences of European and SEA's regionalism – in particular, in the contexts of the GMS and CEE. To support this research, two study trips were made to Thailand and Poland in February and April 2009 respectively. See Assawamanakul et al. 2009.
“Transport is above everything an access agenda, aimed at unlocking growth and development potential in an inclusive way” (World Bank 2008). Transport infrastructure has the overriding feature of providing connectivity. However, under certain circumstances, this presumption can be incorrect.
The Positive Link
Quoting a joint study conducted by the ADB, the Japan International Cooperation Agency (JICA) and the World Bank, transport infrastructure is said to be intertwined with the fabric of our economic and social lives, connecting us to one another, and hence, if appropriately invested, fosters inclusive development. Essentially, it can be considered as an input to raise the efficiency of factors of production – it connects goods to markets, workers to industry, people to services and the poor in rural areas to urban growth centres. In other words, it lowers costs, enlarges markets and facilitates trade. Through such a process, transport infrastructure meshes growth and poverty reduction into a series of mutually reinforcing relationships. It supports the process of growth, which poverty reduction depends upon, and this enables providers to expand affordable basic services to the poor that can improve their lives and income opportunities, which, in turn, can facilitate greater access to services that encourage more growth (Asian Development Bank, Japan Bank for International Cooperation, The World Bank 2005). The study surveyed an extensive amount of literature on the impact of infrastructure on growth and productivity, stressing that the relationship between any set of infrastructure undertakings (transport, electricity, water supply etc.) and poverty is context specific – what works in one country may not be as effective in another, and that infrastructure is effective only when combined with other policy interventions.
Importantly, transport infrastructure sustains the distribution of the benefits of growth, by facilitating trade and fostering regional integration (Asian Development Bank, Japan Bank for International Cooperation, The World Bank 2005). Studies have consistently shown that trade openness is an important driver of growth as a result of its positive impact on productivity (Hallaert 2006), and, to this end, transport infrastructure plays a key role in facilitating trade efficiency. A well-developed transport infrastructure and efficient freight services can reduce delays in transit times, make traded goods more affordable, increase consumer choice and help developing countries to integrate into longer, more complex and more demanding supply/ production chains. Coupled with the reduction in regional and international transport costs for traded goods, whose price is set by international supply and demand, it can increase producers’ disposable income and promote economic growth (World Bank 2008).
Among other things, trade is highly dependent on an efficient transport and logistics system that is composed of shippers, traders and consignees. These are the main users of the system, who use it to move their goods around effectively and efficiently, both as inputs and outputs of their business. Also using this system are service providers – such as, among many others, shipping companies, coastal and barging operators, stevedores, airlines, air freight companies, road haulage companies, train operating companies, international freight forwarders and third-party logistics providers. They, in turn, depend on the transport infrastructure: waterways, ports, airports, air and maritime navigation systems, roads, railways and various kinds of intermodal transfer, storage and terminal facilities. The costs of freight transport depend not only upon the quality and capacity of the infrastructure that service providers use, but also upon the institutional framework within which they operate. These include such factors as the rules and regulations concerning imports and exports, financial regulations, registration and licensing of service providers, customs procedures and border crossing procedures (Banomyong, Cook, and Kent 2008). In other words, transport expenses also include many indirect costs that can include: slow, irregular and unreliable transit (which increases inventory costs); excessive handling and storage costs due to poor terminal infrastructure; losses due to theft, deterioration and damage to goods (or excessive insurance premiums to cover these risks); and sometimes also bribes paid to officials.
High transport costs can magnify the impact of distance and reduce trading opportunities (World Bank 2008) and thus affect growth. For instance, Hummels (2001) finds that for the shipments of manufactured goods to the United States by ocean, each day saved in transit time is worth 0.8 per cent of the value of the goods. Likewise, Djankov, Freund, and Cong (2006) estimate that, on average, trade is reduced by 1 per cent for each additional day a product is delayed prior to being shipped. Further, as cited in the World Development Report 2009, trade in intermediate goods, which now constitutes more than half of global trade (up by a quarter since 1962), is especially sensitive to transport costs; if the share of imported intermediate inputs in final demand is large, small changes in transport costs can have large effects on the volume of trade flows, increasing “trade friction”. It is estimated that a 5 per cent increase in transport costs can produce the equivalent to an ad valorem tax of nearly 50 per cent, when the share of intermediate inputs in value added is 70 per cent.
The Missing Link
Despite the above claims, several studies have also shown that the link between transport infrastructure and growth is not obvious (Hill 2007; see Weiss 2007). The general assumption is that, as long as the rules of the game are respected, increased infrastructure leads to greater development. In other words, more developed infrastructure brings about greater development. The general postulate is also that decreasing transport costs leads to improved trade facilitation, better access to public goods and the increased mobility of the different factors of production. How can the contradictions be explained? Under which conditions will the interplay between infrastructure and development go wrong? Is it a problem of actors? Of natural endowments? Can it be referred to as market failure? Or that of governance? Is it something to do with wrong rules and bad institutions?
One can generally agree that access to exchange (i.e. roads, trains and seaports) leads to development, which suggests that the connection to infrastructure is a positive one. Nonetheless, certain unexpected historical events have hinted at the inadequacy of such a hypothesis. During these events, development is an unexpected outcome of some other political decisions and not planned as an objective. For instance, during the colonial era Singapore, originally a small fishing village, was established as a poor, underdeveloped settlement by Sir Thomas Stamford Raffles in 1819 to overcome the Dutch prohibition of British ships (see SarDesai 1994: 85). In the 1980s, China developed its poorest regions: the sea coasts. In the 1970s, The growth of these cities were rooted in their excellent geographical locations more than the transport infrastructure (usually poor) that they were originally endowed with. In a seminal work, Hirschmann has spoken of the “hidden hand” (Hirschmann 1967) to indicate the unexpected effects of the decision-making process, Decision-makers, in the past, often did not deliberately plan to build transport infrastructures in order to achieve development; in these cases as those cited above, development was an unexpected outcome and transport infrastructure were created to foster the occurred development process, and can succeed or fail (or determine the speed of development) depending on many factors.
In Central and Eastern Europe, there are similar examples of this type. The most famous is the city of Nowa Huta (The New Steel Factory) in Poland, built in the 1950's to compete with the closed and old city of Krakow. Eisenhüttenstadt (The City of Steel) in Eastern Germany has been developed in competition without considering the cost of coal transport from Poland; Dujnavaros in Hungary has responded to the same political challenges, far from the economic rationality which claims to reduce the costs of distance. In all these cases, the decision-making processes have been driven by political objectives aimed at developing heavy industry (coal mining, steel and energy), rather than by economic objectives. Other factors, such as corruption, interest groups and rent-seeking behaviour, also reflect the intricate and unclear relationship between infrastructure and development. Moreover, the inefficient governance that is bred by the mistrust between the players, or the lack of coherence between different investments, increases transaction costs and can lead to inappropriate investments as well as impede development. We will examine below other factors that challenge the notion of an inherently positive causal effect between transport infrastructure and development, by highlighting the negative effects of “bad” governance, of the disconnection between administrative levels (central and local ones) and of the difficulty of determining the limits between decentralization and economic growth.
Regional Integration and Cooperation Programs in the GMS and CEE
In the GMS, regional integration is largely driven by the ASEAN, but also by the ADB, which has made significant loans to the GMS economies for their development projects and programs. Regional integration takes the form of economic cooperation among the developing member countries of the ADB. The GMS program was established in 1992 with the key support of the ADB and other donors, whose ambition was to promote sustainable economic development through closer economic linkages among its member states. More specifically, the regional cooperation program takes the form of “economic corridor” 4 developments, which are designed to attract investment and generate economic activities along a central transport artery and the border regions. The aim of this is to foster development by lowering distribution costs and improving the land supply for economic activities. In order to achieve these aims, both the physical transport links and the logistics facilitation must be in place and functioning in the corridors (Stone and Strutt 2009). As of December 2007, 26 out of 37 investment projects assisted by the ADB were in the transport sector. Transport projects made up 81.3 per cent of the total project cost and were worth 8.3 billion USD. Three major GMS economic corridors have been developed along transport routes – the east-west, the north-south and the southern economic corridors. These are expected to be completed by 2012, and will link infrastructure with production and trade, facilitating trade and economic exchanges among the GMS countries by significantly reducing transportation costs, and by improving accessibility to enable greater interaction among the peoples of the GMS.
Economic corridors are the last generation of the various forms of regional development. They initially started with the growth poles in the Chinese coast at the end of the 1970s, then developed with the growth triangle between Singapore-Johor and Riau (SIJORO). This “success story” has been extended in the 1990s to the BIMP-EAGA (Malaysia and Philippines) and IMTGT (Indonesia, Malaysia) (Thambipillai 1991, 1998; Parsonage 2003). The economic corridors are a mix of formal (because they are signed by the heads of state) and informal mechanisms (they tend to involve the local actors) for regional cooperation. They have been developed as an alternative to the establishment of formal trading blocs, which are extremely complex and which proceed at a slow pace. The underlying rationale is that regional economic cooperation can be quickened by including only smaller areas of countries, and adopting a pragmatic, “bottom-up”, market-oriented approach. Economic corridors usually span a central transport artery, such as a road, rail line or canal, and place a greater emphasis on bilateral initiatives than on multilateral ones. Regional cooperation can most quickly take place at strategic nodes within the corridor, particularly at the border crossings between two countries. Most importantly, economic corridors pay careful attention to the spatial and physical planning of the corridor and its periphery, concentrating on infrastructure development in order to maximize positive benefits. In contrast, formal trade bloc mechanisms are based on the adoption of common rules, using a “top-down”, bureaucratically imposed framework (Economic Corridor Concept n.d.).
In the EU, regional development programs are administered through the Lisbon Strategy, which is the EU's most general framework of development 5 , as well as the EU's Cohesion Policy, which targets economic, social and territorial development by prioritizing growth, employment and territorial balance simultaneously. 6 “Regions”, as defined by the EU, are administrative units at a lower level than the nation-state classified by the respective member countries 7 , and is endowed with power to perform certain government functions (DEXIA 2009). Different types of regions can coexist in the EU: some member states have more decentralized entities (e.g. Spain and Poland) and some others frame regions only as administrative units. 8 The Structural and Cohesion Funds are the key instruments of the EU's regional policy, targeted at promoting economic, social and, more recently, territorial cohesion (i.e. convergence for the most backward regions in the EU 9 ) among regions in the member states. Since 2007, the Structural Funds can be primarily divided into two: the European Regional Development Fund (ERDF 10 ), and the European Social Fund (ESF). 11 On the other hand, the Cohesion Fund targets the spatial planning of the EU territories by organizing massive EU-wide environment and transport infrastructures: the TEN (Trans-European Networks), which are negotiated between the EU Commission and the member states.
The Lisbon Strategy rests on three key pillars: (1) an economic pillar preparing the ground for the transition to a competitive, dynamic, knowledge-based economy. Emphasis is placed on the need to adapt constantly to changes in the information society and to boost research and development, (2) a social pillar designed to modernize the European social model by investing in human resources and combating social exclusion. The member states are expected to invest in education and training, and to conduct an active policy for employment creation, making it easier to move to a knowledge economy. Finally, (3) an environmental pillar draws attention to the fact that economic growth must be coupled with the sustainable use of natural resources.
In 2008, the EU's budget for driving “Sustainable Growth”, supported by the Lisbon Strategy and the Cohesion Policy, stood at 58 per cent of the EU's total budget – and thus constituted the largest share of it (Funds supporting the Convergence objectives, 37 per cent; the Common Agricultural Policy, 40.9 per cent). Source: http://ec.europa.eu/budget/library/publications/budget_in_fig/dep_eu_budg_2008_en.pdf (6 December 2009).
Regional statistics are based on a common classification of territorial units for statistics (NUTS), which has three regional levels – each with minimum and maximum thresholds for the average population size of the regions. NUTS is based largely on the institutional divisions in each member state.
The presence of numerous minorities on their soil, and their concentration in certain territories, have led some of the new EU members to avoid passing a law concerning decentralization, as it might lead to severe tensions between the central sovereign state and the regions. This is the case with the Baltic (northern) States that host key Russian minorities, with Romania which has a very large and economically strong Hungarian minority and with Bulgaria which has a strong Turkish population. See Bafoil 2009: Chapter 7.
A “backward region” is a region which has a GDP per inhabitant of less than 75 per cent of the EU average, and which therefore can benefit from the Structural Funds.
The ERDF represents around 80 per cent of the budget of the Regional Policy, the ESF 15 per cent, while the remaining amount is dedicated to cross-border cooperation.
Before 2007, other funds existed that were dedicated to rural development and to fishery. Four “community initiatives” also existed that targeted poor urban areas (URBAN), less developed rural areas (Leader +), some gender issues (EQUAL) and cross border cooperation (INTERREG). They are now integrated into the existing funds.
During the 2000–2006 program period 12 , 19.2 per cent (nearly 25 billion EUR) of the EU Structural Fund, and 48.8 per cent (more than 16 billion EUR) of the Cohesion Fund, was spent on transport infrastructure alone. It is estimated that during this period, the ten CEE member states (8+2) 13 invested more than 28 billion EUR in transport infrastructure. 14 In the new program period of 2007–2013, the budget for the Structural and Cohesion Funds has been increased more than two-fold to 348 billion EUR (35 per cent of the total EU budget), and in many of the CEE member states, investment in transport infrastructure has been given the highest priority. The EU has always believed that a modern, high-quality transport infrastructure forms the necessary backbone for the mobility of goods and passengers and is thus essential for both regional economic development, the creation of the single European market and for promoting economic and social cohesion within the EU. It also recognizes that transport infrastructure developments are often planned at the national level and focused on improving intra-national accessibility. As a result, cross-border linkages remains underdeveloped, The Trans-European Transport Networks (TEN-T) is therefore conceived to provide the EU with a policy instrument to coordinate the development of a multi-modal transport network across Europe.
A program period covers seven years.
In 2004, ten candidates joined the EU, of which eight are Central Eastern European countries – the Czech Republic, Estonia, Hungary, Latvia, Lithuania, Poland, Slovakia and Slovenia. In 2007, a further two Central Eastern European countries, Bulgaria and Romania, were accepted as members of the EU.
Refer to Table 1 for details of transport infrastructure spending by the CEE member states.
Transport Investment by CEE Member States (million EUR), 2000-2006
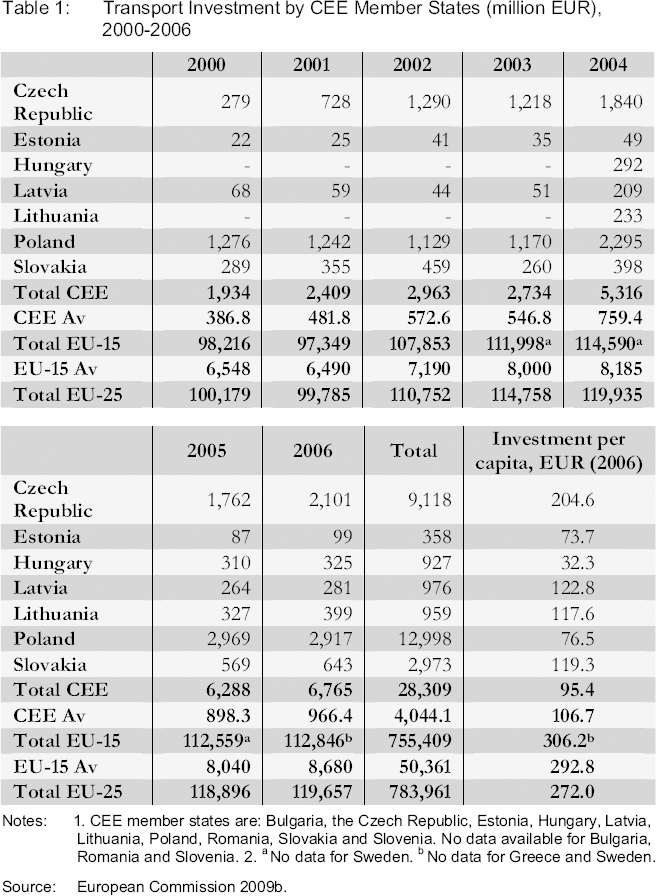
Notes: 1. CEE member states are: Bulgaria, the Czech Republic, Estonia, Hungary, Latvia, Lithuania, Poland, Romania, Slovakia and Slovenia. No data available for Bulgaria, Romania and Slovenia. 2.
No data for Sweden.
No data for Greece and Sweden.
Source: European Commission 2009b.
What conclusions can we draw from the comparison between the GMS and the EU's regional policy? Three main features can be identified that distinguish the two regions.
First, while there is no supranational policy in the GMS case, the EU regional policy (supported by the Structural and Cohesion Funds) is a very complex one. It is rooted in the EU founding principle of “subsidiarity” 15 that has allowed multi-level governance to prevail, delegating development planning responsibilities to the regional and local authorities, and policy decisions to be taken as close to the citizens as possible. Also influential has been the principle of solidarity, whereby member states pledged to share both the advantages (i.e. increased prosperity) and the burdens of regional integration equally and in a fair way.
The concept of subsidiarity defines the responsibility in the decision-making process in accordance with each separate level: EU, state, sub-national (regional) and local authorities. Each of these levels takes charge of some policies, to the exception of all other levels. Such a division establishes simultaneously the autonomy and the interdependence of all the levels, and defines the nature of governance (Bafoil, cited in Assawanmanakul et al. 2009).
Second lies in their governance. The key to success in regional cooperation for the GMS can be seen as the successful negotiation between the states and the ADB on one side, and between the state and the regional actors on the other. The Cross-Border Transport Agreement (CBTA) is the main initiative for facilitating trade and economic exchange in the GMS. We observe that trust and confidence in the fellow member state(s) is extremely important and is supported by strong vertical governance. On the contrary, governance in the EU takes on a more complex architecture. Plans for regional development are carefully and continuously negotiated among vertical players (from the EU level, to the lowest one – the commune) and also horizontal ones (public, private and non-public actors). This is referred to as the “multilevel governance” that describes how supranational, national, regional, and local governments and non-state actors work together under territorially overarching policy frameworks; the “community method”. For some scholars, it represents the key advantage of the EU in this area (Mairate 2007; Sabel and Zeitlin 2008; Barca 2009).
Third, in contrast to the highly vertical and hierarchical organization within the GMS, the EU focuses instead on decentralization. Does it mean that the latter case functions better than the former? In other words, is development more linked to decentralization than to centralization? Does it mean that the decision-making process is more formal in the GMS case, and more informal in the EU one? Even though the complexities of development often require decentralization, no strict causal link has been established.
To sum up, successful regional development is about establishing the appropriate forms of governance that will function in a place (of a specific market structure and institutional framework).
To begin with, regional development in the GMS and CEE is based on different principles, takes on different forms, is progressing at different levels, while in both instances it has a similar objective of economic development; albeit, the EU has the more far-reaching mandate of narrowing development disparities among regions and its member states.
Transport Networks in the Both Regions
Both regions have invested extensively in developing their transport networks in the past decade; the GMS program invested approximately 38USD per capita in transport infrastructure from 1992 to 2007, and the EU Structural and Cohesion Funds invested approximately 85 EUR per capita during 2000–2006. Moreover, the governments of the CEE member states have invested a significant amount, totalling about 28.3 billion EUR, in transport infrastructure in the same period (Table 1). However, the investment in transport infrastructure in the CEE member states has been significantly lower than that of the EU-15, where the CEE member states invested on average only 8 per cent of the total investment made by the EU-15 during the period from 2000 to 2006. The investment per capita figures in 2006 range from 32.30 EUR in Hungary to 204.60 EUR in the Czech Republic, implying that development priorities differ even among the CEE member states. What requires explaining is the fact that Poland, as the largest and most populous new member state (38 million inhabitants), undertook the third lowest investment per capita.
Despite the difference in the investment amounts, transport infrastructure development in the two regions has been comparable, with the expansion of road networks and more paved roads for most countries, with the exception of the reduction in rail lines in the CEE member states (Table 2).
Infrastructure Indicators for the GMS and the CEE Member States
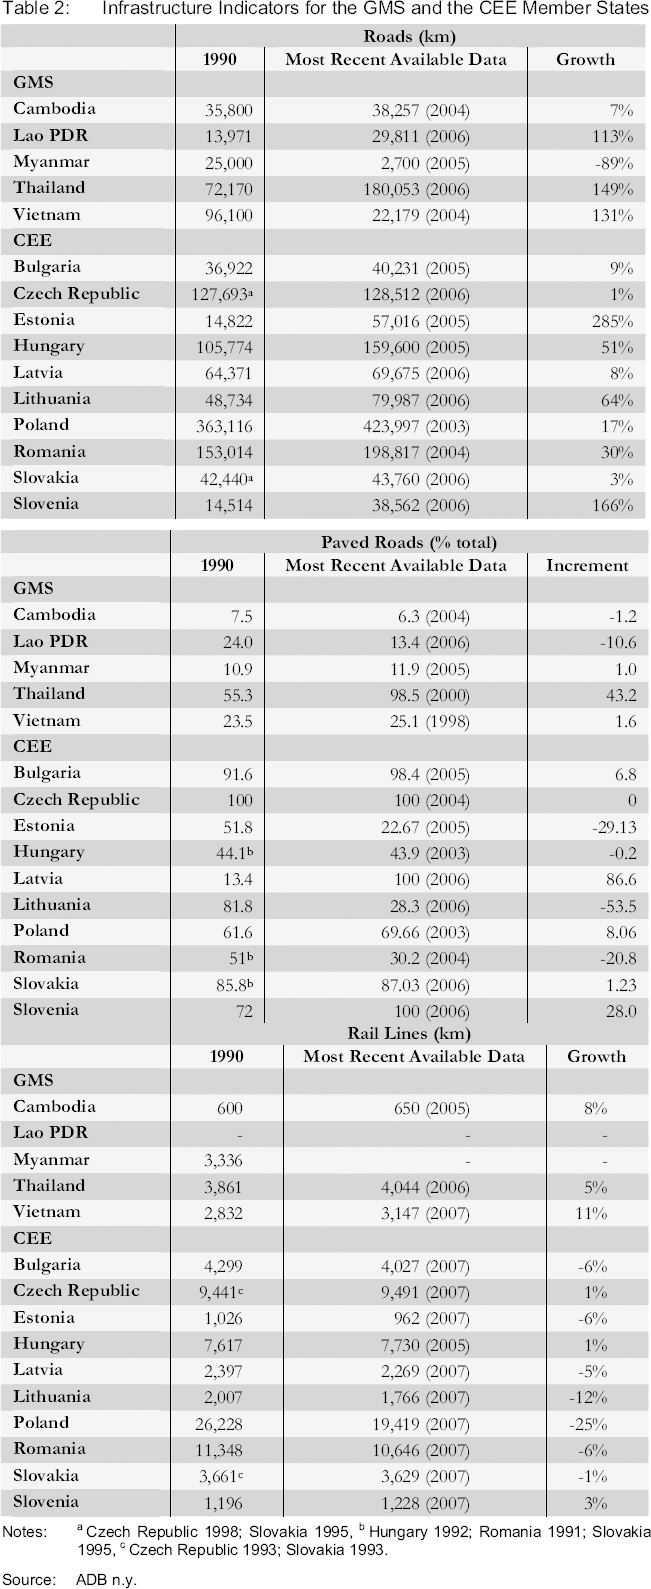
Infrastructure Indicators for the GMS and the CEE Member States
Notes:
Czech Republic 1998; Slovakia 1995
Hungary 1992; Romania 1991; Slovakia 1995
Czech Republic 1993; Slovakia 1993.
Source: ADB n.y.
Particularly, the expansion is generally larger in the GMS countries (excluding Cambodia and Myanmar) than in the CEE countries (with the exception of Estonia and Slovenia). Among the CEE member states, it can also be observed that while countries like Estonia, Hungary and Poland have lower investment per capita, their road network expansion has been greater than some member states that made higher investment per capita, such as the Czech Republic and Slovakia. This may suggest that the cost of investment in transport infrastructure has been higher in the CEE member states than in the GMS economies. Additionally, it might indicate that the nature of investment is more sophisticated in certain CEE member states, through their investment in higher technology and better quality transport infrastructure. Alternatively, it might simply reflect certain inefficiencies in transport infrastructure investment management.
Obviously, most of the CEE countries had a better start with considerably higher road and rail density by 1990 (Table 3). The CEE countries were belonging to centralized states: Poland, Hungary and Czechoslovakia were part of highly developed empires in the nineteenth century, and did not originate from the planned economy era, in which the road and rail networks were poorly developed. More precisely, it was the western regions of these central states that were more developed in the nineteenth century as compared to the eastern regions, which belonged to the Russian Empire. Similarly, Romania and Bulgaria were, since the fifteenth century, part of the Ottoman Empire, which never developed transport infrastructure (Bafoil 2009). Most of the GMS economies remain centrally planned today and only started catching up in development during the last two decades, and therein reaching the phase of providing the most basic access to infrastructure and services, and fostering regional trade. Nonetheless, studies on the GMS have repeatedly confirmed the substantial impact that these initial massive transport infrastructure investments had on trade, foreign direct investment (FDI), economic growth and poverty reduction (Menon and Warr 2006; Edmonds and Fujimura 2006; Stone and Strutt 2009). 16
Road and Rail Density
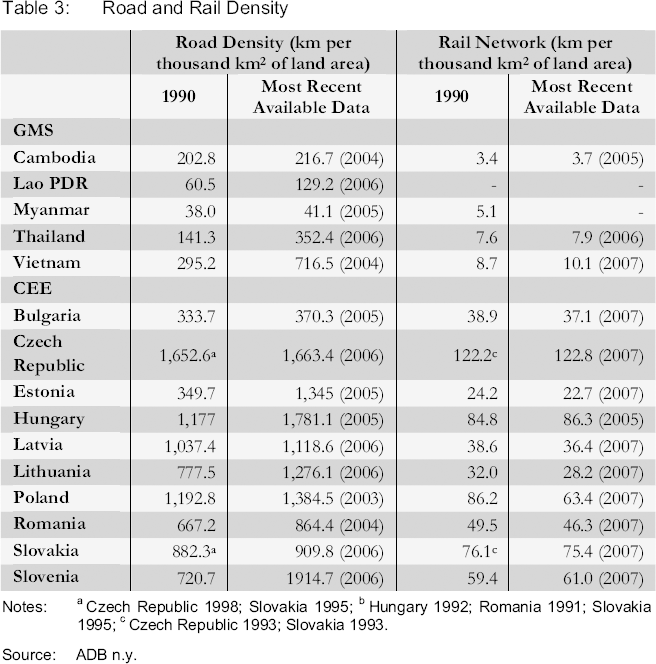
Notes:
Czech Republic 1998; Slovakia 1995
Hungary 1992; Romania 1991; Slovakia 1995
Czech Republic 1993; Slovakia 1993.
Source: ADB n.y.
For instance, it has been identified that a doubling of the density of roads in border provinces or regions (on both the exporter and importer sides of the borders) would be expected to induce an average increase in the trade of major exports by over 40 per cent across the GMS countries (Edmonds and Fujimura 2006). Further, according to Edmonds and Fujimura (2006), and also the United Nations Economic and Social Commission for Asia and the Pacific (UNESCAP), reduced trade costs can indirectly induce FDI by allowing firms that participate in intra-firm vertical integration across borders to exploit the comparative advantages of each location, facilitating efficiency-seeking industrial restructuring, and reinforcing intra-regional trade. They find evidence of a positive trade-FDI nexus in which FDI contributes to export growth from the FDI-recipient economies in the GMS. It is commonly expected that the virtuous cycle of cross-border infrastructure development, trade and FDI would foster higher economic growth, and lead to eventual poverty reduction if necessary institutions and policies are in place and functioning. They also argue that the increased in trade and growth will expand fiscal resources available to governments, thereby enabling them to consider new policy options such as investments in education, health or social protection systems, and overall creating a virtuous cycle for regional economic development (Edmonds and Fujimura 2006). See also UNESCAP 2007.
While the EU has always recognized the importance of an efficient modern transport network to support the establishment of the single market, the impact of these investments is often unclear or left unmeasured. In a very important report, widely inspired by some previous Organisation for Economic Co-operation and Development (OECD) studies, Frederico Barca, an adviser at the DG Regio, has revealed the huge absence of studies that assess the links between infrastructures projects and local development. Therefore, he has called for a “place-based approach” which could efficiently link the central projects of development (state planning) and the knowledge of place-based actors at the local level (Barca 2009). As it appears, the rationalities for these investments are driven by past experience in development, theoretical expectations, or ideological preconceptions on the role of transport infrastructure that were transfused by the founders of the European Union. With the first enlargement of the EU, motorways important for the mobility of freight were built to improve the integration of the Mediterranean ‘cohesion countries’, and the same process is taking place with the new EU member states (i.e. the CEE countries). However, there remains a large gap in motorway provision between central (advanced, industrialized countries) and peripheral countries. About 1,000 km of motorway were built per year in the member states in the 1990s, while the corresponding figure for the CEE countries was 100 km (ESPON 2004).
By 2006, almost all of the CEE member states (with the exception of Slovenia) had registered comparatively lower motorway density than their counterparts in the EU with Romania and Poland having less than 2 km/1,000 km2s. Many studies emphasize the impact of poor governance and the lack of cross-ministerial structures. They denounce the burden of the former transport designs, which had been elaborated under the previous Communist regime and which were orientated towards the Russian market. They also, interestingly, point out the serious contradiction in the fact that the European Commission supports the vision of a multimodal transport system (by joining seaports, airports, road and railways), but, at the same time, almost exclusively finances road projects because automobiles are the preferred means of transport for citizens of the new member states. By the same token, the incentives for more environmentally-friendly transport infrastructures carry less weight in comparison to the citizens’ preferences and the car-makers’ group interests.
Today, while the TEN-T program coordinates and facilitates cross-border multimodal transport infrastructure developments, by focusing only on building motorways and high quality roads 17 that connect major urban centers, the much needed improvements of the underdeveloped connections between large cities and their surrounding towns (the “metropolitan roads”), that might generate stronger economic outcomes have been ignored. According to the OECD review, the economic benefit of intercity expressways comes in the form of the enhanced mobility of freight, whereas the “metropolitan roads” are needed to facilitate mobility and local deliveries that stimulate local productivity and economic activity (OECD 2008). Without more sophisticated empirical studies on this subject, the role that transport infrastructure plays in the development of the CEE member states, and, more specifically, in the investment outcomes, remains vague.
See European Commission 2009b: here: TEN-T Components: Roads, online: http://ec.europa.eu/transport/infrastructure/networks_eu/road_en.htm (6 September 2009).
In terms of trade and economic growth, the GMS and CEE economies remain comparable on a certain level. Taking the inception of the GMS program in 1992 and the enlargement of the EU in 2004 as starting points for the two subregions respectively, both experienced similar rates of GDP growth (see Tables 4 and 5). Further, the trade scene in the GMS has flourished with exports from the seven GMS economies rising from 37 billion USD in 1992 to 154 billion USD in 2005 – that is at a compound average annual rate of 11.6 per cent, as compared to the 8.4 per cent rise in world exports (ADB 2007). Intra-GMS exports rose at an annual average rate of 26.7 per cent during the 1992–2007 period, relatively faster than its trade with Asia or the rest of the world (Table 4).
Economic and Trade Average (Av) Growth
a
in the GMS, in Per Cent (1992-2007)
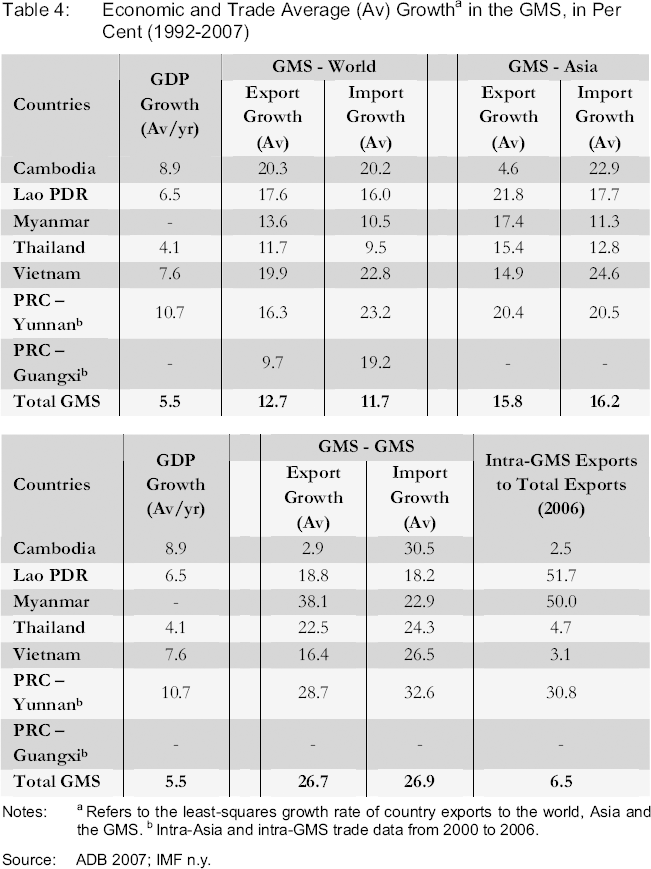
Economic and Trade Average (Av) Growth a in the GMS, in Per Cent (1992-2007)
Notes:
Refers to the least-squares growth rate of country exports to the world, Asia and the GMS.
Intra-Asia and intra-GMS trade data from 2000 to 2006.
Source: ADB 2007; IMF n.y.
Economic and Trade Average (Av) Growth a in CEE
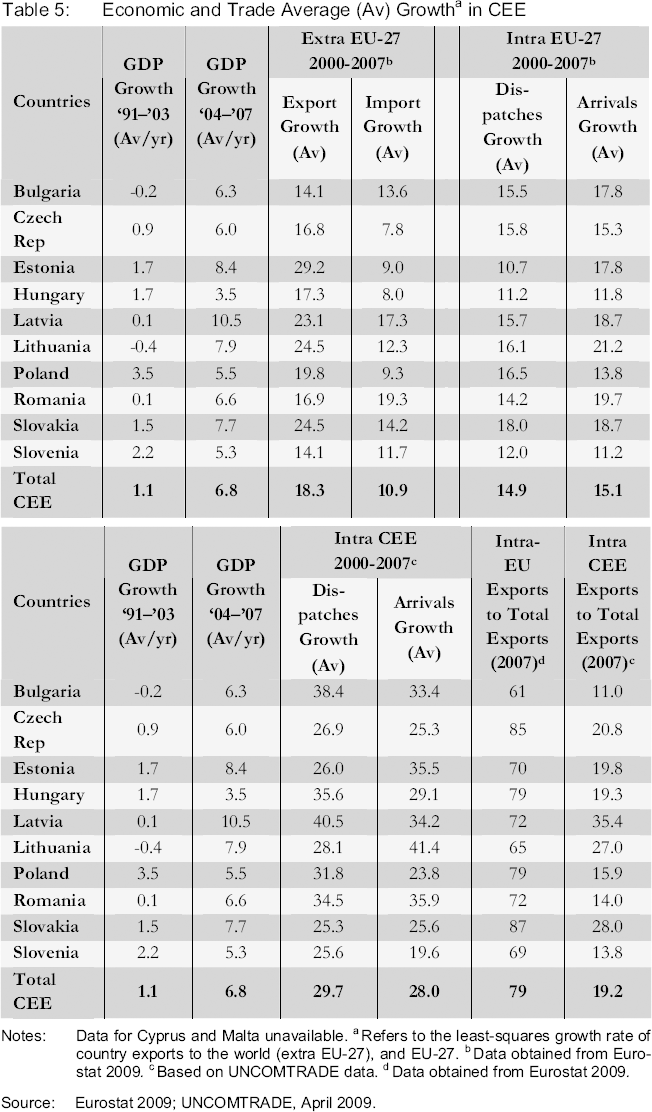
Notes: Data for Cyprus and Malta unavailable.
Refers to the least-squares growth rate of country exports to the world (extra EU-27), and EU-27.
Data obtained from Eurostat 2009.
Based on UNCOMTRADE data.
Data obtained from Eurostat 2009.
Source: Eurostat 2009; UNCOMTRADE, April 2009.
A similar pattern for the CEE member states can be observed, whereby they have registered a significant trade growth of 18.4 per cent since their accession to the EU in 2004 (this is even true for Romania and Bulgaria, who only attained membership in 2007) and that intra-CEE exports grew faster at an annual average rate of 29.7 per cent than their combined exports to the EU-27 (pre-2007, see Table 5). Taken as a whole, the two subregions trade more internally among themselves now than previously. However, the intra-GMS exports in 2006 are still low, at 6.5 per cent as compared with the 19.2 per cent (2007) intra-CEE trade, and are comparatively even lower than the 52 per cent, 59 per cent and 52 per cent intra-regional trade shares respectively (in 2006) of Asia as a whole, the European Union and North American countries (Gruenwald and Hori 2008).
These results are confirmed by a separate study conducted by UNESCAP (Figure 1), indicating that intra-GMS trade as a proportion of total trade with the world has increased by over 150 per cent during 1992–2006. Yet the proportion remains small at 4.5 per cent (partly because of the inclusion of China's trade in the intra-GMS calculations) in 2006 as compared to intra-ASEAN trade which stood at 24.7 per cent of total trade with the world, as well as intra-non-GMS ASEAN 18 trade, which made up 20.4 per cent of total trade with the world. This suggests a certain pattern of trade dependency, as will be discussed below.
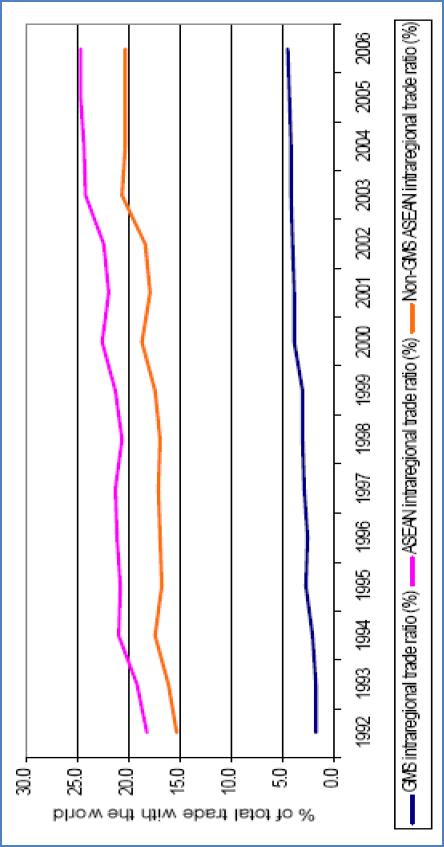
Intra-regional Trade Development: GMS, ASEAN and Non-GMS ASEAN (1992-2006)
Non-GMS ASEAN countries include Brunei, Indonesia, Malaysia, Philippines and Singapore.
Interestingly, as Figure 1 indicates, the difference between intra-ASEAN trade and intra-non-GMS ASEAN trade increased from 2.9 per cent in 1992 to 4.3 per cent in 2006, indicating that trade among GMS countries that are members of the ASEAN – Cambodia, Lao PDR, Myanmar, Vietnam and Thailand (CLMVT) – expanded slightly faster than trade among non-GMS ASEAN members, and the phenomenon can possibly be attributed to subregional cooperation and integration efforts (Duval 2008: 31–32). Critically, since the anticipated key drivers of subregional trade – the road corridor projects across Thailand, Laos and Vietnam to the PRC – are not yet fully operational, with most sections opening only in the last couple of years, and given that the trade facilitation measures under the CBTA have thus far been only partly introduced (initial implementation started at the Lao Bao-Dansavanh, Mukdahan-Kaysone Phomvihane, and Hekou-Lao Cai border-crossing points), the potential regional benefits from these initiatives may well be substantial – but it will require time and continued political commitment for them to be implemented.
Another noteworthy point is that Thailand, Vietnam and the PRC (Yunnan and Guangxi) are the major players in intra-GMS trade. Specifically, Thailand accounted for 33 per cent of intra-GMS trade in 2007, Vietnam for 17 per cent – compared to Laos, Cambodia and Myanmar, which made up a mere 2 per cent, 2 per cent and 4 per cent respectively, the rest being contributed by the PRC. 19 Bilateral import and export flows also show that the less developed countries in the GMS, particularly Cambodia and Lao PDR, have negative trade balances with their GMS partners. 20 These countries depend heavily on the export of natural resources and primary products (and garments) which are of lower export value, and the items are not diverse (Duval 2008; Ishida 2005). On the other hand, Thailand, Vietnam and Yunnan, being more industrialized, have export items that are more diverse – ranging from cereals to electronic equipment, and also higher value-added products (Duval 2008). As a result, with the development of the economic corridors, the trade deficits of the less developed GMS countries (i.e. Cambodia, Lao PDR and Myanmar) are likely to increase further. Such increases are not logistically effective since, in this scenario, full containers going one way can be empty on the way back, and trade relations will be strained when there is a shortage of foreign currency in these economies. Therefore, the industrialization and the diversification of export items of the less developed GMS countries will have to be promoted (Ishida 2005).
See: http://www.unescap.org/tid/artnet/artnet_app/images/GMS-Share_in_Intra-GMS-Trade.jpg (28 February 2009). Note that the trade figures for China represent that of the whole of the PRC, and only represents a proxy of the trade relations of its two economies (Yunnan and Guangxi) in the GMS or in the ASEAN.
See: Duval 2008; data for China, Cambodia, Thailand and Vietnam derived from the COMTrade database, June 2008.
At the ASEAN level, the GMS-ASEAN countries (i.e. excluding China) together accounted for only 17.4 per cent of ASEAN intra-regional trade in 1992 that has only increased by 5.25 per cent, to 22.65 per cent after 15 years. 21 Notably, Thailand and Vietnam alone have accounted for nearly 90 per cent of the GMS contribution to ASEAN intra-regional trade. These findings seem to suggest that the GMS and the ASEAN trade-related agreements have not been very effective in helping the poorer countries reach regional markets, implying that the benefits of trade liberalization and regional integration are biased towards the already stronger economies. Drawing from Oehlers (2006), Duval (2008) argues that increasing market access, either through better transport links as emphasized by the GMS program, or through preferential trade agreements such as the ASEAN Free Trade Agreement (FTA), may need to be accompanied by the enhancement of the productive (supply-side) capacity of the weaker countries, and that a coherent institutional framework should be in place to support it. This point was further emphasized by researchers of UNESCAP, in a meeting during the project fieldtrip. 22 As highlighted by Duval (2008), the over-emphasis on infrastructure enhancement may actually lead to a deterioration in the trade balance of the weaker economies, and increase inequalities both across and within countries, undermining the agenda of reducing the development gap and poverty levels in the poorest countries and provinces in the region (Duval 2008).
See: http://www.unescap.org/tid/artnet/artnet_app/images/GMS-Share_in_Intra-ASEAN-Trade%20v3.jpg (28 February 2009).
The capstone fieldtrip to Thailand and Lao PDR was made from 7-15 February 2009. The meeting with Trade and Investment Division, UNESCAP, was held on 11 February, 14h-16h30, in the UNESCAP Conference Room, Bangkok, Thailand.
Unsurprisingly, we observe a similar trend among the CEE economies (Figure 2). Intra-CEE trade expanded by 46.6 per cent between 2000 and 2007, suggesting that the CEE member states are becoming increasingly more dependent on trade among themselves. Furthermore, we can observe only a slight percentage increase in the intra-EU-27 and intra EU-15 trade between 2000 and 2004 (the year that the EU enlarged to include ten new member states), implying that the EU enlargement has had little impact in increasing the older EU-15 members’ overall level of intra-regional trade as a share of their respective total trade. However, it has resulted in a new topology of European trade; namely, a re-composition of trade share as illustrated by the difference between intra-EU-27 trade and intra-EU-15 trade, which increased from 7 per cent in 2000 to 8.3 per cent in 2004 and subsequently 9.5 per cent in 2007. This indicates that trade among the central-eastern and south-eastern member states expanded somewhat faster than trade among the EU-15 members. This phenomenon could possibly be attributed to the enlargement of EU membership in 2004 and 2007 fostering economic integration among the new member states, as well as between the new member states and the older member states.
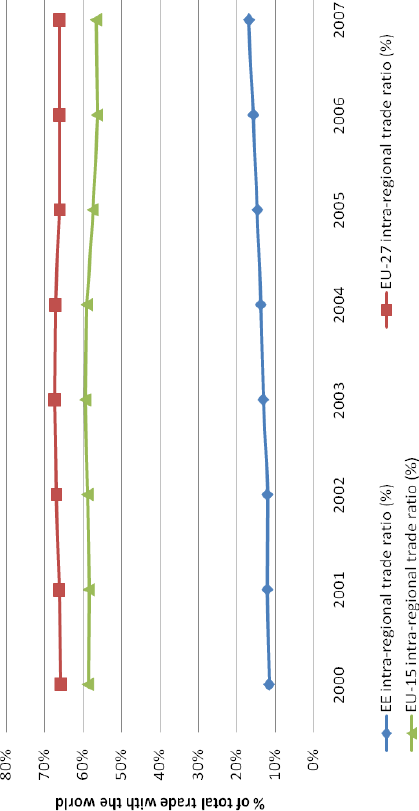
Intra-regional Trade Development: CEE, EU-15 and EU-27 (2000-2007)
Growth in Intra-regional Trade: GMS, ASEAN, and Non-GMS ASEAN (as in Per Cent of Total Trade with the World)
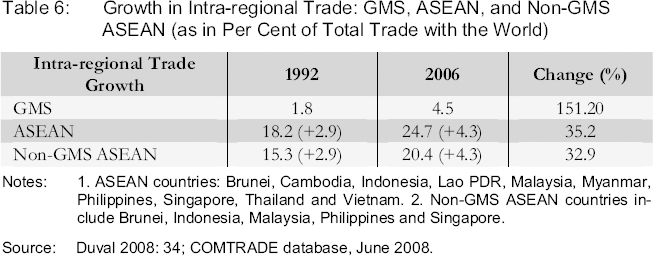
Notes: 1. ASEAN countries: Brunei, Cambodia, Indonesia, Lao PDR, Malaysia, Myanmar, Philippines, Singapore, Thailand and Vietnam. 2. Non-GMS ASEAN countries include Brunei, Indonesia, Malaysia, Philippines and Singapore.
Source: Duval 2008: 34; COMTRADE database, June 2008.
Growth in Intra-regional Trade: CEE, EU-15, and EU-27 (as in Per Cent of Total Trade with the World)
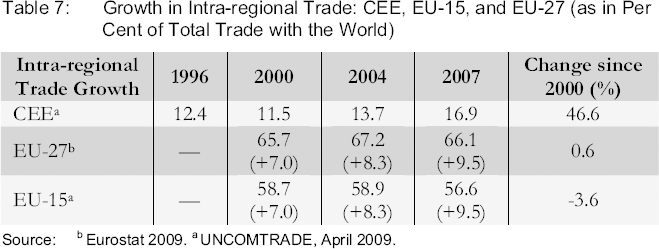
Source:
Eurostat 2009.
UNCOMTRADE, April 2009.
These findings are supported by a Eurostat report published in 2007, where it was reported that trade in the twelve new member states (after the 2004 and 2007 accessions) grew at an average annual rate of 8.1 per cent between 2000 and 2003. From 2003 to 2005, EU-27 trade growth was lifted by the new member states’ annual average trade growth of 13.7 per cent as compared to 11.1 per cent in the EU-15. The new members have also benefited from export-led developments. It has been observed that there is some correlation between growth rates in dispatches (intra-regional “exports”) and GDP. EU-27 GDP grew at a yearly average 4.4 per cent during the period from 1999 to 2006, however, the three groups of member states (EU-15, EU-10, Bulgaria and Romania) clearly displayed different growth rates: the EU-15 member states’ median annual GDP growth rate was 4.5 per cent, and that of the ten member states that joined in 2004 was 10.5 per cent, and that of the two that joined in 2007 was 13.7 per cent. EU-27 dispatches (intra-regional exports) increased by 7.2% yearly on average between 1999 and 2006. To further break down these figures, the median yearly growth rate over the same period of the EU-15 member states’ dispatches was 6.2 per cent, compared to the median average growth rate of intra-EU-27 dispatches of 16.4 per cent in the group of ten new member states that joined in 2004, and 18 per cent in the two member states that joined in 2007. This clearly supports the fact that intra-EU-27 trade has been boosted by enlargement, with strong contributions from the new member states (Eurostat 2007).
The recent publication, Five Years of an Enlarged EU, by the European Commission also confirms these results, showing that
the new member states increased their export shares in the EU-15 market more strongly before accession while the dynamic is stronger in the intra-EU-12 [CEE members plus Cyprus and Malta], which points to a pattern of regional integration through trade in Central Europe (European Commission 2009a: 57).
However, similar to the GMS case, with the exception of a few CEE countries, the region's trade and current account deficits from 2000–2007 have become a growing concern (see Eurostat 2009). The Baltic States, Bulgaria and Romania have been far less successful in penetrating the markets of other EU members. These deficits were aggravated in 2006–07 by the rapid growth of consumption, which could not be satisfied from domestic production alone. Consequently, this led to an increased demand both for imported consumer goods and for materials for the local production of consumer goods. Besides, the demand for imports of capital goods to modernize and restructure the economies is largely sourced from the EU-15, and in particular Germany, creating further pressures of deficits on the balance of trade and payments.
Importantly, as can be observed in Figure 1 and Figure 2, a huge difference in intra-regional trade shares (Intra-ASEAN vs. intra-EU-27, intra-non-GMS ASEAN vs. intra-EU-15, intra-GMS vs. intra-CEE) can be noticed. It is clear that trade among ASEAN members has been significantly lower than within the EU. As Figure 3 shows, while all the GMS countries appear to be highly dependent on world trade, their dependence on GMS or ASEAN trade is often relatively low. Even more striking is the fact that the dependence of Cambodia and Lao PDR on trade with non-GMS ASEAN members is remarkably little given that the group includes the majority of ASEAN members and its largest economies (Singapore, Malaysia, and Brunei). Despite the fact that all the GMS countries have had positive change in their dependence on GMS or ASEAN trade since 1992, the change has been significantly larger in world trade (Figure 4), suggesting that trade in the GMS and the ASEAN has “evolved quite independently from formal trade liberalization and integration initiatives” (Duval 2008).
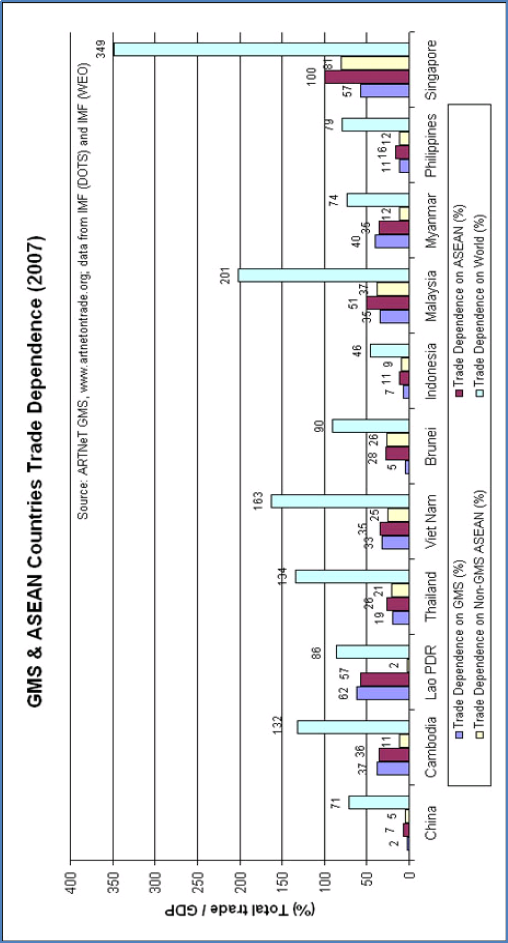
The Trade Dependence of the GMS Countries (2007)
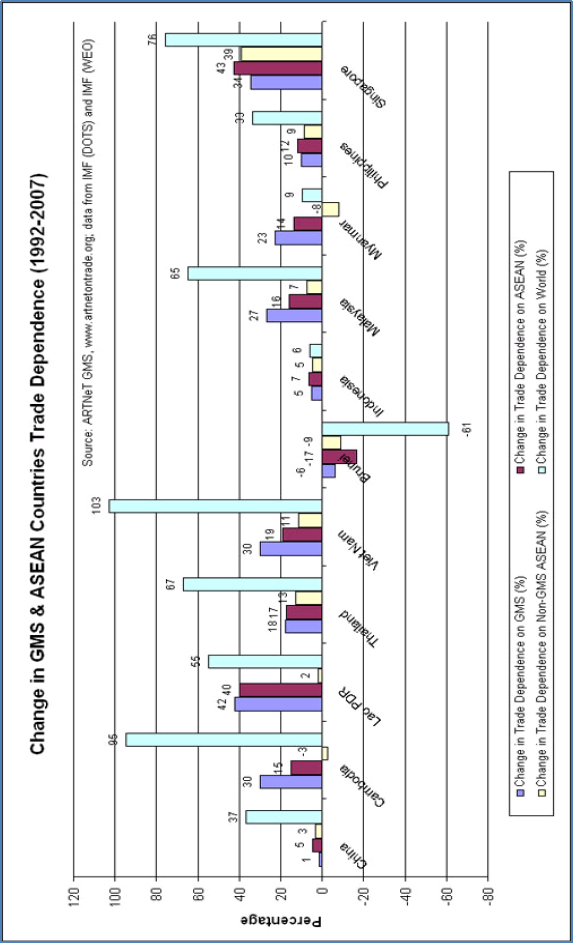
Change in Trade Dependence of GMS Countries (1992 vs. 2007)
On the other hand, an important difference with trade developments in the GMS is that the CEE members are largely dependent on intra-EU-27 trade (Figure 5). The CEE economies are also relatively more dependent on trade with the “older” EU members (EU-15) than they are on trade with the rest of the world (extra-EU-27 trade). As indicated in Figure 6, most of the CEE member states have experienced a positive change in dependence in all directions of trade, except for Estonia, Hungary, Latvia and Romania, who have seen a decrease in dependence on trade with the EU-15, but more trade with other CEE economies. On the other hand, it can also be inferred from the figures that Bulgaria, the Czech Republic, Poland, Slovakia and Slovenia's increased dependence on EU-27 trade is predominantly driven by trade with the EU-15 member states.
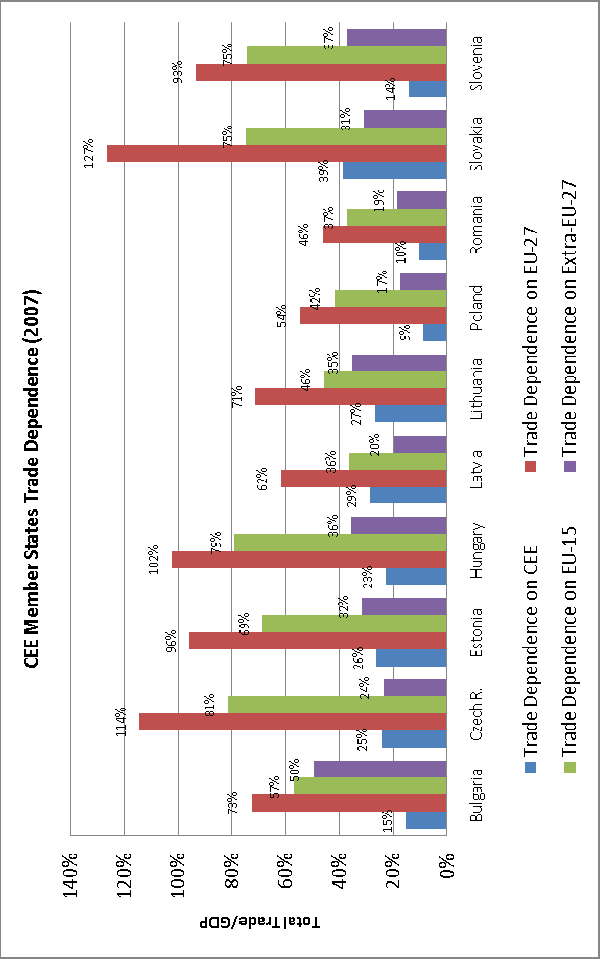
The Trade Dependence of CEE Countries (2007)
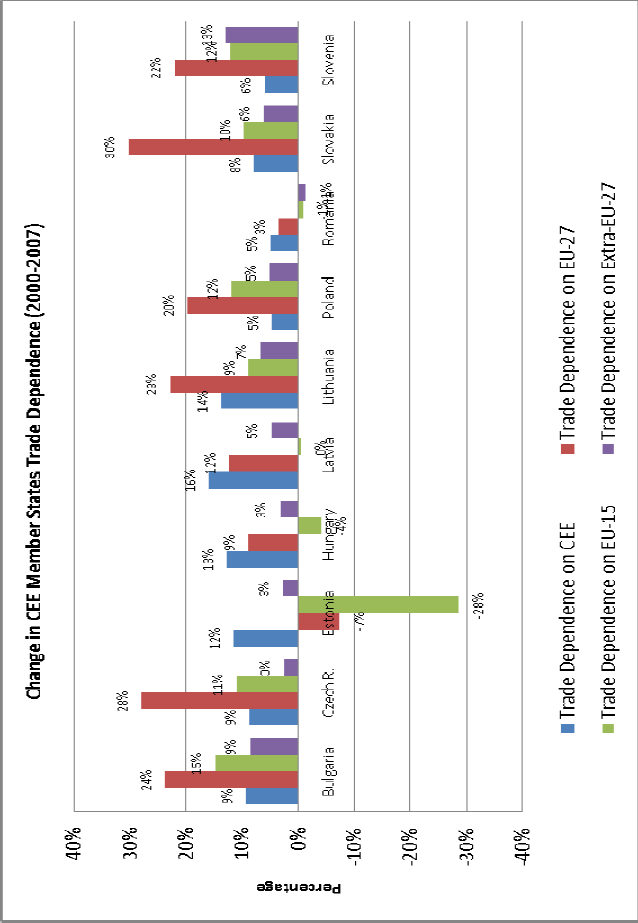
Change in Trade Dependence of CEE Countries (2000 vs. 2007)
Another key observation shows that the intra-CEE share of intra-EU-27 trade has risen from 1.1 per cent in 2000 to 2.8 per cent in 2007, and that the growth has been more rapid since the enlargement in 2004 (Figure 7) – important evidence of stronger integration among the CEE member states since their accession to the EU. However, this share has not expanded significantly over the period from 2000 to 2007, a trend that can be attributed to the CEE's faster growth in extra-EU-27 trade. Subsequently, the overall growth in the share of intra-EU trade to the CEE members’ total trade has expanded by only 0.3 per cent between 2000 and 2007.
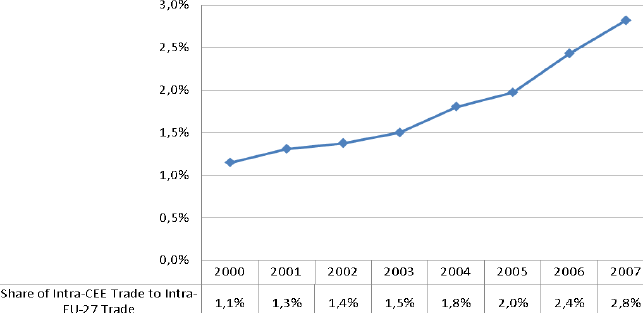
Intra-CEE Trade as a Share of Intra-EU-27 Trade (in Per Cent)
As noted above, while regional integration in the GMS has been strongly supported by transport infrastructure investment reducing the physical trade costs, the role that transport infrastructure plays in the regional development of the CEE subregion remains obscure. Instead, growth in the CEE is said to be driven by their successful transition to market economies, their accession to the EU, the rapid growth in domestic demands, their ability to attract FDI and the build-up of small and medium sized enterprises (SMEs). Importantly, according to a study conducted by Badinger and Breuss (2003), income growth alone accounted for approximately two-thirds of the total growth of intra-EU-27 trade over the period from 1960 to 2000, while trade liberalization (tariff reductions) accounted de facto for the rest of the growth. The reduction in trade costs showed no significant effect on the growth of intra-EU-27 trade. This is the main paradox of the transition in Central Eastern Europe when compared to that of the GMS. The difference can be explained by their trade facilitation system and the local institutional arrangements which will be elaborated in the following section. There is another paradox in that, despite the differences concerning the links between transport and growth, both regions face similar difficulties at the local level in the implementation of trade rules. This is, then, ultimately an issue of governance.
Trade Liberalization and Trade Facilitation Measures – the “Soft” Aspects
The main weakness in the GMS approach to regional development has been identified as the absence of the “soft” aspects of trade facilitation measures. The most recent findings of a study on this, which was conducted by Stone and Strutt (2009) for the ADB, reveal that once a sufficient physical system is in place, additional benefits from improvements of the physical infrastructure are only marginal in comparison to those that come from the improvement of the “soft” aspects of trade facilitation (Stone and Strutt 2009). The World Bank lends further support to this finding, arguing that better transport infrastructure and services are most effective alongside other trade facilitation 23 measures – including, among others, liberal trade regulations, available trade finance, insurance services, security systems that comply with international requirements, efficient and honest customs services and other border services, and corridor performance monitoring (World Bank 2008; World Bank 2009).
The WTO defines trade facilitation as the removal of obstacles to the movement of goods across borders. See: http://www.wto.org/english/thewto_e/glossary_e/trade_facilitation_e.htm (28 February 2008). These obstacles may comprise human and physical infrastructure, along with institutions including customs and trade-related services.
Further, other studies have also found that the potential gains from reform in trade facilitation (i.e. in reducing trade costs or transaction costs) can be greater than those from tariff reductions, hence this is why there is now increasing attention on trade facilitation or the “soft” infrastructures – where governance 24 is a critical aspect (De 2008; Edmonds and Fujimura 2006; Roland-Holst, Verbiest, and Zhai 2008; Brooks and Menon 2008). For instance, Anderson and van Wincoop (2004) estimate that in industrialized countries, trade costs are equivalent to a tax of 170 per cent, comprising 55 per cent in local distribution costs and an additional 74 per cent in international trade costs. Of these, transport costs accounted for 21 per cent and border-related barriers for 44 per cent. In general, while infrastructure is the key, its returns on investment are probably highest during the early stages of development, when it is scarce and when basic networks have not yet been completed. Once economies reach a certain maturity, returns on infrastructure investment tend to fall (Roland-Holst 2006). Therefore, these studies have strongly indicated the significance of trade facilitation and logistics in stimulating trade flows – through the improvement of transport efficiency, the reduction in cross-border delays, and the decrease in informal payments at the border.
Governance can be thought of here as the institutions and processes by which collective decisions are made, and by which problems are solved.
In the CEE subregion, it seems that their developmental path has gone in the opposite direction. If, as according to Badinger and Breuss (2003), the reduction in trade costs showed no significant effect on the growth of intra-EU-27 trade from 1960 to 2000, then the post-2000 trade can be said to be driven by continued EU enlargement. This drives trade liberalization between the old and the new member states, and is especially beneficial for the new member states who now gain larger market access, not only to the older member states but also among the new member states. Besides, the CEE members also experienced higher extra-EU-27 export growth, which indicates the successful internationalization of their products, stronger integration with international markets and that the creation of trade was stronger than the trade diversion effect. More critically, the poor level of transport infrastructure in the CEE member states is increasingly seen as an impediment to further intra-regional trade improvements, as is revealed by a case study of Poland (Assawamanakul et al. 2009), where the poorly developed transport network poses a serious handicap to trade.
Another key element that can explain the variation in experience between the both regions is their respective local institutional arrangements. The GMS Program of Economic Cooperation (GMS program), initiated by the ADB, is designed as a relatively flexible, activity-based program as opposed to a rules-based form of cooperation such as the ASEAN, or closer forms of political and economic integration like the EU. This means that in the GMS, member countries collaborate on specific activities, principally in the key sectors of road and power infrastructure, and to a lesser extent tourism, under the umbrella of the GMS program. The most important trade facilitation initiative of the GMS program, and the only formal agreement, is the multilateral Framework Agreement on Facilitating Cross-Border Transport of Goods and People, which is expected to enhance trade further. Disappointingly, the implementation of the CBTA has encountered significant challenges, both at the national and local level. As a result, although the member countries have benefited from their subregional cooperation, the tangible progress in terms of significant regional impact has been marginal and only realized progressively. Further, while all the GMS economies, with the exception of the PRC, are members of the ASEAN and are signatories to the ASEAN Free Trade Area (AFTA), ASEAN's fundamental principles of “respect for the independence, sovereignty, equality, territorial integrity and national identity” and the “non-interference in the internal affairs” of all ASEAN member states (ASEAN 2008) are challenges to effective collective actions and thus makes far-reaching policy implementation extremely difficult.
On the other hand, the breakup of Soviet-type rule in Central Eastern Europe in 1989, the dissolution of the Soviet Union in 1991 followed by preparation for EU accession during the 1990s and, finally, becoming an EU member state has been the general development path taken by many of the CEE countries. In the process, there has been a reorientation of trade to now be directed towards the more developed European countries. The EU philosophy of building towards an integrated single market requires the harmonization of trade rules and regulatory systems (on agreed minimum standards), and the mutual recognition of the different national rules that conform to these benchmarks by all member states. In other words, in the process of creating a single market, the EU has not only targeted the reduction of those obstacles to trade that are confined to barriers at borders – such as tariffs and traditional non-tariff barriers (such as quotas) – but also, through the Rome Treaty, is addressing the need to harmonize domestic regulations that might be used as ways to discourage trade, and consequently hinder the process of economic integration 25 (Holmes 2006).
From the EU's perspective, any regulatory differences, even if non-discriminatory, can act as potential barriers to trade.
In the process of acquiring EU membership, the new member states were required to participate in the single market, and thus, in other words, to take the necessary steps to harmonize their domestic policies with EU standards. A strong institutional framework has been created to support this – including the European Parliament, the Council, the Commission, the Court of Justice and the Court of Auditors. The EU's approach to regionalization and regional development has created a rule-based, formalized form of cooperation, which allows for multi-level governance. However, this is not to say that policy implementation has been smooth sailing. Besides, Holmes argues that
there is an inevitable trade-off between national regulatory sovereignty and market integration […] the stricter we are about disciplining trade barriers, the greater the danger that perfectly reasonable measures will be caught by the rules (Holmes 2006: 816).
Despite these challenges, the “European mix” of trade regulatory policies for the creation of the single market has been the key to influencing trade growth.
Even though Poland, among the CEE member states, has made by far the largest investment in absolute terms in transport between 2000 and 2006, the investment was one of the lowest on a capita basis at 76.5 EUR (Table 1). Since 2000, there has been a reduction in the rail density, and the density of hard surface public roads only increased marginally in about half the regions, while the rest actually saw a decline. In 2003, Poland had nearly 424,000 km of roads (111 km of road per 10,000 inhabitants), of which almost 70 per cent were paved. Today, Poland has only 99.4 km of road per 10,000 inhabitants, compared to an average of 145 km in the EU-27. Poland has the most limited highway network in Europe with only 663 km of such roads and 297 km of expressways. The length of the actual network is insufficient and there is a severe lack of secondary roads. The quality of the existing major infrastructure (road, railways, seaports, aviation) is also a major problem, as they are either underdeveloped or in poor condition and in urgent need of repair, upgrading and extension: only 3 per cent of roads meet EU freight and security standards, and most roads can only carry several tones per axle under the current regulations (OECD 2008).
Besides, the increase in traffic composed of heavy international lorries has led to the rapid deterioration of the main transit routes, adding pressure to Poland's road safety situation which has seen a significant increase in the number of casualties from road accidents. Compared to its road infrastructure, Poland has a more extensive rail network, of more than 19,400 km in total length and makes up approximately 9 per cent of the rail lines in the EU (the third largest in Europe), but its density is decreasing and the capital stock has long been obsolescent, and the maximum speed of 40 per cent of the operating network is less than 80 km/h (OECD 2008). It can also be observed that the existing fragments of motorways are not linked to the border crossing points especially from the east, where the “walls” of the eastern regions (Lubelskie, Podkarpackie, Podlaskie, Warmińsko-Mazurskie) have so far been completely ignored in the construction of express roads and motorways. While the network of cross-border roads is dense along the borders with Germany and the Czech Republic, it is sparse in the areas bordering the Ukraine and the Slovak Republic, and the eastern border is still crossed by a number of roads on which there are no border crossings. Further, it has also been identified that the north-south connections have been poor because the transport network has prioritized east-west links over the north-south axis since the Communist era, and this tends to make Poland a transit country along the east-west corridor but fails to take advantage of its strategic position in the Baltic Sea region. Therefore, the current network does not facilitate traffic continuity throughout Poland on any international transit route (OECD 2008), and this is a major obstacle to trade.
Although Poland benefits from the same advantages as the other new EU members, the disparate levels of competitiveness of the country's transport infrastructure throughout its various regions can be explained by historical factors. First, Poland suffered tremendously from the national divisions of the country among three foreign powers during the period between 1795 and 1918. These three parts were strongly disconnected from each other, and by the end of the First World War, it was extremely hard for the nation to reconnect the new Polish territory. Second, the western part was much more developed and connected to Germany than the southern-eastern region, which was linked to the Austro-Hungarian Empire, or the eastern region, which was connected to the Russian Empire. Third, for 44 years the Communist authorities focused on improving the then-existing transport networks (particularly railways, and not roads) rather than on creating new ones. Because trade was eastern- and Soviet-orientated, the improvement of infrastructure in the western, formerly more developed regions, was neglected. However, even within this framework, the eastern transport networks that were developed were of poor quality. Finally, many obstacles have surfaced from the transition period itself (i.e. since 1990).
The Ministry of Transport has not been reformed during this period. Their experts and civil servants continue to maintain that key transport infrastructures must be decided from the top, centralized level, and that the regions have no prerogatives at all concerning spatial planning. Further complicating the situation, a key law that was passed in March 1990 has transferred more legislative capacities to communes. Even though they had no real financial resources, the communes have the capacity to “veto” all national laws. In short, these facts suggest that in Poland there is a serious governance problem.
Lack of Governance in the Eastern Regions of Central Eastern Europe
Governance remains the main challenge of regional development in Central Eastern Europe (and in the EU-27 as a whole) (Barca 2009). Several critical reports have supported Barca's assertion. All of them criticize shortcomings that have to do with historical territorial inequalities, weak institutionalization and a paucity of multi-level governance.
The first set of shortcomings is the disconnection, and sometimes even the opposition, of the interests of the central and local authorities. For instance, the Shengen legislation that requires all peripheral EU members to impose strict controls on the movement of all goods and people into the EU area could appear very contradictory to the interests of the local people living in the border regions, who have developed informal trade and economic exchanges to combat the extensive territorial crisis since the 1990s. Therefore, a huge “grey economy” and a “black market” have emerged along the eastern borders in Central Eastern Europe in response to this restrictive border regime (Bachman 2007). This was a necessary trade-off for the border populations, who have suffered considerably since the breakdown of the former Soviet-style economy. In these eastern regions, former collective farms and state-owned enterprises (SOEs) have been liquidated and unfortunately no FDI has moved into these historically backward regions, which were artificially supported during the Communist period. The EU regulation rubs salt in the wound, and can be perceived as an obstacle to local livelihoods and survival. Therefore, many local initiatives have emerged with the tacit agreement of the local authorities, such as allowing migrants from the Ukraine to migrate to Polish, Slovak and Hungarian rural areas. Furthermore, widespread corruption has supported these initiatives.
The second set of shortcomings refers to the limited institutionalization in the eastern regions as opposed to the western ones. Even if the eastern EU regions are regionalized, their counterparts on the other side, outside the EU regions, are always highly centralized. For instance, in Russia, in Belarus, in Ukraine or in Turkey, the partners are not at local or regional level, but at the central level located in Moscow, Minsk, Kiev or Istanbul, and these authorities are absolutely not interested in a cross-border cooperation because that could reinforce the claims of the periphery for more self-governance. On the other hand, in the western regions of the new member states, urban and transports networks are much more developed. The local authorities have greater capacity to set up local links and local initiatives, and negotiate directly with their local counterparts. This implies that institutions in the “Euro-regions” 26 that have been strong in local trade facilitation are much more developed in the western part than in the eastern one. Hence, the key to success depends on strong vertical exchanges between central, regional and local authorities, and on strong horizontal links between local, public and private partners (Bafoil 2010).
Euro-regions have been created in the western part in the 1980s for facilitating trade and local cross-border initiatives between bordering regions. This initiative, intended to strengthen relationships between populations that have historically suffered destructions and animosities has been rather successfully extended to Central Eastern Europe. However, if they have proven to be efficient between “old” European regions (for instance within the “Great Region between Germany, France, Luxenburg and Belgien) and “new” ones (for instance between German Brandenburg and Polish Pomerania) it still does not applies to the eastern border regions of the new member states and the regions of Russia, the Ukraine, Belarus or Turkey.
The third set of shortcomings emphasizes the strong territorial inequalities that divide the eastern regions. Notably, these inequalities are even more apparent between the new members and the other EU member states. Figure 8, below, shows this clearly by indicating that the traffic flow through Poland's eastern border to Lithuania, a neighbouring EU member state, has increased rapidly, especially between 2003 and 2005. On the contrary, traffic flow has only increased gradually to non-EU states such as the Ukraine and Russia. Taken together, these shortcomings are likely to trigger a “tunnel effect” that increases the marginalization of the eastern regions and renders the provision of Structural Funds even more essential.
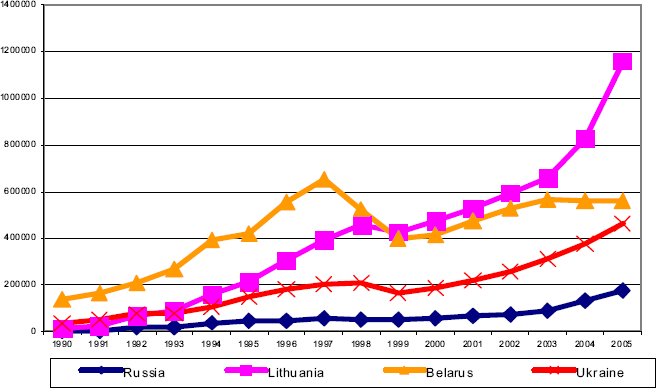
HGV Traffic through Poland's Eastern Border, 1990-2005
What is paradoxical is the fact that, despite the strong differences in the institutional framework between the two regions of the EU and the GMS, similar remarks can be made about their local governance.
According to a “Regional Policy Dialogue on Trade Facilitation Policy Gap Analysis CBTA in the GMS”, which was organized by the Mekong Institute in 2008, the conclusion has been reached that despite the potential benefits of the CBTA, major challenges remain in the full implementation of the CBTA initiatives. These challenges include the ratification of the CBTA annexes, the difficulty of establishing efficient border management systems due to resource constraints, the problem of streamlining and harmonizing border control documents due to conflicting issues and differences between the legal and regulatory frameworks of the respective member countries, the lack of understanding of the agreement by local officials, and also the lack of available information for the private sector (Mekong Institute 2008).
Furthermore, conflicting interests among actors at the national level often delay the policy-reform process. Additional to this is the perception of local officials that the donors to the project are the biggest winners – Japan will benefit largely from the east-west corridor that will link the South China Sea to the Andaman Sea, thus connecting East Asia to South Asia, which will provide stimulation for its own automotive industry – and as such there is, at the local level, little interest or willingness to implement the agreement quickly and effectively. Another consideration is that local officials might be concerned about the loss of informal revenues, namely illegal fees and bribes, which they would otherwise collect to supplement their usually low civil service wages.
It can also be noted that no evaluation mechanism has been established to assess the implementation process or the effectiveness of the CBTA. There have been major difficulties faced in the implementation and enforcement of the CBTA. However, conflicts are often resolved through negotiations, and emphasis is given to the incentives for cooperation, so as to encourage compliance and as an alternative to the use of sanctions, which do not exist in the first place. While efforts to fully implement the CBTA continue, the current focus of the ADB is on further trade facilitation through the Strategic Framework for Action on Trade Facilitation and Investment (SFA-TFI), which is centred on customs harmonization, sanitary and phyto-sanitary (SPS) cooperation, logistics development and business mobility. SFA-TFI is said to play a prime role in supporting the full implementation of the CBTA. The question then arises: if the CBTA is a multilateral legal agreement, and Memorandums of Understanding (MOUs) have been signed for its initial implementation at selected border-crossing points, why has the implementation not been effective, to the extent that another initiative (SFA-TFI) is required to support its full implementation?
Finally, several partners whom we met with during our empirical research 27 have underlined the fact that there is a significant gap between the capacities of the local officials who actually implement the policies and the high-level officials who participate in the ADB or ASEAN meetings. There is both a lack of understanding of the agreements on the part of the local officials, and a lack of appreciation on the part of the high-level officials of the challenges faced in implementation at the local level. There are also significant contradictions between national laws and regulations and the CBTA's annexes and protocols, a situation further complicated by the overlap with other multilateral and bilateral agreements and regulations – reforming these is no easy task. Besides, at any border-crossing point, the coordination of a number of key national agencies – such as customs, immigration and quarantine – is required, and their operations are made more difficult by the involvement of several different ministries. As reflected in the policy dialogue (Mekong Institute 2008), CBTA's implementation is limited by the lack of domestic and regional inter-agency coordination and cooperation, the achievement of which would require further, extensive policy dialogues at the local/ provincial, national and regional levels.
We met them during a study trip realized at the local border Savannakhet-Mukdahan in March 2009. See Assawanmanakul et al. 2009.
To sum up, the governance and institutional framework in place to implement the CBTA is extremely weak. Well-planned and well-coordinated policy measures and actions are urgently needed, stakeholder participation and consultation must be enhanced and an effective and efficient coordination and cooperation mechanism has to be established for relevant agencies at the micro, meso, and macro levels.
A solid transport infrastructure is a basic requirement for facilitating trade, through the reduction of both time and transport costs. While transport infrastructure has been the backbone of regional economic development in the GMS, trade growth in CEE has proceeded without significant improvements in the subregion's own transport infrastructure. Instead, growth performance in the CEE economies can be largely attributed to their success in transition into market economies and the reorientation of their exports towards the EU-15. In particular, their accession to the EU, have also opened access to markets among themselves and helped them to improve their institutional capacities that allowed them to attract significant FDI. This in turn resulted in knowledge and technology transfers contributing to the virtuous cycle of economic development. Despite these gains, the poor level of transport infrastructure is increasingly being seen as a hindrance to further regional development, and underscores the governance challenges faced in the implementation of infrastructure projects, despite those being given the high priority in the EU's regional development agenda.
In contrast, the focus of the GMS program on building “hard” infrastructures in the past decade or so have neglected the more basic necessity to reduce tariffs that are still higher than those of the more developed economies, 28 non-tariffs and technical barriers to trade, and other trade facilitation measures. This highlights the difficulties in enforcing trade facilitation programs and agreements in the GMS that stems from the less formal institutional arrangement, and points to the inevitable trade-offs between national sovereignty and market integration. The disconnection between high-level officials objectives and interests of local bureaucrats further poses governance issues to the region. Therefore, even though great improvements have been made to the transport infrastructure in the GMS, its potential at unlocking growth and development is far from being reached until a more formal institutional framework and governance structure is put in place.
Ratna (2009) argues that tariffs were, and still are, a major source of revenue for governments in developing countries, and thus they are inclined to protect their infant industry, need time to attract FDI inflows and also want to provide time for their existing industries to adjust to the challenges of globalization. These factors pose significant political challenges to policy reforms. Not only do developing countries have to reduce their dependency on tariffs revenue through fiscal reforms and the implementation of other tax regimes, but also make commitments to further and faster trade liberalization that will enhance trade performance in the region. However, in the ASEAN, under the AFTA, the least developed GMS-ASEAN countries (Cambodia, Lao PDR and Myanmar) are given longer time-frames in which to liberalize their tariff preferences, and besides, no special and exceptional treatment is accorded to them in the rules of origin criteria, which could enhance their preferential exports; they gain effective market access only if they are allowed access for items that they are actually able to export.
Whether it is transport infrastructure or “soft” trade facilitation measures or trade liberalization that has a larger impact on trade and regional development calls for further research. However, it is clear from our study above that these three elements have a direct positive impact on trade and regional growth. More importantly, the comparison of the GMS and the CEE subregion also points to the importance of the institutional framework and governance in fostering regional growth and development.
Unlike in the GMS or the ASEAN, EU regionalism is characterized by high levels of formality, established supranational institutions and a pooling of sovereignty among its 27 member states. The EU, through various means – such as conditionalities, European Commission laws, de facto constitutionalization of the Treaties and explicit agreement by the member governments – has had a major impact on the member states, requiring them to make major structural and policy adjustments. In addition to this, they have also been required to make institutional reforms so as to conform to EU policy, sometimes at the expense of part of their national sovereignty (e.g. on agricultural policies).
Conversely, the cooperation process in the GMS has been regularly influenced by a variety of actors at the international, national, regional and local levels, with all their varying interests. In instances like the GMS, where the economies involved are disparate in economic size and in the level of economic development (and therefore have differences development priorities), the unequal benefits and costs of trade liberalization and regional integration becomes even more apparent, highlighting the prominence of asymmetries in bargaining power between the larger and smaller economies. From a political economy perspective, the varying strengths and weaknesses of regulatory regimes between the GMS countries also raises complexities not typically encountered in single-country projects, and these make cross-border projects particularly difficult to coordinate and develop. Although the ADB provides opportunities for policy dialogues among the GMS economies so as to facilitate greater cooperation in regional development, it has met with severe difficulties in the enforcement of agreements, and severe challenges in actual implementation, limiting the degree of its regional impact. Within the larger institutional framework of the ASEAN, the norms of informality, non-interference and consensual decision-making processes pose certain obstacles to stronger regional integration, especially given that national sovereignty is very important in this region, and there are no supranational institutions.
The dynamics underpinning the regional integrative processes is a complex interplay between institutional frameworks and governance structures. Building transport infrastructure is only a mean to an end in improving connectivity and promoting growth. Despite the differences in institutional and governmental structure, both CEE member states and the GMS economies face similar governance challenges, albeit of a different nature, in the derivation of maximum benefits from their respective regional development policy. Therefore, a well-functioning governance structure plays a key role in establishing the link between transport infrastructure and regional development.