
Abstract
Introduction:
The neck–shaft angle and head–shaft angle in children with varying levels of neurological disability were evaluated to define change over different ages.
Methods:
Children aged 1–12 years with spastic cerebral palsy, spinal muscular atrophy types 1 and 2, or typical development were reviewed to evaluate the neck–shaft angle and head–shaft angle. Patients were divided into five groups: Gross Motor Function Classification System levels I and II, Gross Motor Function Classification System level III, Gross Motor Function Classification System levels IV and V, spinal muscular atrophy types 1 and 2, and typical development. A linear mixed model was utilized to evaluate neck–shaft angle and head–shaft angle.
Results:
Data from 196 children (mean age 4.8 ± 4.5 years) were included. Gross Motor Function Classification System levels I and II: 22 children, 130 hip radiographs measured, neck–shaft angle 143.7 ± 7.4, and head–shaft angle 160.0 ± 7.1. Gross Motor Function Classification System level III: 8 children, 33 hips evaluated, neck–shaft angle 153.1 ± 4.3, and head–shaft angle 163.4 ± 4.2. Gross Motor Function Classification System levels IV and V: 30 children, 137 hip radiographs measured, neck–shaft angle 156.4 ± 5.6, and head–shaft angle 167.9 ± 6.8. Spinal muscular atrophy types 1 and 2: 32 children, 83 hip radiographs measured, neck–shaft angle 161.9 ± 9.7, and head–shaft angle 173.4 ± 7.4. Typical development: 104 children, 222 hip radiographs measured, neck–shaft angle 138.6 ± 7.0, and head–shaft angle 156.4 ± 5.9. There were significant statistical differences when comparing neck–shaft angle and head–shaft angle.
Conclusion:
As children grow, neck–shaft angle and head–shaft angle tend to decrease in typical development and Gross Motor Function Classification System levels I and II groups. However, in low-tone (spinal muscular atrophy types 1 and 2) and high-tone groups (Gross Motor Function Classification System levels IV and V), neck–shaft angle and head–shaft angle tend to increase with age. In both low-tone and high-tone groups, coxa valga is observed. When evaluating the effect of proximal femur-guided growth, these defined normal growth patterns should be considered.
Level of Evidence:
Level III Retrospective comparative study.
Keywords
Introduction
Proximal femoral geometry varies in children due to factors such as age, genetics, and medical conditions. 1 One particular aspect of proximal femoral geometry is coxa valga, which refers to an increased angle between the neck and femoral shaft (neck–shaft angle (NSA)) and the head and femoral shaft (head–shaft angle (HAS)) and is often associated with hip dislocation in children with cerebral palsy (CP). 1 In typically developing children, HSA starts high and decreases over time, consistent with the acquisition of weight-bearing and ambulation. 2 By contrast, in children with CP and spinal muscular atrophy (SMA), HSA starts high and remains high, associated with increased coxa valga, increased hip migration percentage, and secondary acetabular dysplasia.2,3 Abnormal joint forces are theorized to cause changes in proximal femoral growth and geometry. 2 The optimal treatment of early hip dysplasia in children with CP has not been determined. 4 In young children, force balancing and muscle lengthening procedures as well as bony hip reconstruction have been widely used. To avoid reconstructive bone surgery, there has been increased interest in using guided growth in the proximal femur to correct the coxa valga. 5 If abnormal growth is the primary driver, interventions that modulate proximal femoral growth by reversing coxa valga seem to be the better option. In addition, proximal femoral-guided growth has the potential to provide dynamic correction of proximal femoral deformity during growth,6,7 with a low complication rate. 7
This research aimed to assess NSA and HSA at ages as close to birth as possible and up to skeletal maturity, comparing children with low-tone conditions with children with high-tone conditions and children with typical development (TD). The goal was to determine whether there was a difference between low tone and high tone in the evolution of childhood coxa valga. The role of spasticity in the development of coxa valga is a topic of ongoing research and controversy. 5
Methods
Institutional review board approval (approval number 1936699) was obtained for this study. A review of standard anteroposterior pelvic radiographs and medical records from 2006 to 2022 was performed to assess the proximal femoral geometry in children. The study included children between the ages of 3 months and 12 years. This age range was chosen because it corresponds with the time when the proximal femoral epiphysis is detectable on radiographs and the time when it begins to fuse, respectively. The study participants were diagnosed with either CP or SMA types 1 and 2 or were typically developing. In this study, children with TD were defined as those who did not have any orthopedic medical diagnosis, gait abnormality, or delay in walking age. Children with CP were identified by the International Classification of Diseases 10th Revision Clinical Modification (ICD-10-CM) code G80, while children with SMA types 1 and 2 were identified by the ICD-10-CM code G12. All children diagnosed with SMA had their diagnosis confirmed by a genetic test. For children with TD, radiographs taken at intervals of at least 12 months were included. For children with CP and SMA, radiographs taken at intervals of at least 12 months were included up to the last preoperative radiograph in children undergoing hip surgery. Exclusion criteria consisted of previous spine or hip surgery; other concomitant neuromuscular diagnoses; children with CP classified as athetoid, hypotonic, or mixed movement disorder; and an absence of complete medical records.
Demographic data obtained from the medical records included sex and age. For children with TD, the reason for the radiograph to be ordered was verified. To be included, children with CP had to be classified as spastic. Motor function was classified by the Gross Motor Function Classification System (GMFCS), and the distribution was classified as hemiplegic (unilateral on the right or left side) or diplegic and quadriplegic (bilateral).
From the anteroposterior pelvic radiographs, angular measurements were obtained. The standard instruction at the clinic for making the anteroposterior pelvis radiograph was to have the patella pointed straight up in the supine position. The HSA is a line drawn connecting the epiphyseal growth plate of the proximal femur and measuring the angle it creates to the femoral shaft. The longitudinal femoral shaft was identified by a straight line connecting two different points located centrally at two different levels in the diaphysis of the femur 8 (Figure 1). To measure the NSA, the axis of the femoral neck was defined by a line bisecting the femoral neck through the center of the femoral head. Again, the longitudinal femoral shaft was identified by a straight line connecting two different points located centrally at two different levels in the diaphysis of the femur 9 (Figure 2). Radiographs where hip position did not show the greater trochanter in profile were excluded and not measured.
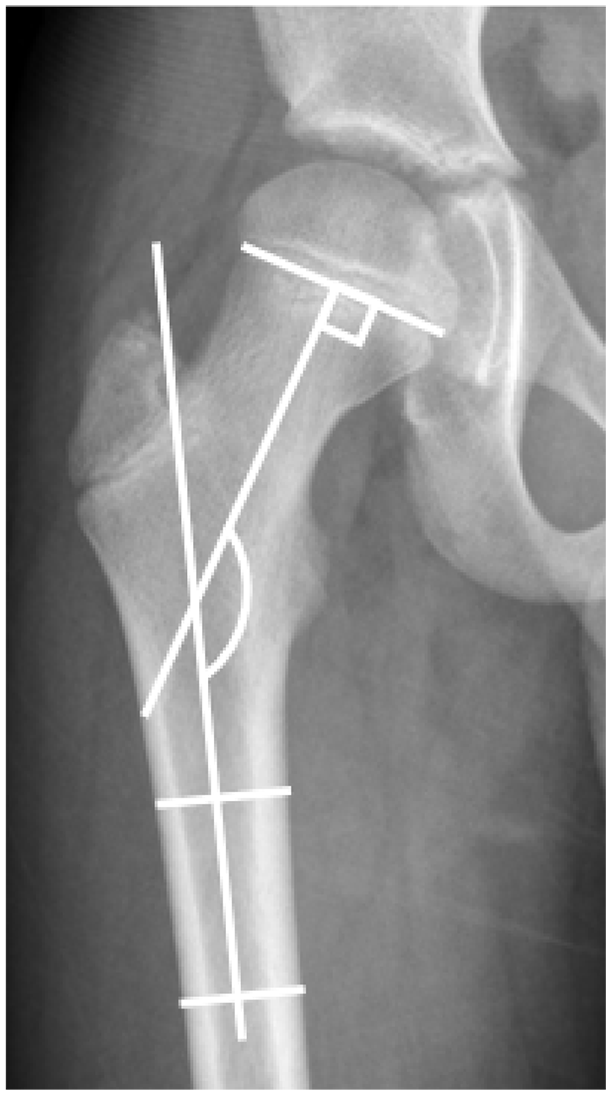
Anteroposterior radiograph of the right hip. Method of measurement of the anteroposterior head–shaft angle.

Anteroposterior radiograph of the right hip. Method of measurement of the anteroposterior neck–shaft angle.
Frequency distribution was used to summarize categorical variables, while mean, standard deviation, and range were used to summarize continuous variables. For this analysis, the children were categorized into five groups: CP at GMFCS levels I and II, CP at GMFCS level III, CP at GMFCS levels IV and V, SMA types 1 and 2, and TD. We employed the linear mixed model with Tukey’s honestly significant difference test to analyze developmental patterns of the NSA and HSA across these groups, accounting for age effects by including age as a variable in the model. We avoided dividing the sample by age to prevent potential sampling bias. The NSA and HSA data were assessed for normality using the Kolmogorov–Smirnov test. A p-value <0.05 was considered statistically significant. Data analysis was performed using IBM SPSS Statistics, version 29 for Windows (IBM Corp., Armonk, NY, USA) and the R studio software, version 2023.06.2. 10
Results
This study included 196 consecutive children from 2006 to 2022. Sixty children were diagnosed with spastic CP GMFCS levels I–V (300 hip radiographs were measured), 32 children with SMA types 1 and 2 (83 hip radiographs were measured), and 104 were children with TD (222 hip radiographs were measured). A summary of each group of children’s hip radiographs measured is shown in Table 1. Although the study criteria included infants as young as 3 months old, our study only included infants 4 months or older. The mean age of all children was 4.8 ± 4.5 years (range, 0.4–12.78 years). In all, 104 children were females, and 92 were males. The Kolmogorov–Smirnov test demonstrated normality for all measurements.
Summary of hip radiographs measured in each group of children.
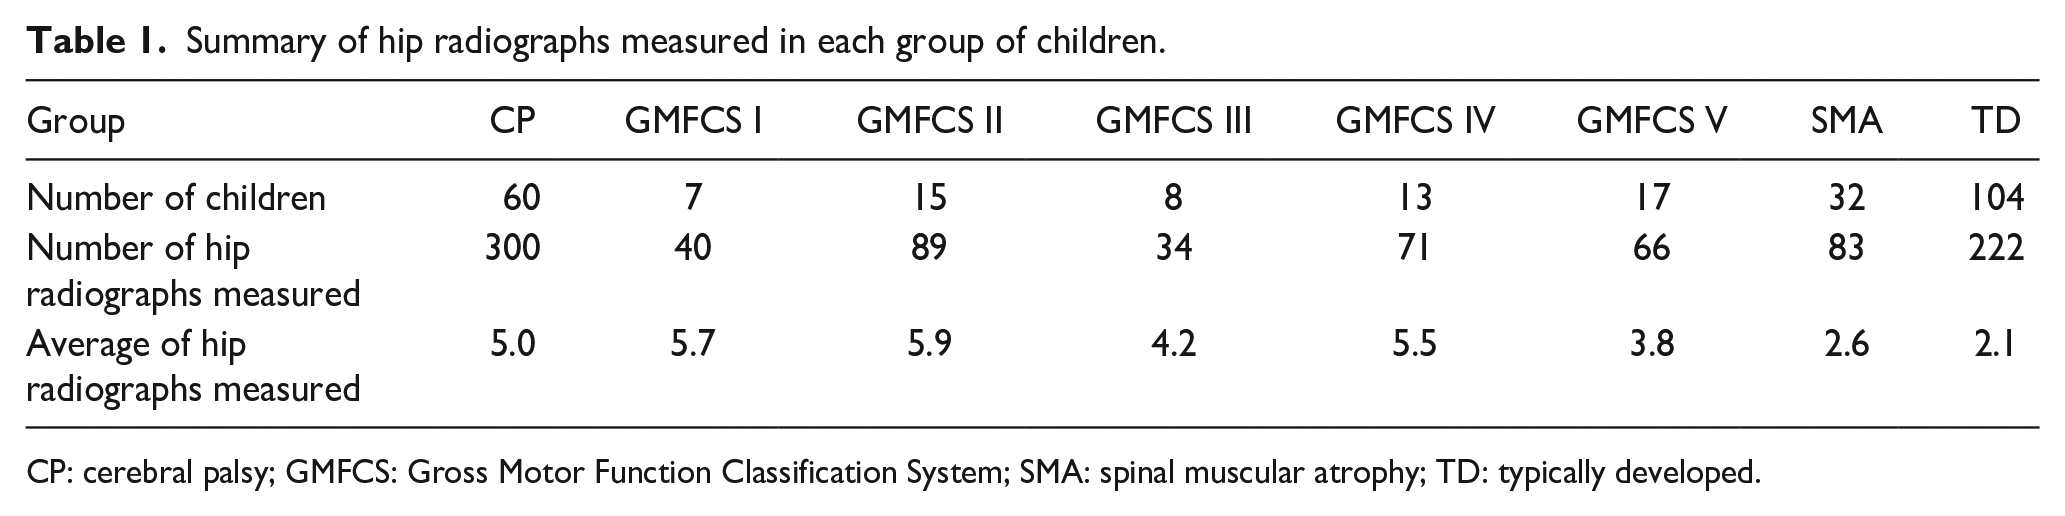
CP: cerebral palsy; GMFCS: Gross Motor Function Classification System; SMA: spinal muscular atrophy; TD: typically developed.
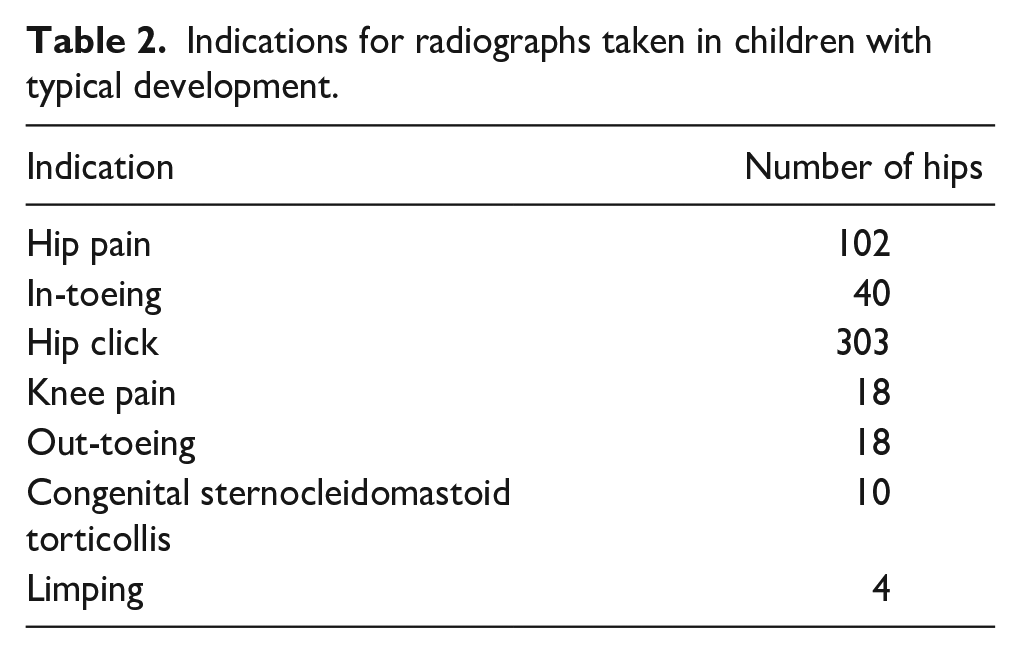
In the CP diagnosis group, seven (12%) children were classified as GMFCS level I (three diplegics, three hemiplegics right-sided, and one hemiplegic left-sided), 15 (25%) as GMFCS level II (10 diplegics, four hemiplegics right-sided, one hemiplegic left-sided), eight (13%) as GMFCS level III (eight diplegics), 13 (22%) as GMFCS level IV (two diplegics and 11 quadriplegics), and 17 (28%) as GMFCS level V (17 quadriplegics). The children with TD had multiple indications for taking the radiographs (Table 2). In the SMA type 1 and 2 group, 14 (44%) children were classified as type 1 and 18 (56%) as type 2.
Indications for radiographs taken in children with typical development.
The mean HSA was 160.0° ± 7.1° for the GMFCS levels I and II group; 63.4° ± 4.2° for the GMFCS level III group; 167.9° ± 6.8° for the GMFCS level IV and V group; 173.4° ± 7.4° for the SMA types 1 and 2 group; and 156.4° ± 5.9° for the TD group. There was a negative correlation pattern for GMFCS levels I and II and TD groups (p < 0.001) as well as considering all groups at the same time (p < 0.001). There was a positive correlation pattern for SMA types 1 and 2 and GMFCS levels IV and V (p < 0.001) and GMFCS level III groups (p < 0.001) (Figures 3 and 4).
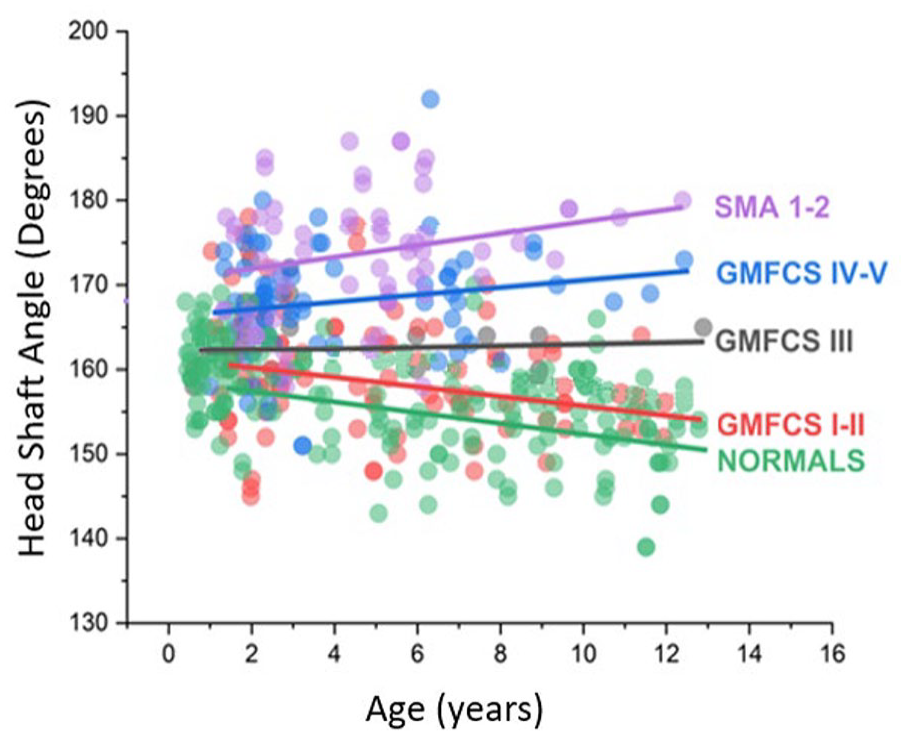
Linear mixed model presenting the head–shaft angle among the groups over time. The filled circles represent head–shaft angle measurements. The lines represent the regression line. SMA 1–2: spinal muscular atrophy types 1 and 2; GMFCS: Gross Motor Function Classification System; Typical: typical development.
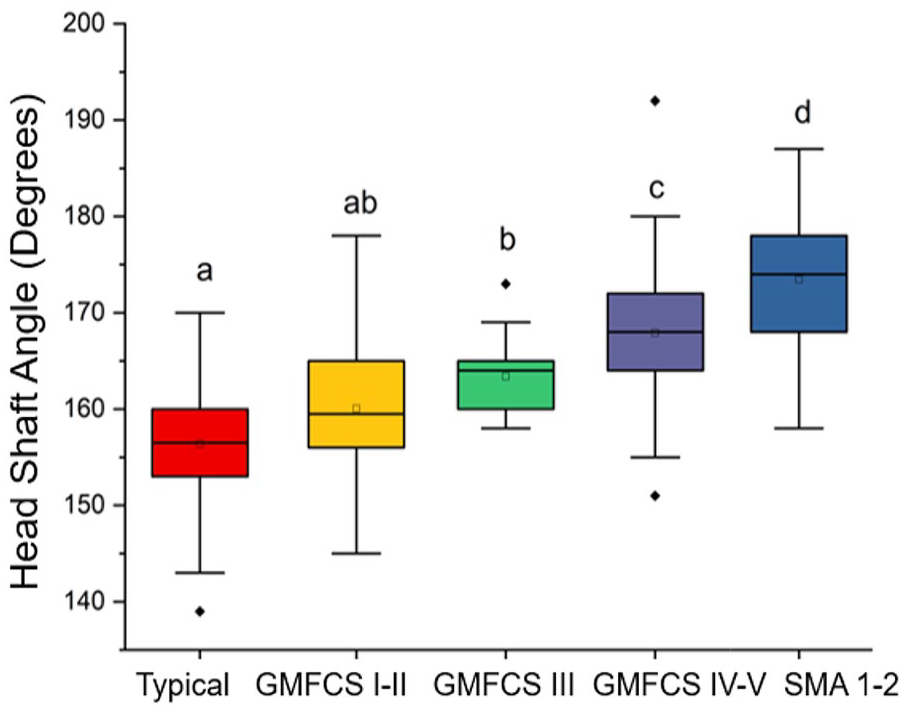
Boxplot showing the results of the linear mixed model. The letters at the top represent the result of Tukey’s post hoc and indicate statistically significant differences at a significance level of p < 0.05. GMFCS: Gross Motor Functional Classification System; SMA: spinal muscular atrophy; Typical: typical development.
The mean NSA was 143.7° ± 7.4° for the GMFCS levels I and II group; 153.1° ± 4.3° for the GMFCS level III group; 156.4° ± 5.6° for the GMFCS levels IV and V group; 161.9° ± 9.7° for the SMA types 1 and 2 group; and 138.6° ± 7.0° for the TD group. There was a negative correlation pattern for GMFCS levels I and II and TD groups (p < 0.001), as well as considering all groups at the same time (p < 0.001). There was a positive correlation pattern for SMA types 1 and 2 and GMFCS levels IV and V groups (p < 0.001) as well as the GMFCS level III group (p < 0.001) (Figures 5 and 6).
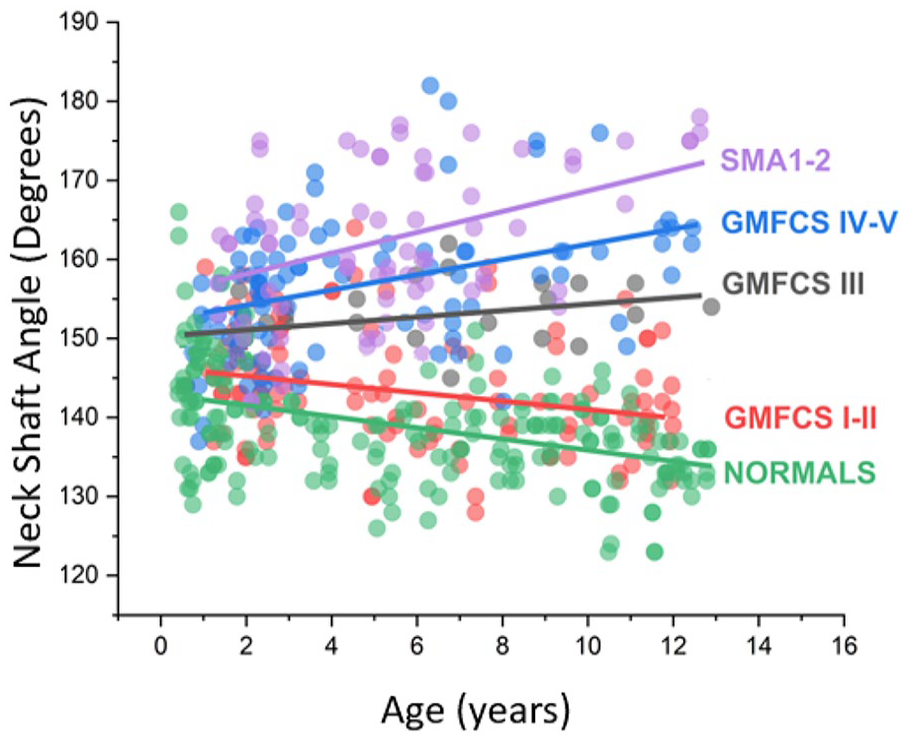
Linear mixed model presenting the neck–shaft angle among the groups over time. The filled circles represent neck–shaft angle measurements. The lines represent the regression line. GMFCS: Gross Motor Function Classification System; SMA 1–2: spinal muscular atrophy types 1 and 2; Typical: typical development.
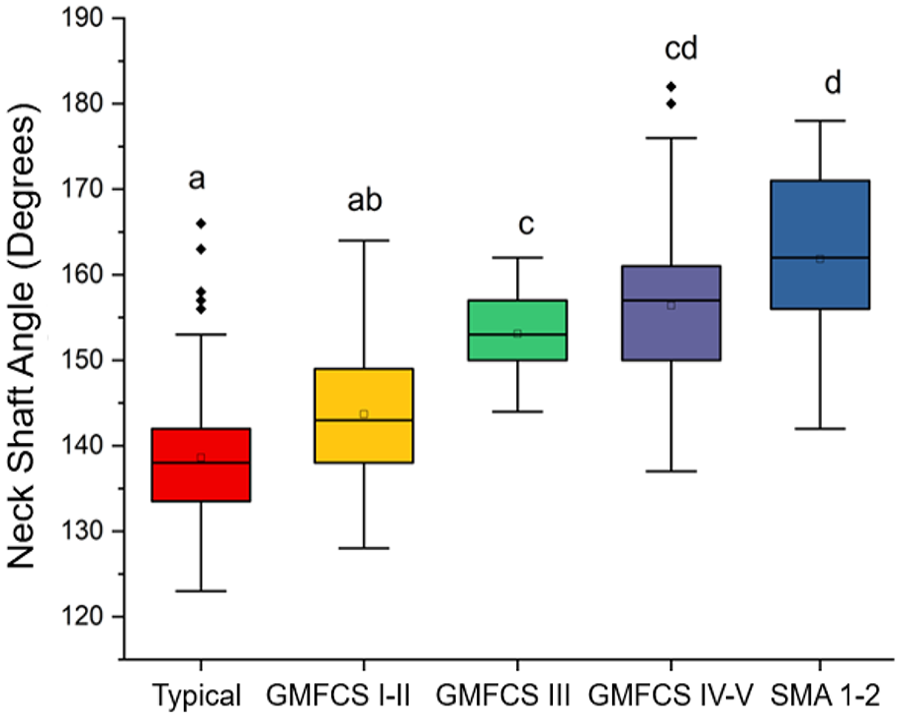
Boxplot showing the results of the linear mixed model. The letters at the top represent the result of Tukey’s post hoc. Different letters indicate statistically significant differences at a significance level of p < 0.05. GMFCS: Gross Motor Functional Classification System; SMA: spinal muscular atrophy; Typical: typical development.
The linear mixed model used for the HSA revealed that the strongest coefficient of correlation was observed for the SMA types 1 and 2 group (r = 0.65, p < 0.001), indicating the highest coefficient of determination (R2 = 0.42, p < 0.001). When all groups were examined together, the R2 value was small, and the pattern was negative (r = −0.24, p = 0.020), which confirms the suitability of the linear mixed model for this study (Table 3). When analyzing the NSA, the linear mixed model revealed that the strongest coefficient of correlation was observed for the GMFCS levels IV and V group (r = 0.63, p < 0.001), indicating the highest coefficient of determination (R2 = 0.40, p < 0.001). When all groups were examined together, the R2 value was small, and the pattern was negative (r = −0.10, p = 0.020), which confirms the suitability of the linear mixed model for this study (Table 4).
Values of correlation coefficients for the head–shaft angle.
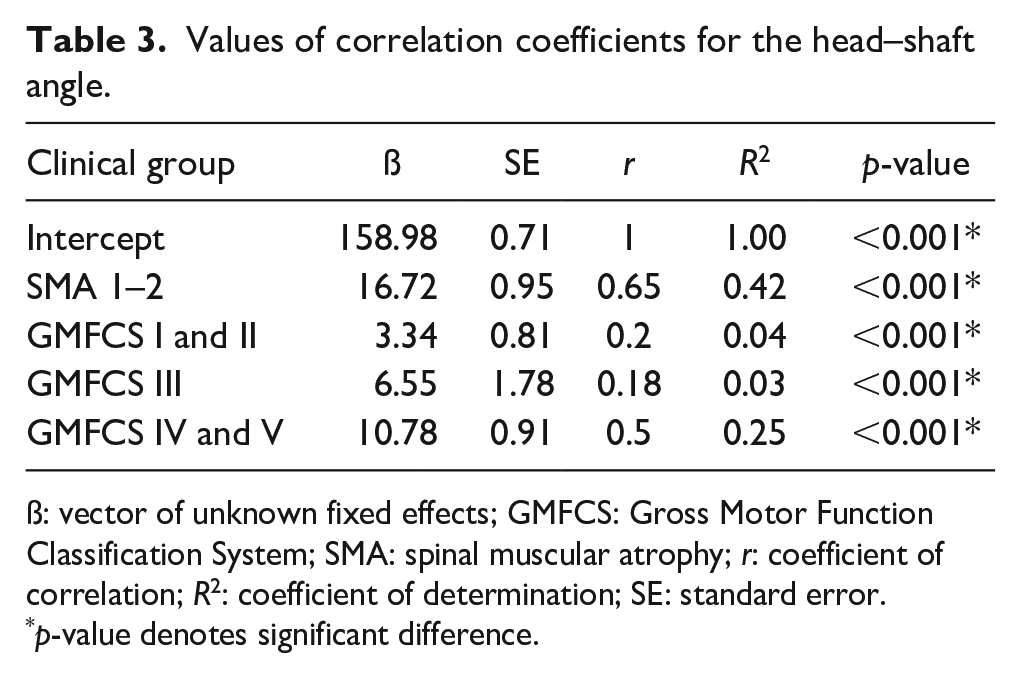
ß: vector of unknown fixed effects; GMFCS: Gross Motor Function Classification System; SMA: spinal muscular atrophy; r: coefficient of correlation; R2: coefficient of determination; SE: standard error.
p-value denotes significant difference.
Values of correlation coefficients for the neck–shaft angle.
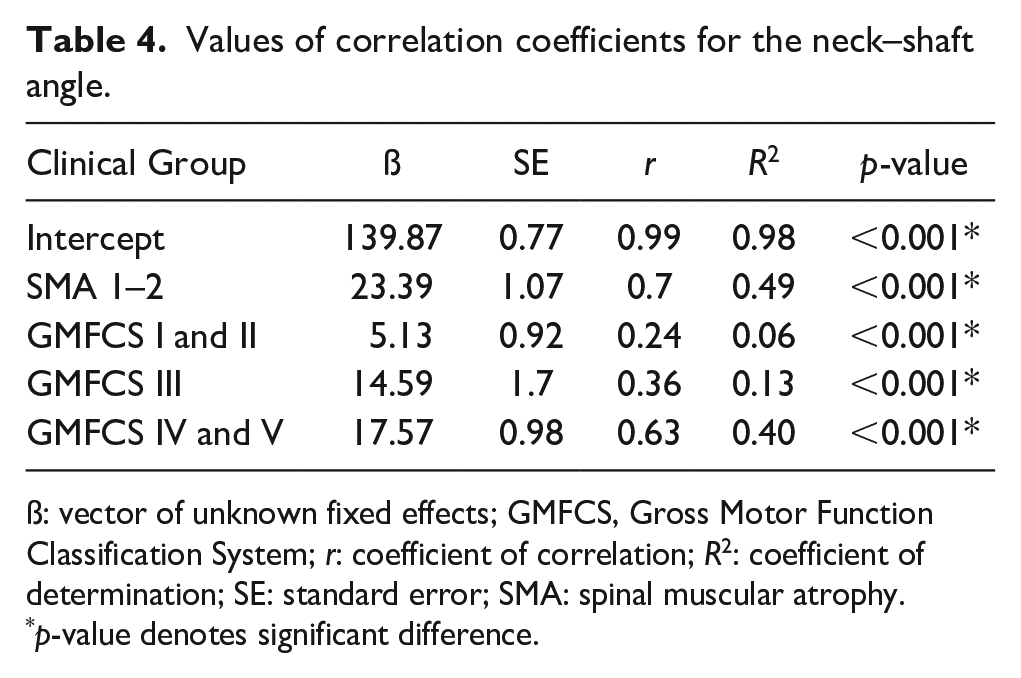
ß: vector of unknown fixed effects; GMFCS, Gross Motor Function Classification System; r: coefficient of correlation; R2: coefficient of determination; SE: standard error; SMA: spinal muscular atrophy.
p-value denotes significant difference.
Discussion
Hip displacement and dislocation have historically been linked to muscle imbalance across the hip joint and spasticity in the hip adductors and flexors. 11 In recent years, the emphasis has shifted to include the role of abnormal proximal femoral geometry. Children with CP and SMA have different underlying causes. CP is the result of brain injury affecting muscle control, 12 while SMA is a genetic disorder of the anterior horn motor neuron. 13 However, the secondary effects of these conditions on hip development can be similar, potentially leading to coxa valga. NSA and HSA increase progressively as impairment levels increase from GMFCS levels I–V. 5 However, in children with low tone, the prevalence of hip dislocation is the same as for children with high tone. 3 We measured the NSA and HSA as close to birth as possible to address the gap in the existing literature. This provided a better understanding of these angles in both high-tone and low-tone groups and clarified how these angles progress over time in those groups.
A fundamental question is whether increased NSA and HSA are primary responses to gait limitations, which create abnormal hip joint reaction force vectors and magnitudes, or a secondary response to spastic contractures of the hip adductors and flexors. 11 Ulusaloglu et al. 3 compared proximal femoral and acetabular geometry in nonambulatory children with spastic CP GMFCS level IV and GMFCS level V to nonambulatory children with SMA types 1 and 2. They reported an earlier onset of hip dislocation in the SMA types 1 and 2 group, with similar radiographic features in children with CP GMFCS levels IV and V and children with SMA types 1 and 2, despite CP being characterized by high tone and SMA by low tone. 3 We found that NSA and HSA were not significantly different between children with CP GMFCS levels IV and V and SMA types 1 and 2 groups, although the SMA group trended higher. These findings suggest that abnormal hip joint reaction force magnitude and too high and too low abnormal force vectors contribute to hip dysplasia, which is a more complex effect than just adductor spasticity.3,11
For both CP GMFCS levels IV and V and SMA types 1 and 2 groups, we found a persistent coxa valga that did not significantly decrease with increasing childhood age. Ulusaloglu et al. 3 found that both children with CP GMFCS levels IV and V and children with SMA types 1 and 2 show consistent persistence in increased HSA, which does not significantly decrease throughout the age intervals up to 8 years.
On the other hand, List et al. 14 discovered that HSA was high and remained unchanged over similar age intervals for GMFCS levels IV and V. The authors attributed the imbalance between hip adductors and abductors, along with associated physeal realignment, to be responsible for their findings. When List et al. 14 compared children with TD and children with CP, they found that there was a significant decrease in HSA over time in children with TD compared with age-matched children with CP. However, HSA in GMFCS levels I–III decreased significantly over time, although to a lesser extent than for typically developing children. Terjesen et al. 15 reported persistently high and unchanged HSA for GMFCS levels IV and V but significant decreases over time for GMFCS level III under the age of 5 years. In the current study, we added the low-tone children with SMA types 1 and 2 group and found that they also had a progressive increase in HSA and NSA angle with age, indicating that muscle tone is not a primary etiology; rather other activities such as the ability to ambulate, which greatly impacts the hip joint reaction force vector and magnitude, are more significant. This is consistent with the finding that children with high-tone GMFCS levels I–III align more closely to children with TD compared with either the high-tone GMFCS levels IV and V or SMA type 1 and 2 groups (Figures 3 and 5). These findings support the role of proximal femoral guided growth as a good alternative to bone surgery since the procedure does not interfere with muscle tone, but may provide progressive change in the proximal femoral geometry; however, it does not fundamentally alter the hip joint reaction force.
In our study, the knee radiographs were taken with the knees facing forward. However, due to the complexity of the proximal femoral geometry, the true NSA can only be accurately measured when the hip is internally rotated to the same degree as the femoral anteversion. 5 As the femoral anteversion increases, the apparent NSA becomes larger than the true angle, leading to increased measurement error. 16 Nevertheless, the NSA is an important parameter for assessing the proximal femur, especially for performing osteotomies. Hence, we included NSA in our analysis to compare low lone, high tone, and typically developing children, facilitating comparison with other studies. By examining NSA across different groups, we can identify patterns and differences specific to muscle tone and development status, providing a more comprehensive understanding of hip deformities. Moreover, to minimize the influence of anteversion on NSA, we also measured the HSA, which is an effective way to assess the coxa valga deformity.
The use of linear mixed models in orthopedic literature has been gaining popularity over the traditional analysis of variance statistics analysis (ANOVA). Linear fixed models offer higher statistical power and a more intuitive interpretation of results. One of the major advantages of linear mixed models is the ability to handle datasets with missing values effectively. In contrast with ANOVA, which excludes the entire case if a missing value is present, resulting in lower statistical power, linear mixed models can accommodate missing data without compromising the integrity of the analysis. 17 However, we need to mention that linear mixed models yielded strikingly more false positives than ANOVA in a simulation study by Hesselmann for massively unbalanced within-participant datasets when a previously unknown grouping factor remained unaccounted for. 18
Our data were collected retrospectively; therefore, misclassification bias or selection bias are possibilities. Since our study period included all consecutive cases of 196 children who met our inclusion criteria, a record missing error was minimized. A selection bias error is possible in that the children, family, and surgeon determined treatment, and children who had reconstructive hip surgery were excluded from this assessment. The study was not based on a representative sample, and the number of patients in some groups was relatively small, which may limit the reliability and generalizability of the findings.
Conclusion
As children grow, NSA and HSA tend to decrease in TD and GMFCS levels I and II groups. However, in nonambulatory children classified in low-tone groups (SMA types 1 and 2) and high-tone groups (GMFCS levels IV and V), NSA and HSA tend to increase with age, demonstrating that the proximal femoral shape is very sensitive to the impacts of normal hip joint reaction force produced by normal early walking. As proximal femoral-guided growth has the potential to dynamically correct proximal deformities during growth, this technique may help reduce the HSA and NSA, which tend to increase with age in both low- and high-tone groups.
Supplemental Material
sj-pdf-1-cho-10.1177_18632521241277023 – Supplemental material for Femoral neck–shaft angle changes based on the severity of neurologic impairment in children with cerebral palsy and spinal muscular atrophy
Supplemental material, sj-pdf-1-cho-10.1177_18632521241277023 for Femoral neck–shaft angle changes based on the severity of neurologic impairment in children with cerebral palsy and spinal muscular atrophy by Luiz Carlos Almeida da Silva, Yusuke Hori, Burak Kaymaz, Kenneth J Rogers, Arianna Trionfo, James Richard Bowen, Jason J Howard, Michael Wade Shrader and Freeman Miller in Journal of Children’s Orthopaedics
Footnotes
Author contributions
L.C.A.D.S. Conception or design of the work; acquisition, analysis, or interpretation of data for the work; drafting the work; revising the work critically for important intellectual content; final approval of the version to be published; agreement to be accountable for all aspects of the work in ensuring that questions related to the accuracy or integrity of any part of the work are appropriately investigated and resolved; Y.H. Conception or design of the work; acquisition, analysis, or interpretation of data for the work; drafting the work; revising the work critically for important intellectual content; final approval of the version to be published; agreement to be accountable for all aspects of the work in ensuring that questions related to the accuracy or integrity of any part of the work are appropriately investigated and resolved; B.K. Conception or design of the work; acquisition, analysis, or interpretation of data for the work; drafting the work; revising the work critically for important intellectual content; final approval of the version to be published; agreement to be accountable for all aspects of the work in ensuring that questions related to the accuracy or integrity of any part of the work are appropriately investigated and resolved; K.J.R. Conception or design of the work; drafting the work; revising the work critically for important intellectual content; final approval of the version to be published; agreement to be accountable for all aspects of the work in ensuring that questions related to the accuracy or integrity of any part of the work are appropriately investigated and resolved; A.T. Conception or design of the work; drafting the work; revising the work critically for important intellectual content; final approval of the version to be published; agreement to be accountable for all aspects of the work in ensuring that questions related to the accuracy or integrity of any part of the work are appropriately investigated and resolved; J.R.B. Conception or design of the work; drafting the work; revising the work critically for important intellectual content; final approval of the version to be published; agreement to be accountable for all aspects of the work in ensuring that questions related to the accuracy or integrity of any part of the work are appropriately investigated and resolved; J.J.H. Conception or design of the work; drafting the work; revising the work critically for important intellectual content; final approval of the version to be published; agreement to be accountable for all aspects of the work in ensuring that questions related to the accuracy or integrity of any part of the work are appropriately investigated and resolved; M.W.S. Conception or design of the work; drafting the work; revising the work critically for important intellectual content; final approval of the version to be published; agreement to be accountable for all aspects of the work in ensuring that questions related to the accuracy or integrity of any part of the work are appropriately investigated and resolved; F.M. Conception or design of the work; acquisition, analysis, or interpretation of data for the work; drafting the work; revising the work critically for important intellectual content; final approval of the version to be published; agreement to be accountable for all aspects of the work in ensuring that questions related to the accuracy or integrity of any part of the work are appropriately investigated and resolved.
Availability of data and material
Data are available upon reasonable request.
Code availability
None.
Declaration of conflicting interests
The author(s) declared no potential conflicts of interest with respect to the research, authorship, and/or publication of this article.
Funding
The author(s) received no financial support for the research, authorship, and/or publication of this article.
Ethical statement
This study was conducted in accordance with the Declaration of Helsinki and was approved by the Nemours Institutional Review Board (approval no. 1936699), with the need for written informed consent waived.
Supplemental material
Supplemental material for this article is available online.
References
Supplementary Material
Please find the following supplemental material available below.
For Open Access articles published under a Creative Commons License, all supplemental material carries the same license as the article it is associated with.
For non-Open Access articles published, all supplemental material carries a non-exclusive license, and permission requests for re-use of supplemental material or any part of supplemental material shall be sent directly to the copyright owner as specified in the copyright notice associated with the article.