
Abstract
A covalent functionalization approach was utilized for the preparation of highly dispersed pentaethylene glycol-thermally treated graphene-water as the absorbing material inside a flat-plate solar collector. Four mass fractions of nanofluids were prepared (0.025, 0.05, 0.075, and 0.1 wt% pentaethylene glycol-thermally treated graphene-water). Graphene nanoparticles were characterized by energy dispersive X-ray analysis with a scanning electron microscope. Measurements of the thermophysical properties were subsequently carried out for the nanosuspensions. The raw investigation data were collected from an indoor flat-plate solar collector test setup. The experimental procedure included different sets of variables such as input temperatures of 303, 313, and 323 K; fluid mass flow rate of 0.00833, 0.01667, and 0.025 kg s−1; and heat flow density of 500, 750, and 1000 W m−2. The thermophysical tests of pentaethylene glycol-thermally treated graphene-water nanofluids showed a proportional increase against weight concentrations, while the specific heat power was reduced. The tests showed an increment in energy efficiency by increasing the fluid mass flow rate and heat input. By comparison, the thermal efficiency decreased with the increasing temperature of the fluid supply. Relative to the base fluid, the energy efficiency of pentaethylene glycol-thermally treated graphene/water-based flat-plate solar collector increased to 10.6%, 11%, and 13.1% at the three fluid mass flow rates. In conclusion, an exponential form was used to derive the thermal effectiveness of flat-plate solar collector based on the experimental data.
Keywords
Nomenclature

Introduction
One of the versatile solar conversion devices for residential and industrial applications is the thermal active surface (solar collector). The solar collector absorbs and converts solar energy to heat in a suitable base fluid, for example, ethylene glycol, oil, or water (H2O). 1 –3 The flat-plate solar collector (FPSC) device consists of an absorber plate that can be made of copper (Cu) or aluminum (Au) materials and coated with a specific surface coating to increase the absorption of radiation. The header and riser pipelines are entirely connected on the outside of the absorber sheet to ensure the heat transfer fluid is appropriately circulated. A transparent sheet of glass is often used to reduce heat loss by radiation and convection. The concern about solar collectors is not only their reduced overall energy efficiency but also the limited convective heat transfer propensity of the absorbent plate and the absorbing medium. 4,5
One of the innovative ways to increase the performance of flat-plate collectors is to use nanofluids as working fluids, 6 –11 rather than conventional liquids. Initially, Choi and Eastman 12 suggested the use of nanofluid, defined as a colloidal mixture of solid nanoparticles (<100 nm) suspended in classical fluids. They have excellent thermophysical properties, providing an efficient heat transfer cycle, as well as more effective heat absorption compared with conventional liquids. 13 –17 Several metal nanomaterials, such as Cu, Al, and silver, 18 –20 along with various forms of metal oxides, such as copper oxide, aluminum oxide (Al2O3), iron oxide, and magnesium oxide, were used as additives for working fluids inside FPSCs. 21 Due to its extreme thermal conductivity, moderate density, and low preparation cost, Al2O3-H2O nanofluid is the most commonly used medium among other metallic oxides-based nanofluids in the FPSC. Sundar et al. 22 had explored the effect of using Al2O3 nanofluids under a turbulent flow regime in a flat-plate collector. They measured two concentrations of nanofluid in distilled water (DW): 0.1 and 0.3 wt% of 20 nm Al2O3-NPs. The twisted taped FPSC was measured at three distinct pitch ratios (H/D) of 5, 10, and 15. Also, the FPSC without the twisted tapes was tested. Their results showed that the efficiency of the FPSC with a twisted tape of H/D = 5 was improved by 18% compared to the FPSC with H2O as a heat transfer fluid, for nanoparticles content of 0.3 wt% and a flow rate of 5 kg min−1.
Specific samples of crystallized semiconductor oxide nanomaterials have been used as heat exchange fluids in FPSCs, such as titanium dioxide, cerium dioxide, and tungsten trioxide. 23 –25 Despite its poor thermal conductivity, silicon dioxide (SiO2) was also used by many researchers as a H2O-dependent nanofluid in FPSCs. Noghrehabadi et al. 26 used 1 wt% SiO2-H2O to investigate the laminar and turbulent flows within a square-type solar thermal system. The thermal performance of FPSC was found to increase at the specified flow rates of 0.5 kg min−1 and 2.8 kg min−1 by 1% and 2.5%, respectively.
Allotropes of carbon such as single-walled carbon nanotubes (SWCNTs), multi-walled carbon nanotubes (MWCNTs), graphene nanoplatelets (GrNPs), graphene oxide (GO), and graphene (Gr) have recently been tested as absorbing mediums rather than industrial samples inside the FPSCs. 27 –30 Said et al. 27,31 studied the theoretical and experimental effect of using SWCNT-H2O nanofluid on heat transport, pressure loss, and exergy performance of the solar collector. Their tests revealed that when loading 3 wt% SWCNT-H2O at a flow rate of 0.5 kg min−1, the energy and exergy performance of the system reached approximately 95% and 26.25%, respectively. Yousefi et al. 32 experimentally analyzed the effectiveness implications of using MWCNT-H2O inside a solar collector. The solar energy efficiency was found to be increased at a mass flow rate of 2 kg min−1 by 28.6% for 0.2 wt% MWCNT-H2O. The experimental effects of application GrNPs-H2O nanofluid on the FPSC performance were studied by Vakili et al. 28 The study found energy efficiency improvements of up to 13.5%, 19.7%, and 23.2% for 0.0005%, 0.001%, and 0.005% of GrNPs-nanofluid mass fractions, respectively, at a flow rate of 0.9 kg min−1. Ahmadi et al. 33 evaluated the effect of Gr-H2O nanofluids on the efficiency of the FPSC theoretically and experimentally. Their conclusions exhibited that the collector energy performance was enhanced by 18.9% with 0.02 wt% Gr-H2O at 0.9 kg min−1. In recent research, Akram et al. 34 explored the implications of Clove-treated graphene nanoplatelet (CGNP)-H2O for enhancing the efficacy of the FPSC. Experimental results indicated that the peak energy efficiency was obtained by using 0.1 wt% CGNP-H2O nanofluid in the solar collector with a flow rate of 0.0260 kg s−1ċm−2, which was about 18.2% higher than H2O as working fluid for the same conditions.
Further work is required to understand the carbon-based nanofluids within the solar collector as the absorption mediums. The investigations were performed using different operating conditions such as; the working fluids were DW and aqueous nanofluids with specific mass percentages. The working fluids flowed to the FPSC system under different operating conditions such as different inlet temperatures, heat flow densities, and fluid mass flow rates. A regression model was developed based on the collected data to estimate the thermal efficiency of FPSC.
Materials and methods
Synthesis of PEG-TGr-H2O nanofluids
The pristine Gr in few-layer nanoparticles was supplied from the company VCN Co., Ltd, Bushehr, Iran. for nanomaterials. Different chemicals such as pentaethylene glycol (PEG; average Mn of 250, purity 90%), aluminum chloride, hydrochloric acid, N,N-dimethylformamide, and tetrahydrofuran were locally sourced from Sigma-Aldrich (M) Sdn. Bhd, Selangor, Malaysia. The standard protocol for experimentation is schematically shown in Figure 1. The current study followed the same chemical reactions with some changes to synthesize the nanomaterials as in the previous study. 35 A precision balance (OHAUS PA214) was used to measure the accurate weight of nanoparticles. An ultrasonication probe (Vibra-Cell, Sonics, VC 750) was used for dispersing the nanomaterial in the base fluid and also for preparing the covalently functionalized PEG-thermally treated graphene (PEG-TGr).
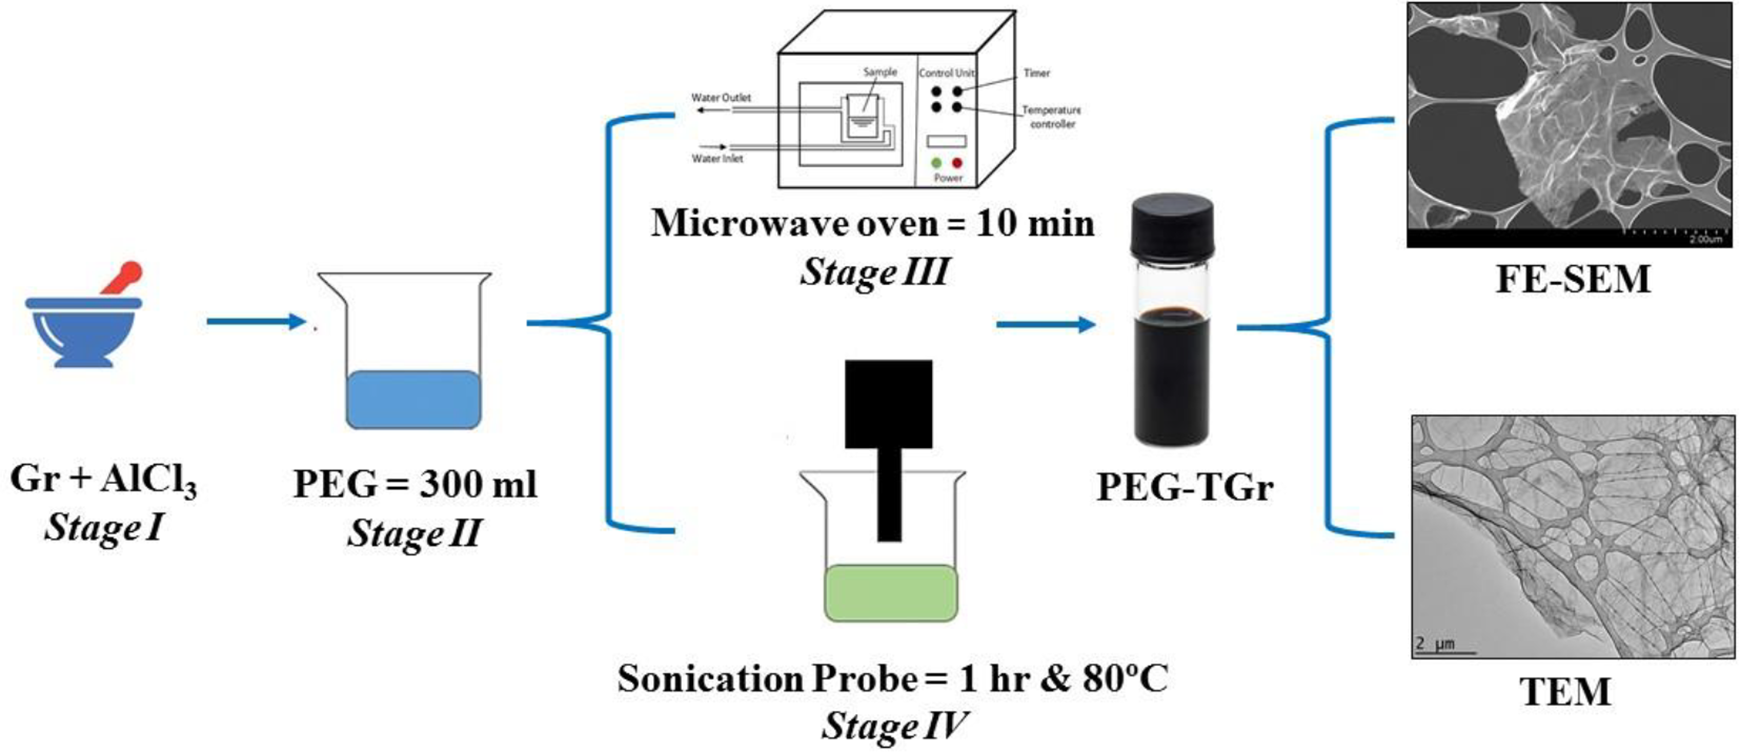
Schematic illustration of the acid treatment for PEG-TGr. PEG-TGr: pentaethylene glycol-thermally treated graphene.
Experimental system
The experimental configuration for evaluating the energy efficiency of the indoor FPSC based Gr nanofluids is shown in Figure 2. The test rig setup included a flat-plate collector, control and measurement equipment, cooled H2O bath, flow piping loop, and a data logger. For the movement of the working fluid, a motorized centrifugal pump was used in the forced convection system. Table 1 gives detailed specifications for the portion of the collector used in this research. The Cu absorber plate was soldered directly through the Cu riser tubing contact length (Figure 3). Isowool ceramic fiber (thermal conductivity of 0.07 W m−1ċK−1 at 400°C) was used underneath the absorber plate as a high-temperature insulating sheet. The versatile adhesive heater was connected to an adjustable voltage transformer to supply the heating system with the equivalent constant heat flux. Super-fast-response self-adhesive thermocouples (T-type, model: SA1XL-T-72, Omega, USA, Omega Engineering Inc., Norwalk, Connecticut) were used to test the surface temperature of the riser tubes used in this work and the absorber plate. The 12 calibrated thermocouples were axially mounted in four separate locations along the absorber plate surface and two riser tubes. Besides, two resistance thermometers (resistance temperature detectors (RTDs); type PT100, Omega, USA) were installed at the intake and exhaust pipes to control the absorbing medium’s bulk temperatures. To analyze and monitor the experimental data, an 18-channel Ecolog paperless recorder system (EC18, Kuala Lumpur, MALAYSIA.) has facilitated the connection of thermocouples and RTDs with a data logger.
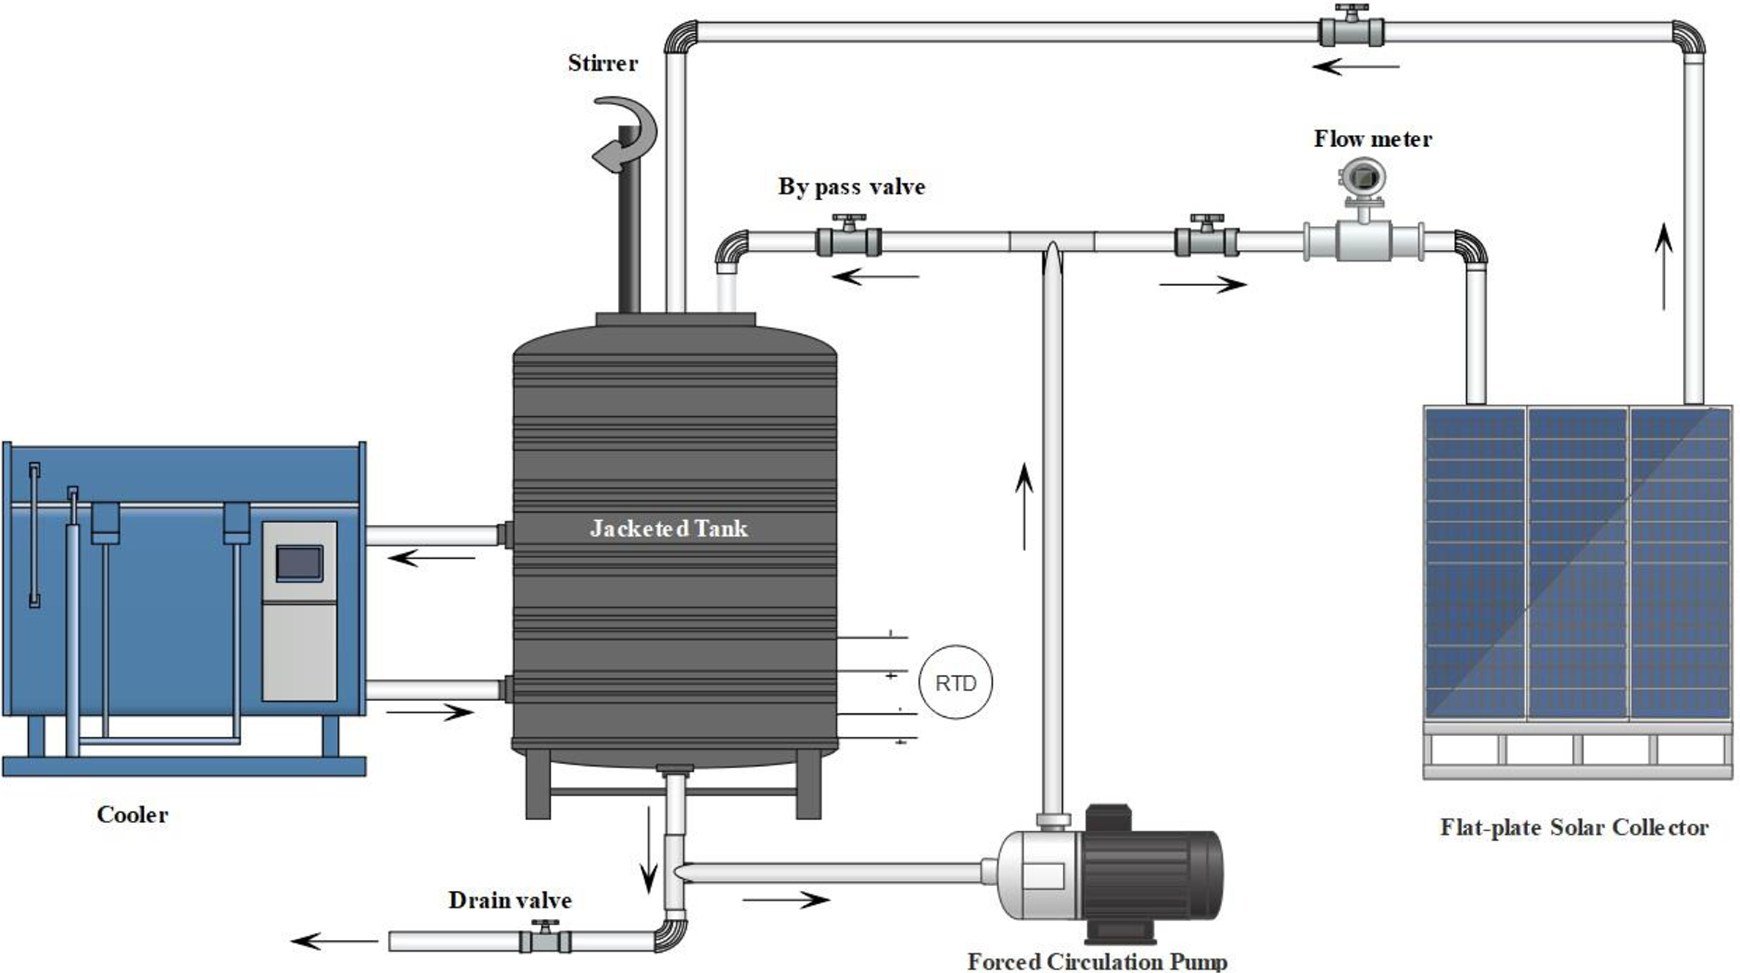
The schematic diagram of the thermal flat-plate collector setup.
Technical specifications of the FPSC.

Cu: copper; FPSC: flat-plate solar collector.

The main components of a FPSC. FPSC: flat-plate solar collector.
Data processing and errors analysis
The useful energy (Q u) can be determined from the equation accordingly 36

where,
A further illustration of the useful energy amount is given based on the distinction between the energy absorbed, and heat loss of the system is shown below 36

Therefore, F R, A c, G T, τα, and U L refer to heat loss coefficient, the collector aperture area, global solar irradiation, transmittance-absorptance product, and collector heat loss coefficient related to aperture area, respectively. However T i − T a denotes the difference between the nanofluid input/room temperatures and η c is solar collector thermal efficiency that is generally referred to the Hottel–Whillier–Bliss equation, which is expressed as 36


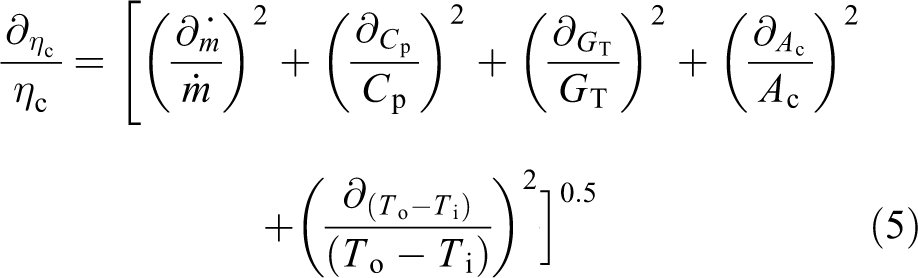
Consequently, the uncertainty in the value of FPSC efficiency calculated from the experimental data can be determined using the following relation 33
Ranges and accuracies of instruments and fluid properties were shown in Table 2. The total uncertainty in the overall efficiency of the process is approximately 3.37% after the measurement procedure.
List of ranges and accuracies for instruments and fluid properties.
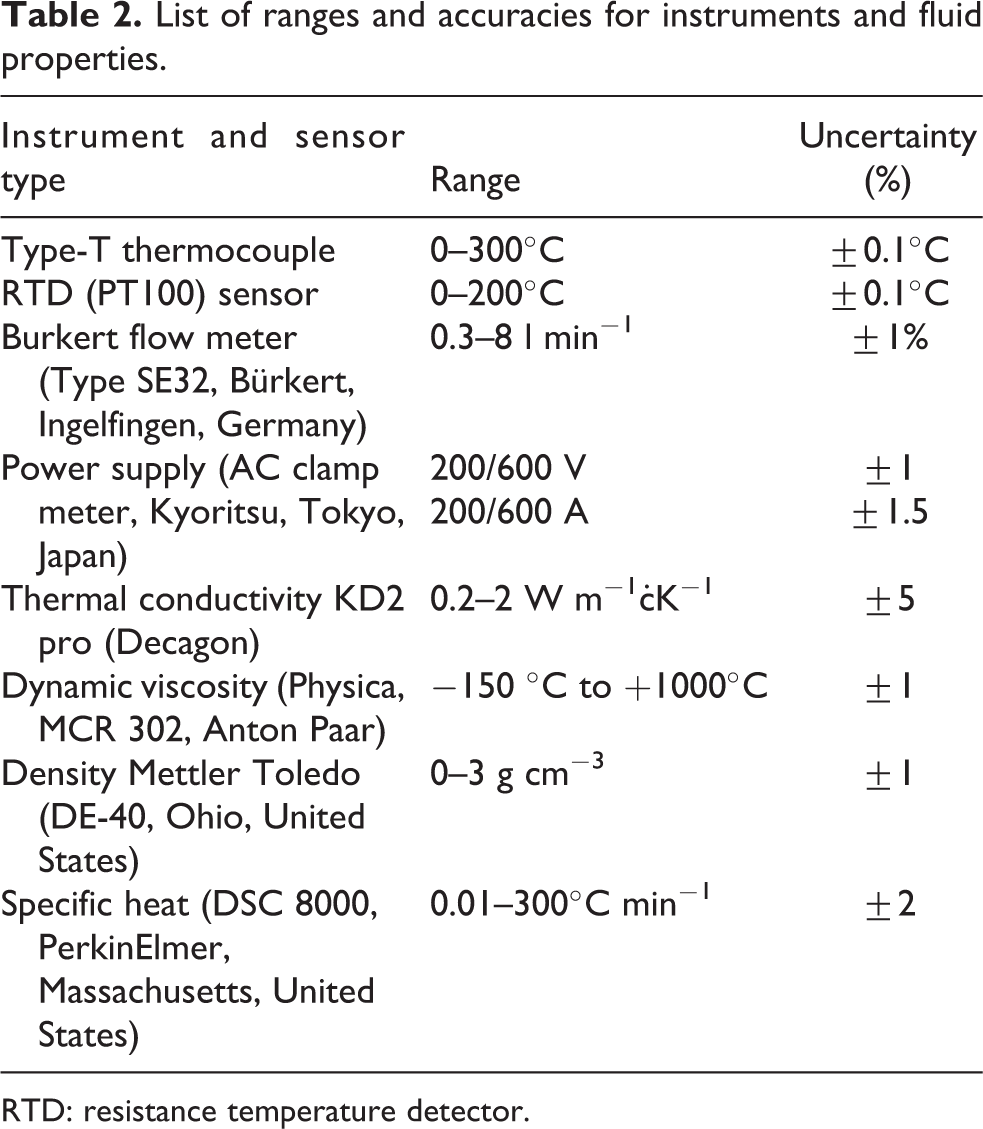
RTD: resistance temperature detector.
Thermophysical and characterization properties
The thermal conductivities of nanofluids and base fluid samples were calculated using a thermal analyzer (model: KD2 Pro, Decagon, Pullman, WA, USA). An average of 16 readings was obtained over 4 h for each temperature setting to determine the dispersal stability of the nanofluids. The MCR 302 Rheometer (Anton Paar, Austria) was employed for testing the dynamic viscosity of H2O and PEG-TGr-H2O nanofluids. Density meter Easy-D40, Mettler Toledo, Ohio, United States. was utilized for the density measurements of liquid samples with an accuracy of ±10−4 g cm−3. For accuracy and reliability considerations, measures were taken at least three times per sample at each temperature. DSC 8000-PerkinElmer estimated the fluids specific heat with an accuracy of ±1.0%. Scanning electron microscope (SEM, Tescan VEGA3, Czechia) was utilized for the morphology and elemental study of functionalized synthesized powders.
Results and discussion
Morphological and thermophysical properties
A visual analysis of GrNPs surface using SEM to the identification of contaminants or unknown particles, the cause of failure and interactions between materials is shown in Figure 4(a) and (b). In addition to surface evaluation, SEM analysis is utilized for particle characterization. The high magnification, high-resolution imaging of our SEM analysis supports the determination of the number, size, and morphology of Gr particles. The surfactant-stabilized nanofluids were deposited on a silicon (Si) wafer to obtain the SEM micrographs and distributions. Also, Figure 4 shows that nanoparticles do not have an agglomeration, so they have appeared in an aggregation mechanism and are well distributed. SEM micrographs also reveal that the covalent synthesizing of Gr allows the wrinkled structures actively. Energy-dispersive X-ray spectroscopy (EDX) provides further understanding of the surface of Gr during the SEM analysis process. EDX analysis is used to acquire the elemental composition of a sample and allows for a more quantitative result than that provided by only SEM analysis. The combination of SEM and EDX analysis offers chemical composition and elemental investigation—providing a comprehensive metallurgical evaluation. The spectrum study of GrNPs with EDX is shown in Figure 4(c) and (d). The EDX measurements show five elements, such as carbon, oxygen, Si, sulfur (S), and zirconium (Zr). GrNPs show a carbon content of 92.97% and an atomic oxygen content of 6.89%. While the atomic content of Si, S, and Zr is 0.09%, 0.02% and 0.03%, respectively.

SEM and EDX mapping analysis of the Gr nanoparticles: (a) SEM microimage, (b) electron image of spectrum 15, (c) EDX mapping analysis, and (d) EDX elemental analysis. SEM: scanning electron microscopy; EDX: energy-dispersive X-ray spectroscopy; Gr: graphene.
The measured values of viscosity are plotted in Figure 5 as a function of shear rate for H2O-based PEG-TGr nanofluids at different temperatures and weight concentrations. From the figure, it was observed that viscosity increases as weight concentration increases and decreases as temperature increases. Furthermore, it can also be found that the behavior of H2O-based PEG-TGr nanofluids was quite Newtonian with almost constant viscosity with different values of shear rate. Figure 6 presents the results of thermal conductivity, dynamic viscosity, density, and specific heat capacity for base H2O and PEG-TGr-nanofluids. 37 –39 Measurements of thermophysical properties were performed at different temperatures testing of 303, 313, and 323 K. The data collected showed that the density, dynamic viscosity, and thermal conductivity were improved by increasing the nanoparticles mass percentage in the DW, but the specific heat capacity was reduced. The maximum thermal conductivity increase value was 30.48% compared with H2O at 323 K. Whereas an increase in viscosity of 27.53% was observed at a temperature of 303 K for the 0.1 wt% PEG-TGr-NPs. Just 0.1% was the most significant increase in density measurements. The real heat nanofluids, however, dropped by 2.9% at 0.1 wt% PEG-TGr-NPs.

The measured values of dynamic viscosity against shear rate for PEG-TGr nanofluids at different temperatures and mass fractions. 37 PEG-TGr: pentaethylene glycol-thermally treated graphene.
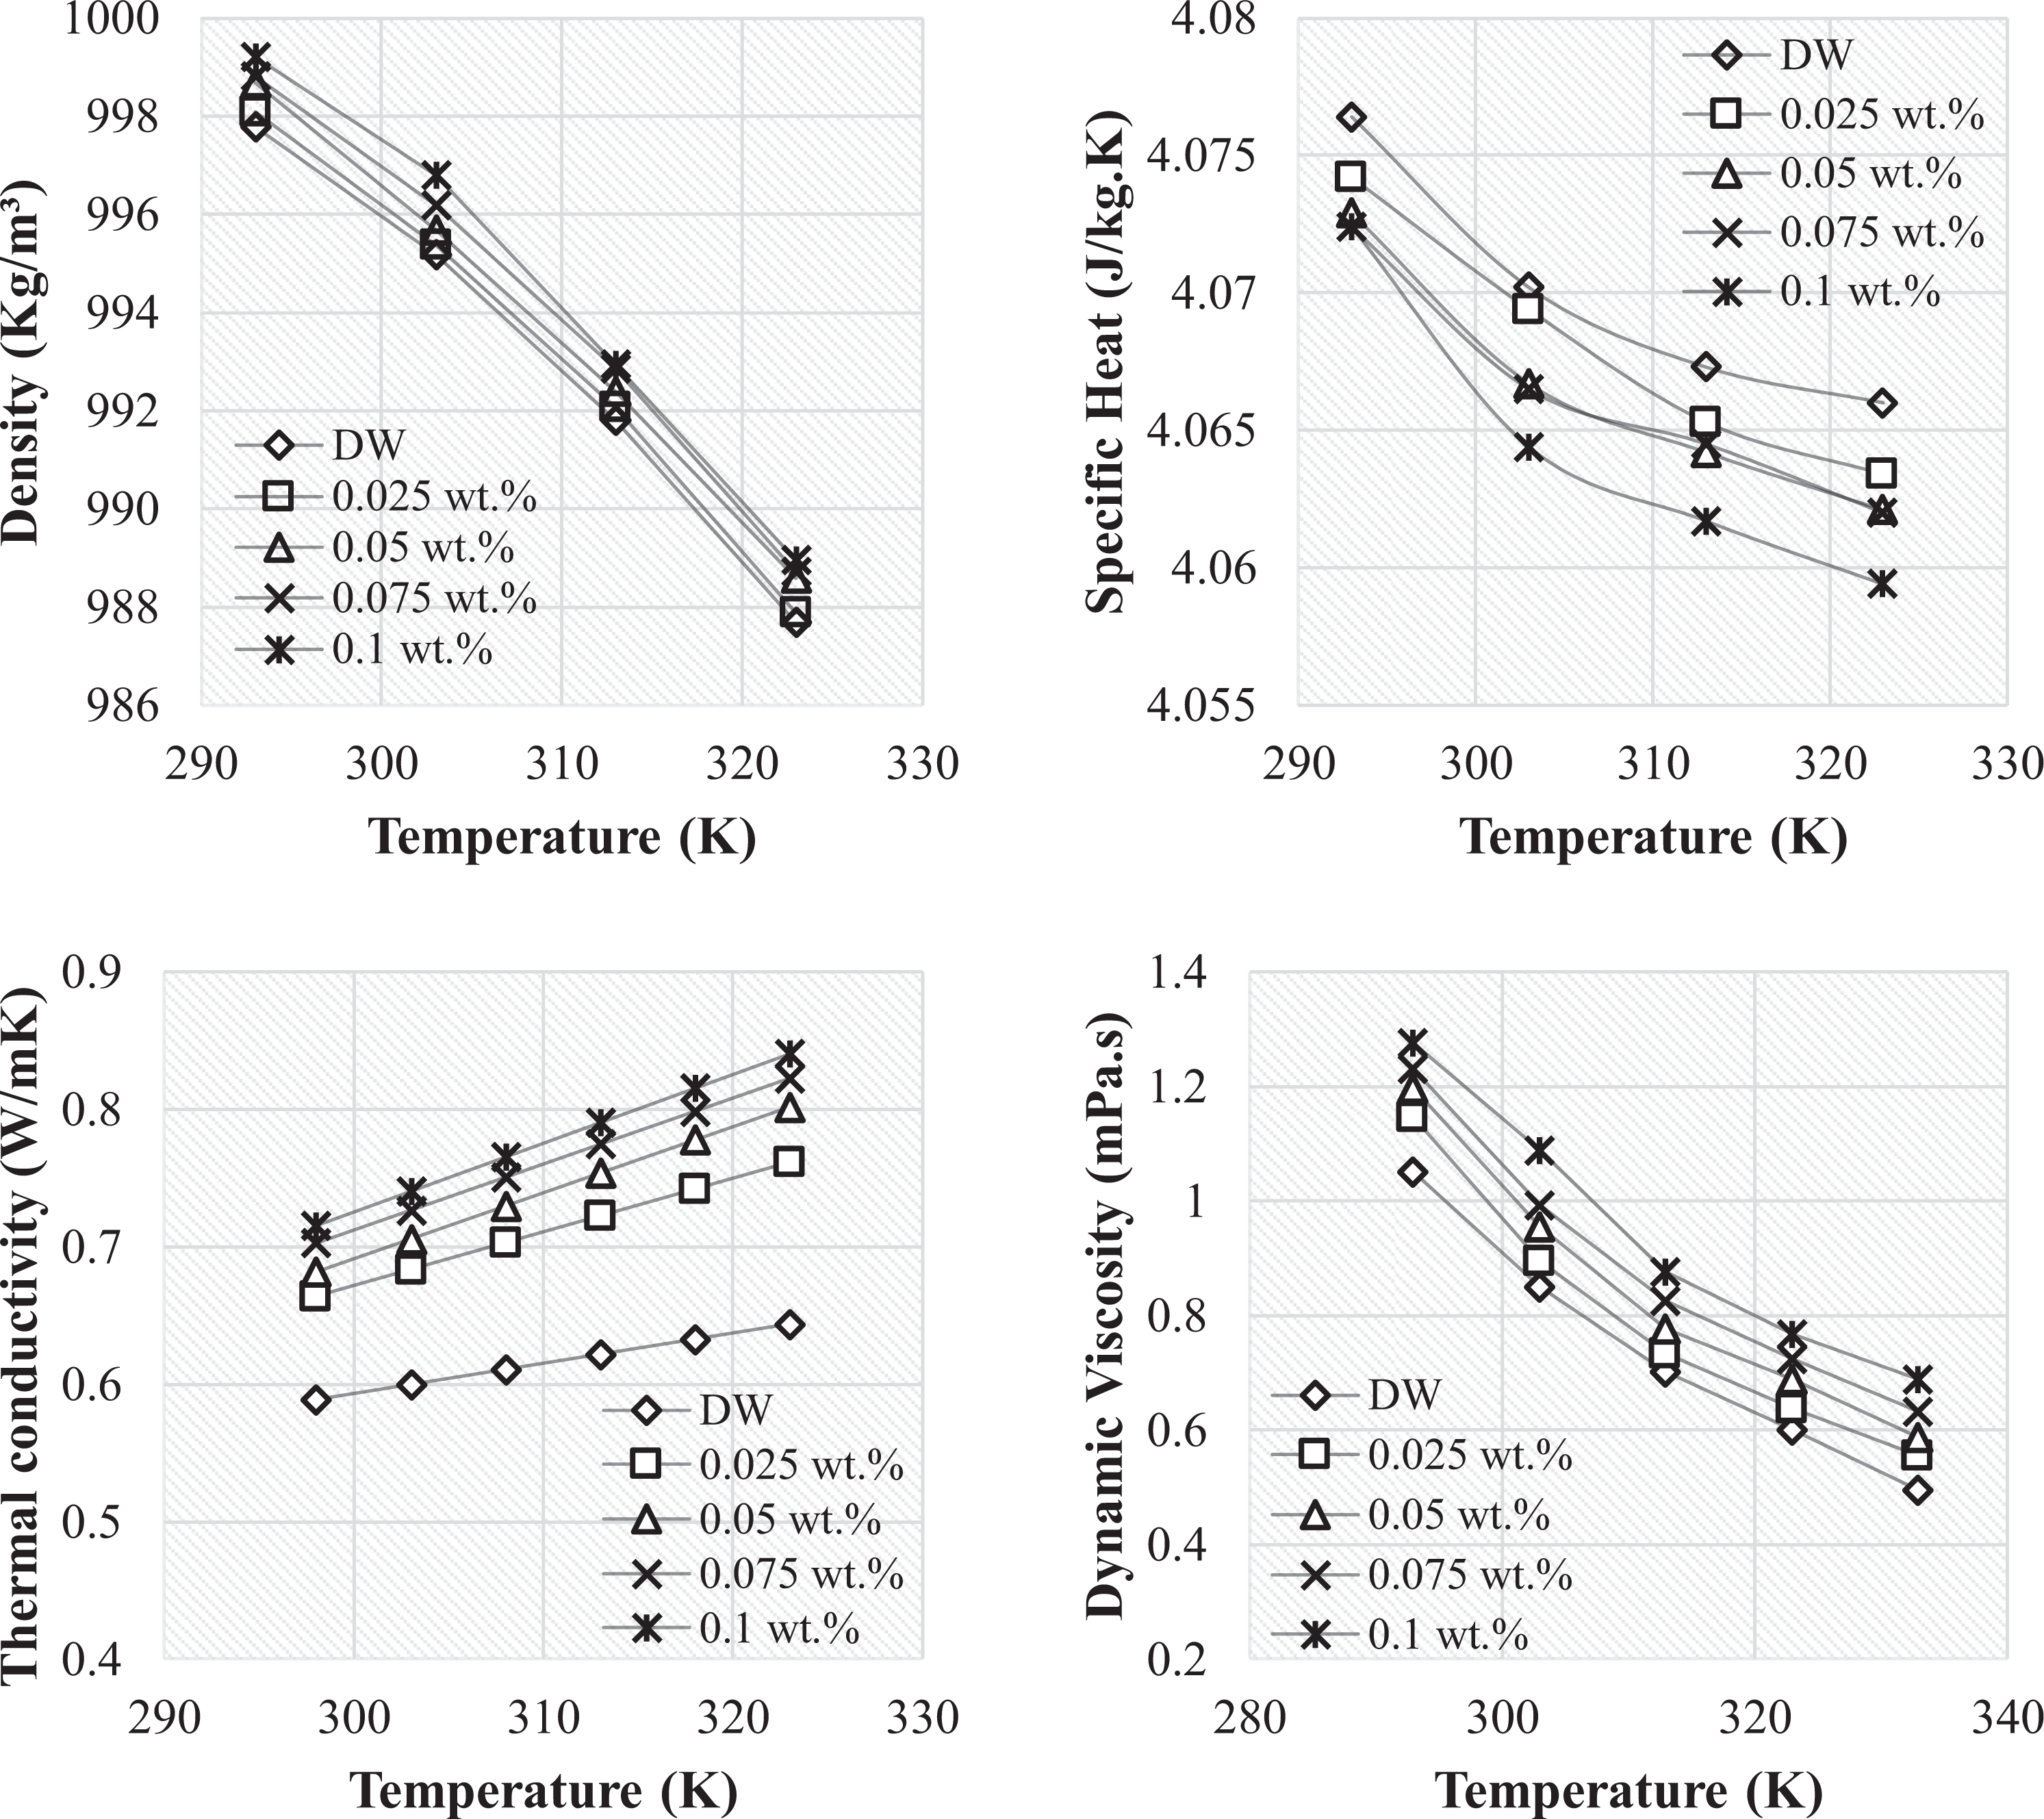
Thermophysical properties for DW and PEG-TGr nanofluids at different temperatures and mass fractions. 37 DW: distilled water; PEG-TGr: pentaethylene glycol-thermally treated graphene.
Analysis of thermal efficiency using H2O
Initially, the working fluid (DW) flowed inside the collector setup to verify the validity, reliability, and readability of the test section results before the nanofluids were conducted in the next phase. It is observed that the data reproduced well, test rig was highly accurate and remains within an error of <1%. Figure 7 exhibits the collected data of H2O run for the FPSC performance under the operating settings of different H2O mass flow rates versus the lowered temperature factor ((T i − T a)/G T). After flowing more H2O to the system (0.01667–0.025 kg s−1), the FPSC efficiency showed an increment by about 2.75% and 3.44%, respectively. The explanation for increasing the FPSC efficiency was due to the improved H2O flow rate (H2O mass flow rate), reduction of flat-plate surface temperature, and minimization of the overall heat loss. The coefficients of the heat gain (F R(τα)) and heat loss (F R U L) for the working fluid of H2O are listed in Table 3. Table 3 demonstrates that the F R(τα) value of the collector was highest when the H2O was flowing at 0.025 kg s−1, whereas the F R U L value was lowest for the same situation. Therefore, based upon equation (4), FPSC performance can be maximized at the highest flow rates.
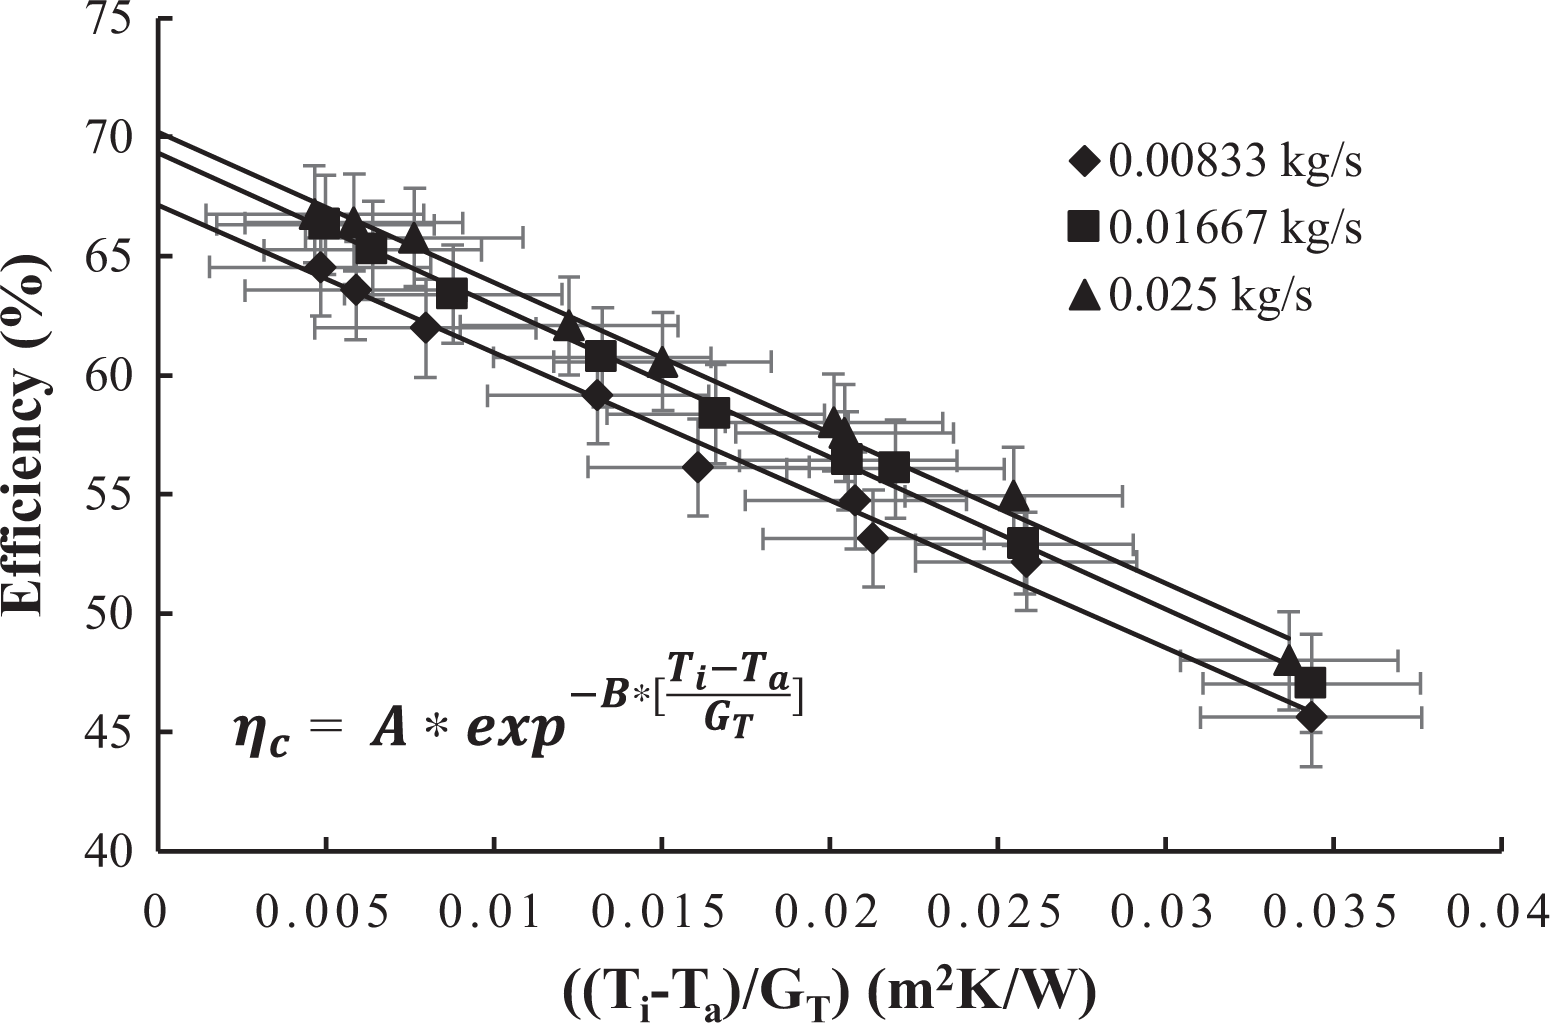
The experimental values of the collector efficiency for DW against the reduced temperature coefficient at different fluid mass flow rates. DW: distilled water.
Heat gain and heat loss coefficients at different PEG-TGr-NPs mass fractions and varying flow rates.

PEG-TGr-NPs: pentaethylene glycol-thermally treated graphene nanoplatelets; DW: distilled water.
Analysis of thermal efficiency using nanofluids
Figure 8(a) to (c) shows the measured values of FPSC efficiency for H2O and PEG-TGr-NPs nanofluids against the lowered temperature factor ((T i − T a)/G T) under the operating conditions of different PEG-TGr-NPs concentrations and changed fluid mass flow rates. From Figure 8, it can be concluded that by using H2O-suspended PEG-TGr-NPs for any concentration, the thermal performance was enhanced. As the fluid flow rate of circulating nanofluid varies from 0.00833 kg s−1, 0.01667 kg s−1, and 0.025 kg s−1, the FPSC efficiency was improved up to 10.6%, 11%, and 13.1%, respectively. Figure 9(a) to (d) exhibits the influence of PEG-TGr-NPs against the FPSC performance at four different weight concentrations (0.025, 0.05, 0.075 and 0.1% by mass) under the similar condition of fluid mass flow rate (0.00833, 0.01667 and 0.025 kg s−1). As can be seen from Figures 8 and 9, the FPSC thermal performance enhanced when the flowing of PEG-TGr-nanofluid was increased from 0.00833 kg s−1 to 0.025 kg s−1 for all the employed samples. The highest increment in the FPSC energy performance corresponding to the reduced temperature parameter was about 13.1% for the testing conditions of 0.1 wt% PEG-TGr loading and fluid flow rate of 0.025 kg s−1. The current research findings are consistent with preceding studies by Vakili et al. 28 and Karami et al. 40 It was also found that higher PEG-TGr weight fractions contributed to higher input energy absorption, hence resulting in an improvement in the FPSC effectiveness. The heat was distributed evenly across the fluid layers for the low content of Gr nanoparticles; the heat loss at the flow boundary is much lower for the lower concentration of PEG-TGr compared to the higher nanofluid weight fraction in which the uppermost fluid layers are dominated by more heat absorption. This high-temperature region at the wall boundary contributes more spaces for heat losses, thereby decreasing the effectiveness of the collector. Table 4 compares the previous experimental data on using carbon-based nanofluids inside the FPSCs.
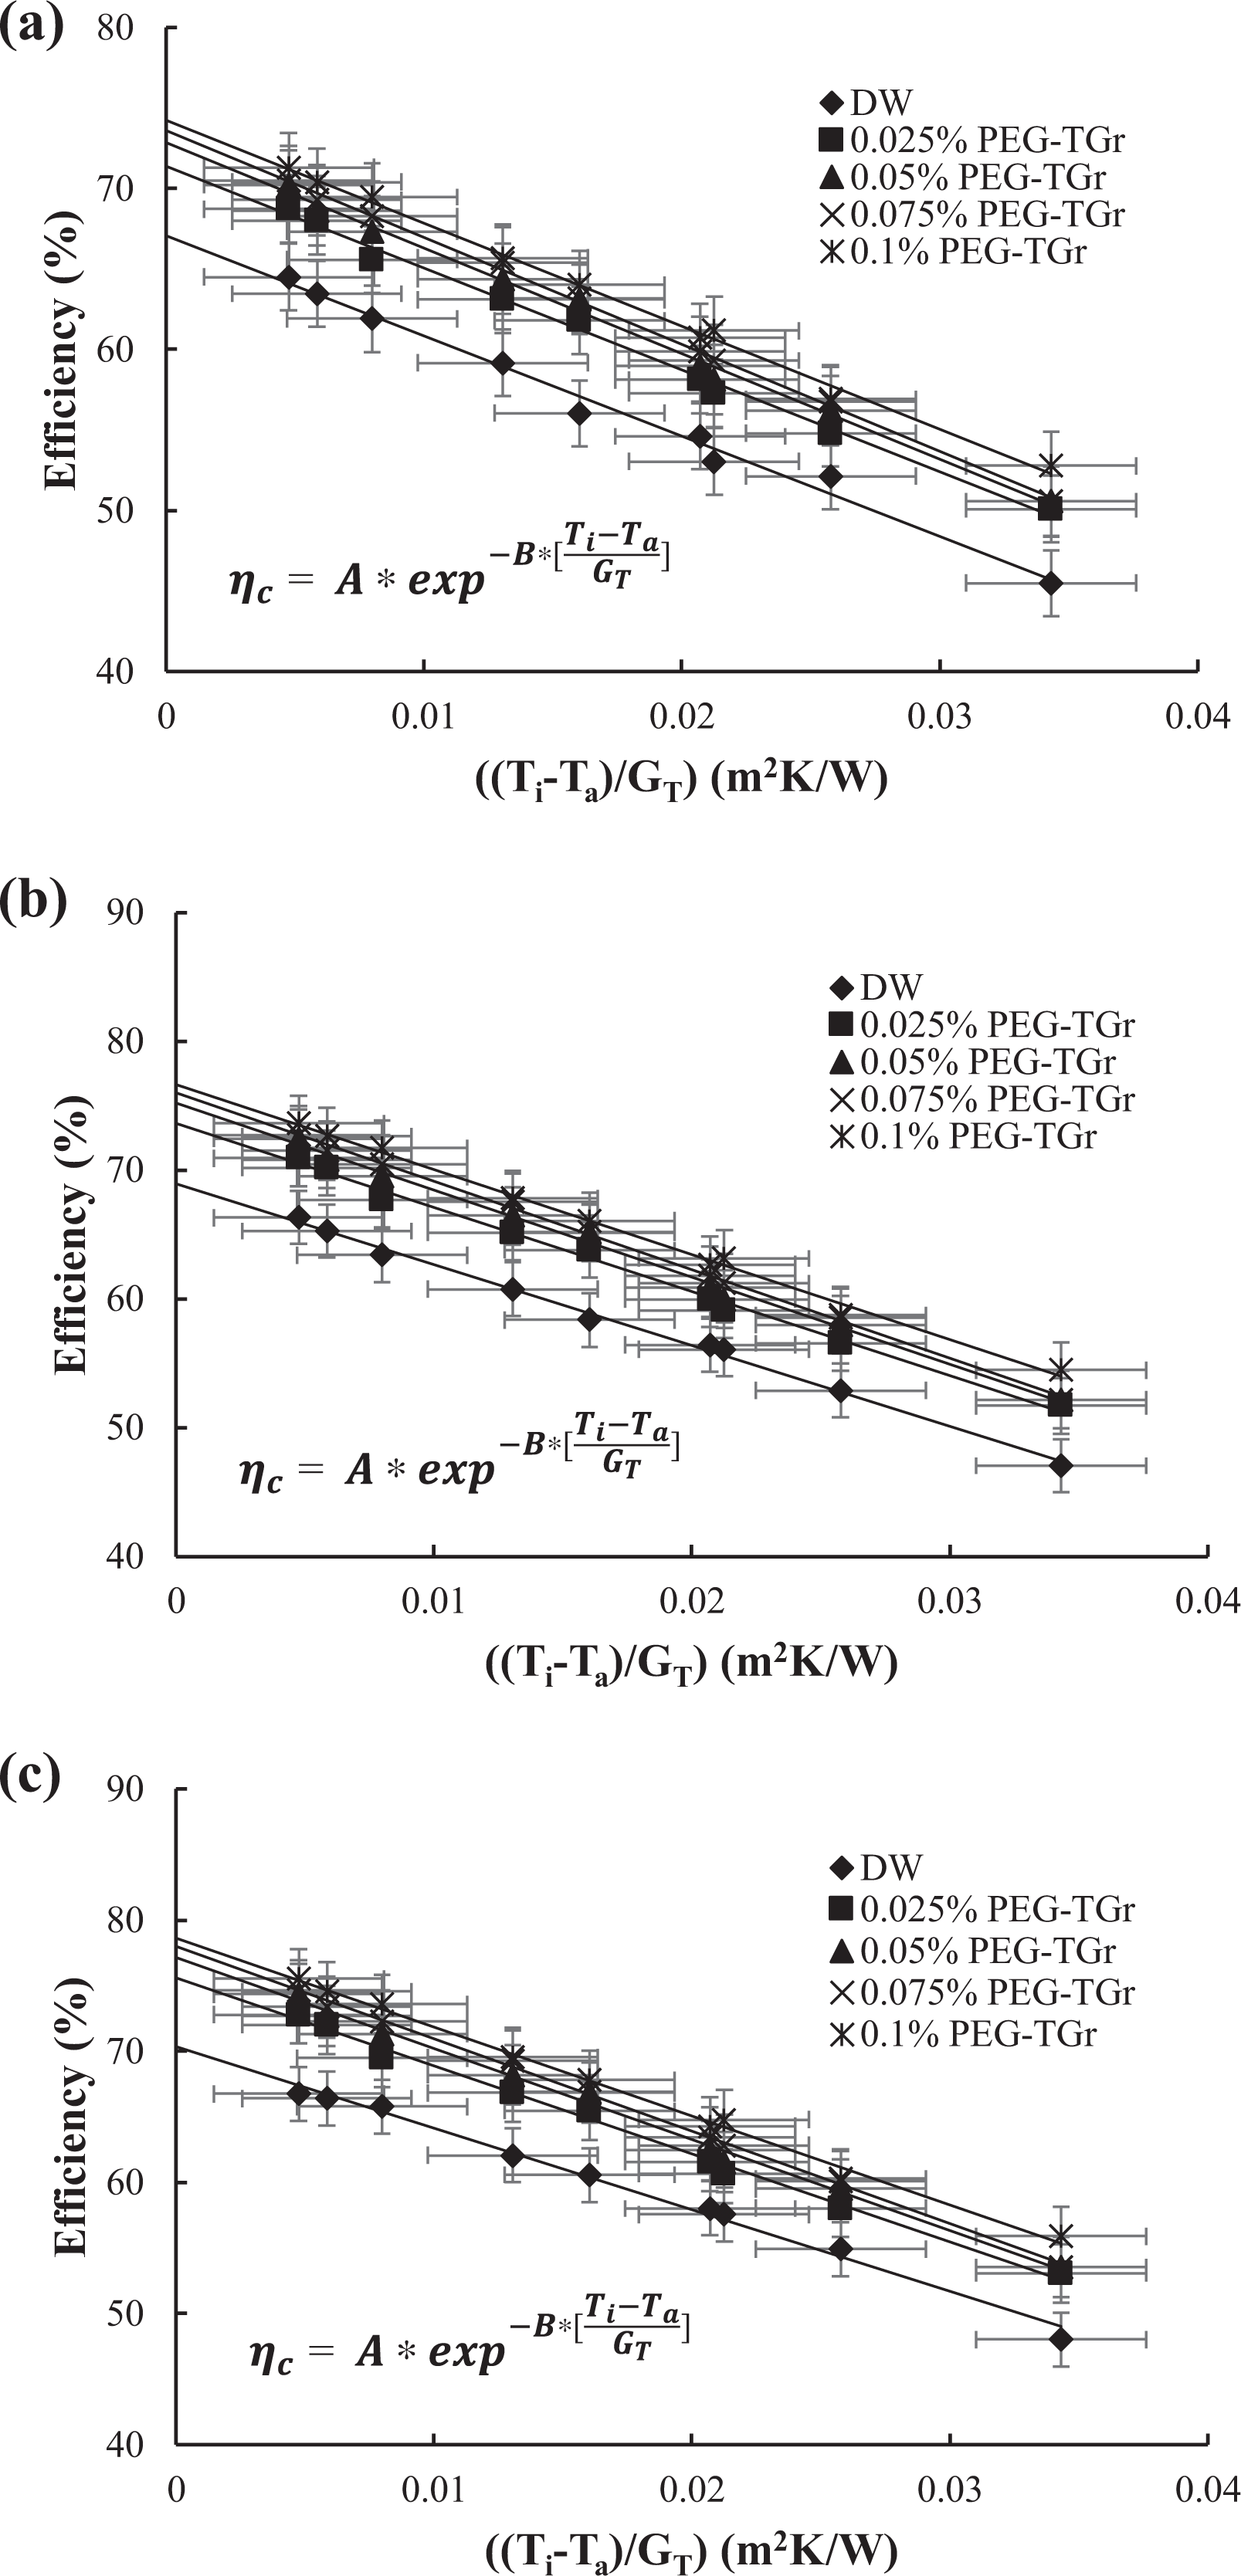
Thermal efficiency for H2O and PEG-TGr-H2O nanofluids at different mass fractions: (a) 0.00833 kg s−1, (b) 0.01667 kg s−1, and (c) 0.025 kg s−1. H2O: water; PEG-TGr: pentaethylene glycol-thermally treated graphene.

Thermal efficiency for PEG-TGr-H2O nanofluids at different fluid mass flow rates: (a) 0.025 wt%, (b) 0.05 wt%, (c) 0.075 wt%, and (d) 0.1 wt%. H2O: water; PEG-TGr: pentaethylene glycol-thermally treated graphene.
Previous experimental studies on the use of carbon nanofluids in FPSCs.
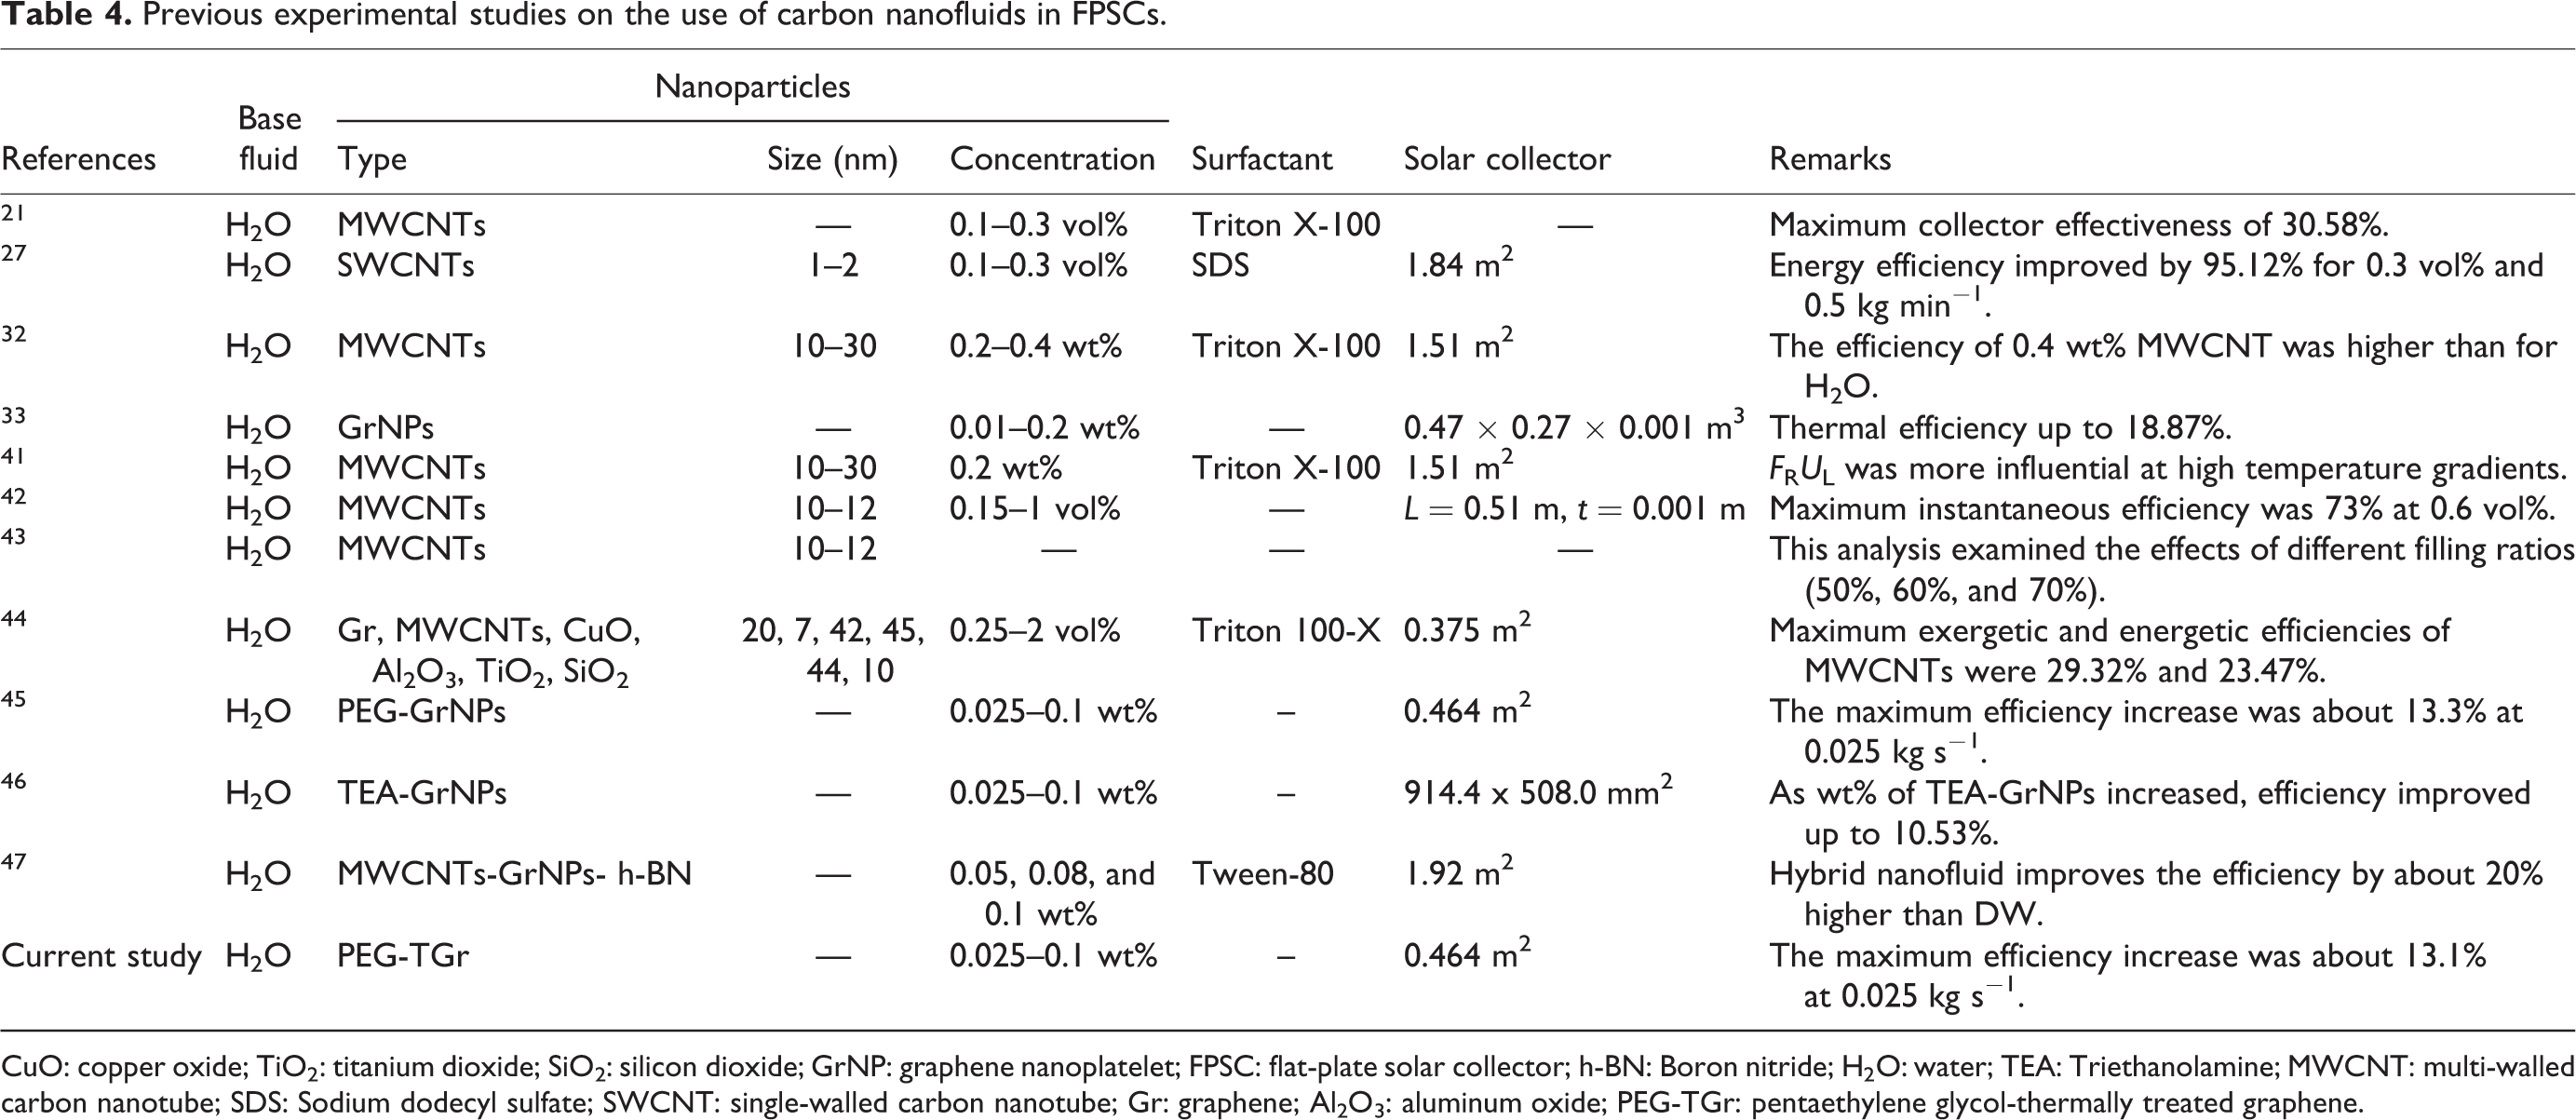
CuO: copper oxide; TiO2: titanium dioxide; SiO2: silicon dioxide; GrNP: graphene nanoplatelet; FPSC: flat-plate solar collector; h-BN: Boron nitride; H2O: water; TEA: Triethanolamine; MWCNT: multi-walled carbon nanotube; SDS: Sodium dodecyl sulfate; SWCNT: single-walled carbon nanotube; Gr: graphene; Al2O3: aluminum oxide; PEG-TGr: pentaethylene glycol-thermally treated graphene.
The critical factor for improving the FPSC effectiveness by introducing PEG-TGr nanopowder into the base fluid can be described by the following: the specific heat capacity of the nanofluids (
Table 3 and Figure 10(a) and (b) below illustrate the F R(τα) and F R U L for PEG-TGr-DW nanofluids. When the nanofluid flows at a constant flow rate (0.00833 kg s−1) and varied Gr weight concentrations (0.025 wt%, 0.05 wt%, 0.075 wt%, and 0.1 wt%), F R(τα) values progressively increased by 6.28%, 8.49%, 9.68%, and 10.53%, respectively, relative to the data of base fluid. The heat absorption factors also showed upward trends for 0.01667 kg s−1 flow rate at 0.025 wt%, 0.05 wt%, 0.075 wt%, and 0.1 wt% PEG-TGr concentrations by up to 6.25%, 8.39%, 9.54%, and 10.53%, respectively. Meanwhile, given a flow rate of the fluid at 0.025 kg s−1, there was an enhancement for (F R(τα)) by 7.63%, 9.90%, 11.04%, and 12.01%, respectively, for 0.025 wt%, 0.05 wt%, 0.075 wt%, and 0.1 wt% PEG-TGr nanofluids. When flow rate was at the lower range (0.00833 kg s−1), the corresponding value of F R U L for 0.025 wt%, 0.05 wt%, 0.075 wt%, and 0.1 wt% PEG-TGr concentrations had increased by 2.31%, 4.95%, 8.32%, and 11.17%. Meanwhile, at higher fluid mass flow rate (0.025 kg s−1), the F R U L value incremented by 1.43%, 3.31%, 4.48%, and 6.40% for different concentrations as used in the present work.
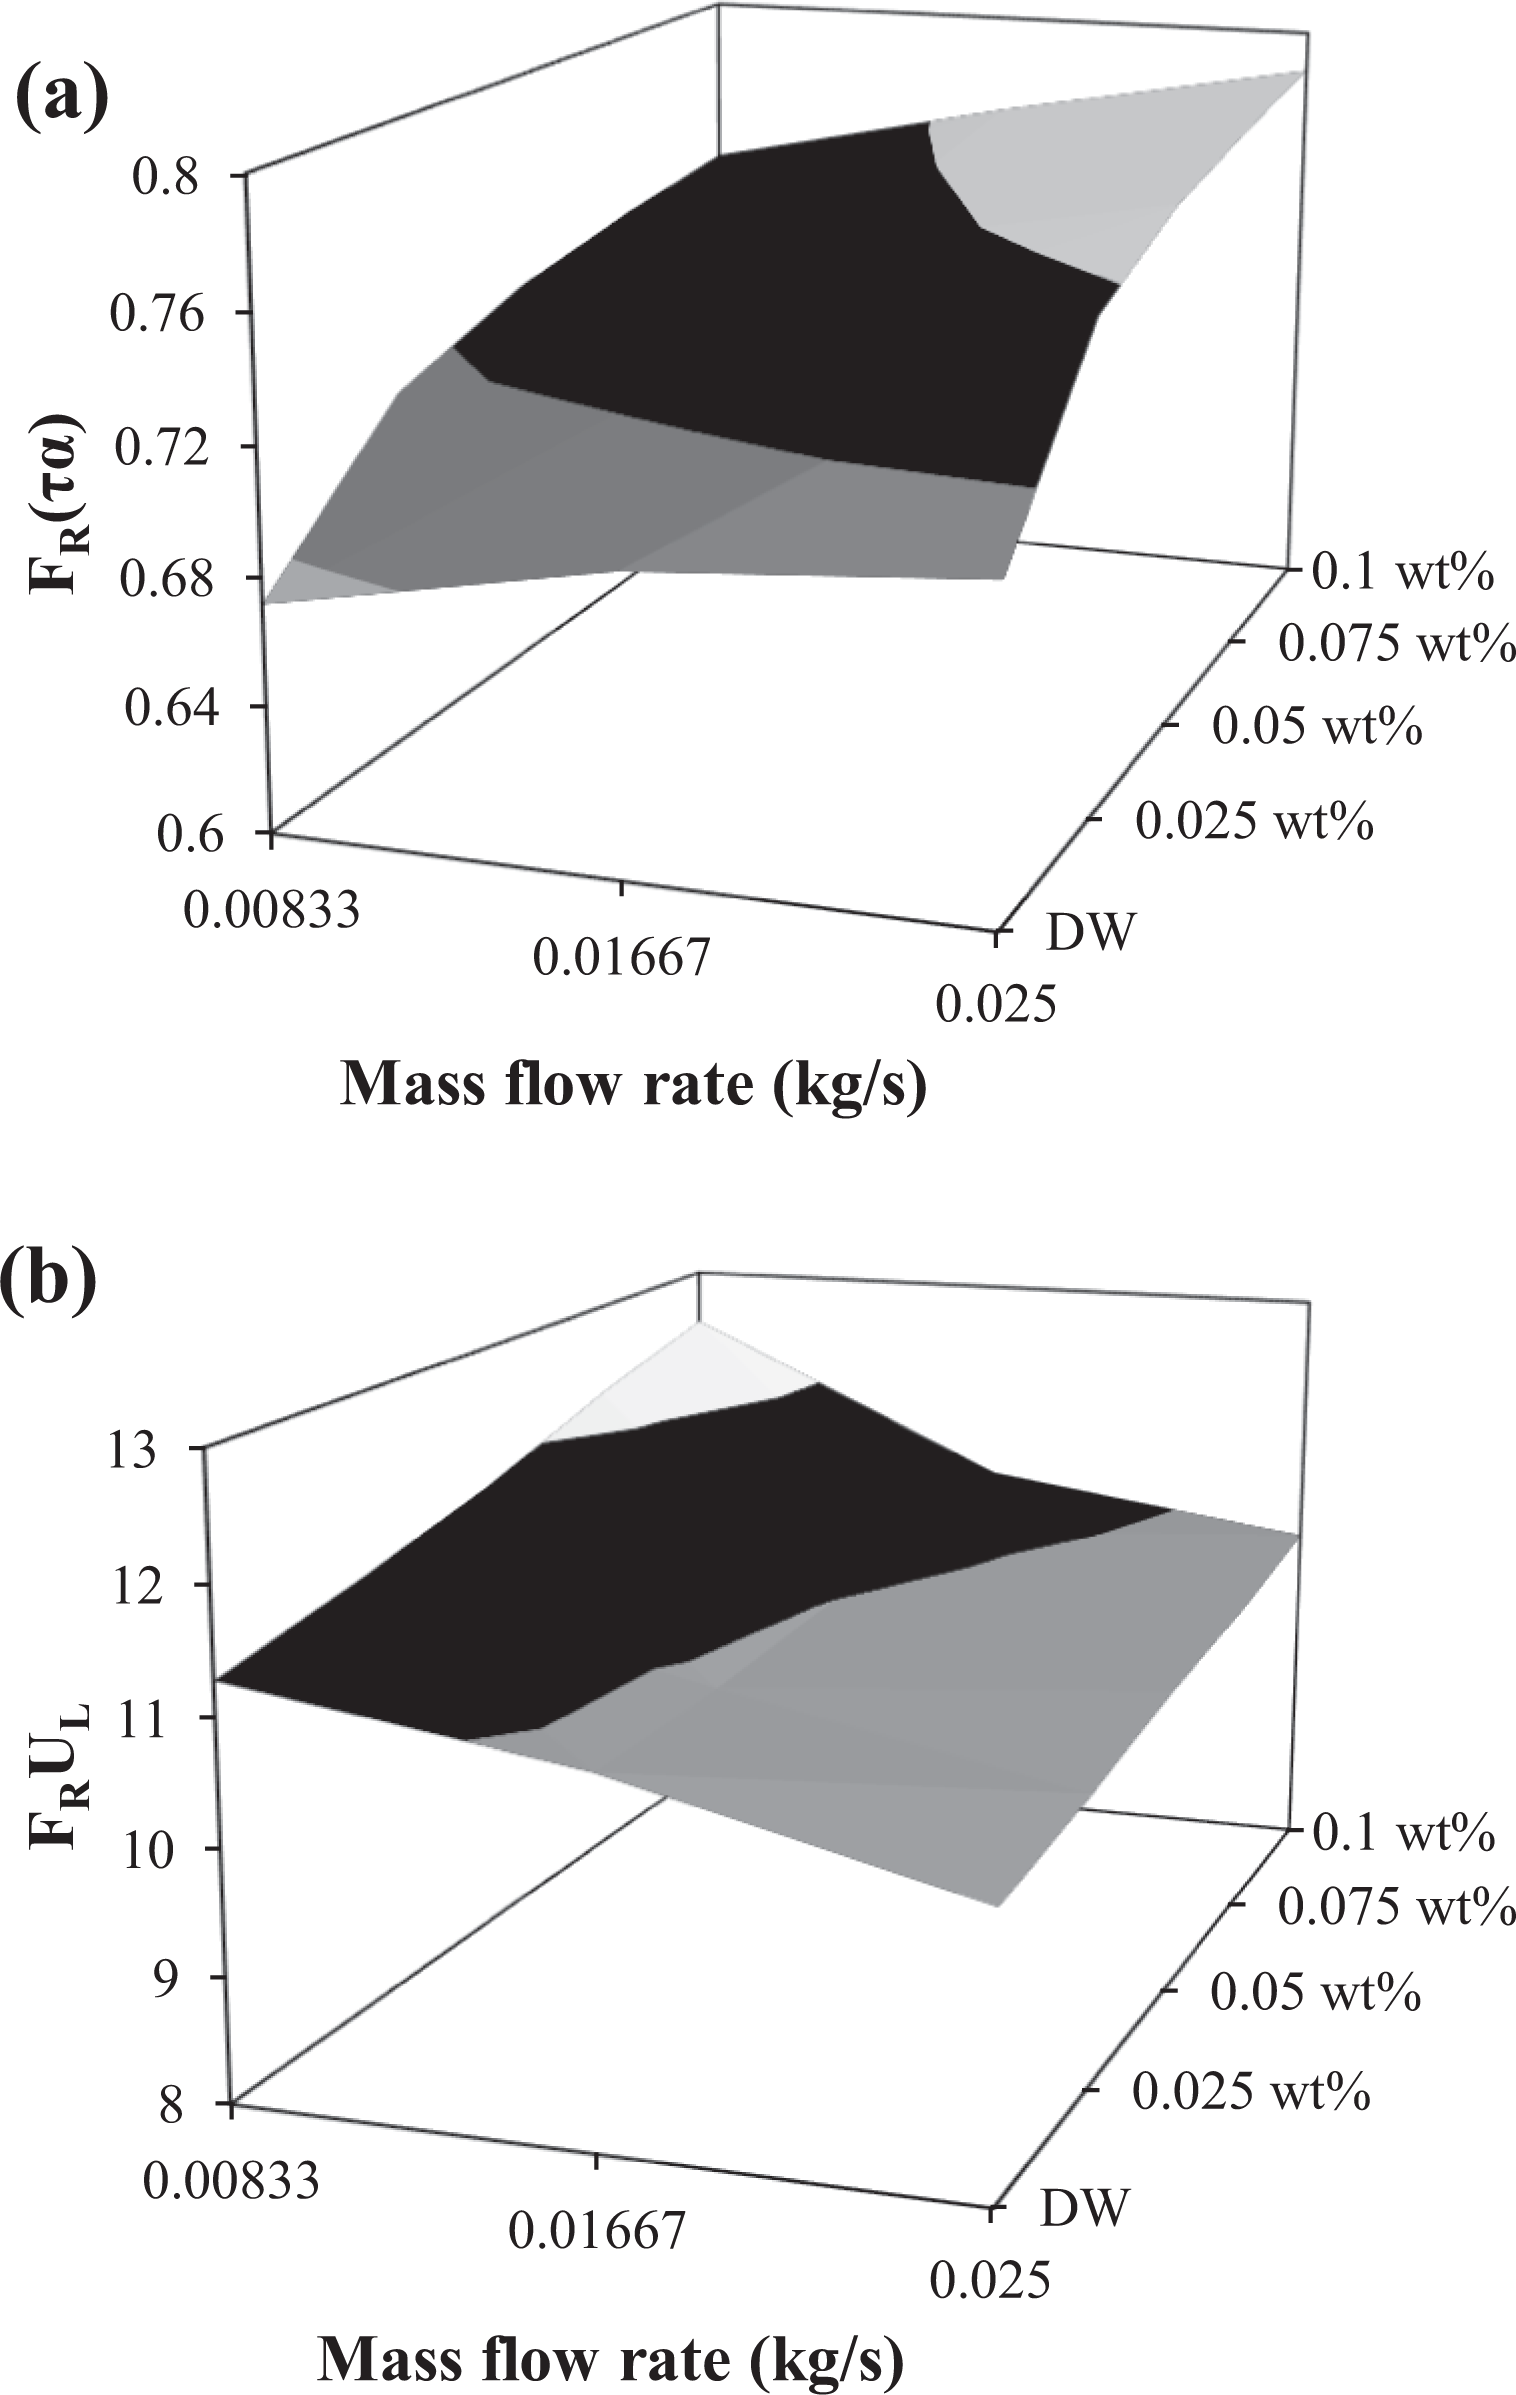
(a) The heat gain coefficient (F R(τα)) and (b) the heat loss coefficient (F R U L) for H2O and PEG-TGr-H2O nanofluids as a function of mass fraction and mass flow rate. H2O: water; PEG-TGr: pentaethylene glycol-thermally treated graphene.
Proposed model of thermal efficiency
New thermal efficiency correlation was developed as a function of the reduced temperature factor ((T i − T a)/GT ) (equation 6). An exponential form was used to derive the FPSC thermal effectiveness based on the experimental data with statistical significance at a confidence level of 95%. A maximum deviation of about 6.782%, standard deviation of about 1.962%, and average deviation of about 4.485% were observed between the experimental and proposed correlation values for all the nanofluids examined. The coefficients of the new correlation are presented in Table 5 along with R 2 values.

The coefficients of the developed correlations for the FPSC efficiency based H2O and nanofluids at different mass flow rates.
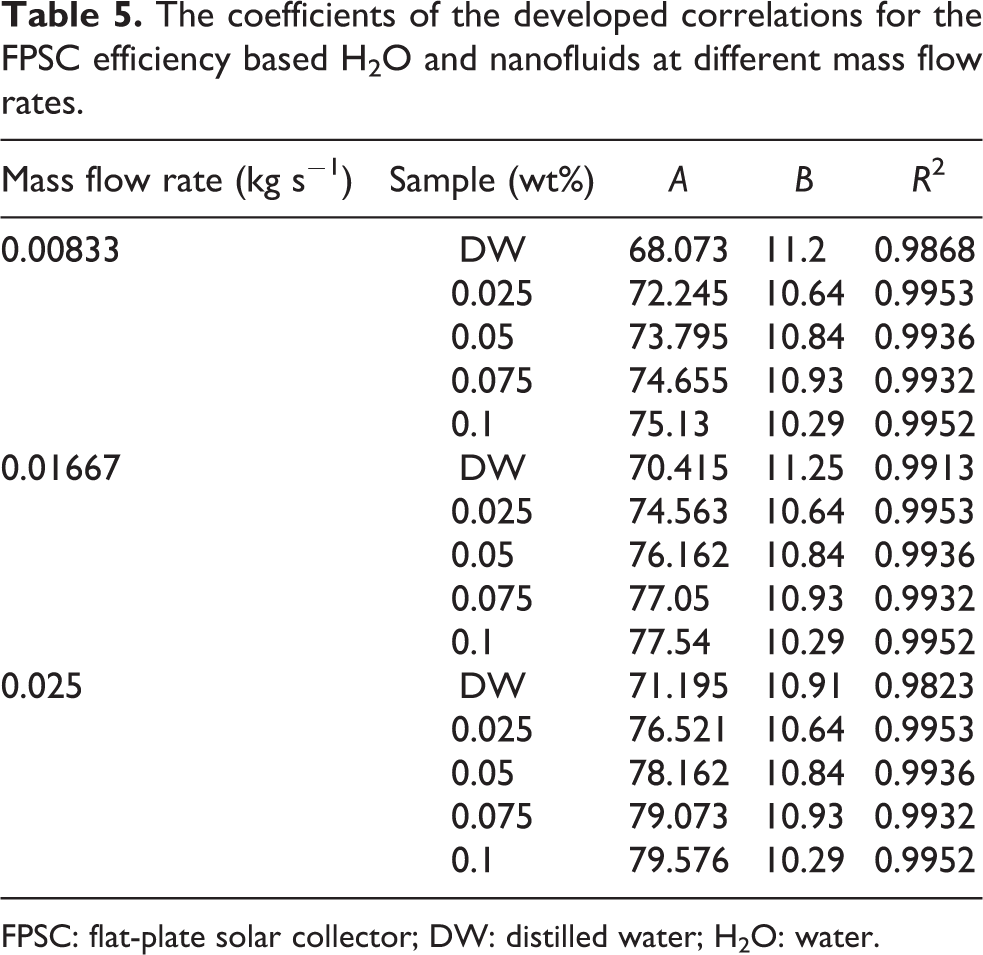
FPSC: flat-plate solar collector; DW: distilled water; H2O: water.
Conclusions
The current research aimed to experimentally discuss the impact of using few-layer Gr in aqueous suspensions as the absorbing medium on the FPSC energy efficiency. Different variables were considered during the investigations, such as various weight concentrations, different fluid flowing rates, different input fluid temperatures, and different input heat rates. After the discussion of the results aforementioned, the following conclusions were drawn; The EDX measurements portray two components present in CF-GrNPs; carbon and oxygen. Si, S, and Zr were present as a result of the oxidizing agent and from the substrate. The best enhancements in the thermophysical properties of PEG-TGr-DW relative to the base fluid were recorded as 30.48% for thermal conductivity at 323 K and 27.53% for dynamic viscosity at 0.1 wt% PEG-TGr and 303 K. The measured density with the maximum concentration value had an increment of 0.1%, whereas the specific heat reduced to 2.9% for the same concentration of 0.1 wt% PEG-TGr-H2O. Improvements in the FPSC energy efficiency relied on increases in heat flux intensity and nanofluid mass flowing rate of PEG-TGr. A reduction in thermal energy was reported as the nanofluid input temperature was raised. For the measured mass flowing rates of 0.00833, 0.01667, and 0.025 kg s−1, the highest collector performance increases are 10.6%, 11%, and 13.1%, respectively, with 0.1 wt% nanofluid. The highest observed increment in the heat loss coefficient (F
R
U
L) and the heat gain coefficient (F
R (τα)) was 11.17% and 12.01%, respectively, for 0.1 wt% PEG-TGr concentration at 0.00833 and 0.025 kg s−1 mass flow rates. New thermal efficiency correlation was developed as a function of the reduced temperature factor ((T
i − T
a)/G
T).
Footnotes
Acknowledgment
The authors gratefully acknowledge the financial support from Universiti Teknologi Malaysia, operated by the Research Management Center (RMC).
Declaration of conflicting interests
The author(s) declared no potential conflicts of interest with respect to the research, authorship, and/or publication of this article.
Funding
The author(s) disclosed receipt of the following financial support for the research, authorship, and/or publication of this article: This work was supported by the Universiti Teknologi Malaysia, operated by the Research Management Center (RMC), under the Research University grant number 04E76.