
Abstract
In this study, the response surface methodology was used to investigate the tensile properties of epoxy/graphene nano-platelets/carboxylated nitrile butadiene rubber ternary nanocomposites. Box–Benhken method was used to design experiments for four factors consisting of graphene nano-platelets (at 0, 0.75, and 1.5 wt%), carboxylated nitrile butadiene rubber (0, 5, and 10 wt%), hardener contents (80, 90, and 100 phr), and also different post curing temperature (130, 140, and 150°C). After the samples were prepared, a tensile test was performed to obtain the tensile strength, tensile modulus, and elongation at break of nanocomposites. Moreover, field-emission scanning electron microscopy was used to observe the state of graphene nano-platelets dispersion. The results obtained from the tensile tests showed that increasing the graphene nano-platelets, carboxylated nitrile butadiene rubber, and hardener contents and high post curing temperature reduced the tensile strength. The optimum value of tensile modulus was achieved at low concentration of carboxylated nitrile butadiene rubber and high contents of graphene nano-platelets, whereas maximum elongation at break occurred at high content of carboxylated nitrile butadiene rubber and low concentration of graphene nano-platelets and hardener. In addition, a second-order polynomial model was used to correlate the tensile properties of ternary nanocomposites to the desired factors. Finally, contour plots were used to determine optimum values of the desired factors. It was seen that the presence of 10 wt% of carboxylated nitrile butadiene rubber in the epoxy matrix increased the elongation at break by the considerable amount of ∼49%.
Introduction
In the last decade, nanotechnology has caused great expectation and excitement in the field of composite materials. Nanocomposites are one of the achievements of nanotechnology. Nanoscale second phase embedded in the polymer matrix can give excellent physical and chemical properties that cannot be obtained by ordinary material synthesis methods. Science and technology of nanocomposites is in explosive growth using new methods of synthesis. There are many nanoscale materials that have been used by researchers, such as nano-silica, 1 nano-titanium, 2,3 carbon nanotube, 4 –7 aluminum oxide nanoparticles, 8,9 zirconium dioxide nanoparticles, 10 and clay nanoparticles 11 , to improve the mechanical and thermal properties of polymer matrices. Among these nanoparticles, graphene with superior properties has attracted great attention in both the fields of science and industry. This material opens a new avenue for developing high strength, lightweight structural polymer composites and applications in the field of automotive, aerospace, electronics, and lithium ion battery. 12,13 Graphene has been widely used to reinforce polymer matrices. 14 –17
Epoxy and epoxy-based composites are one of the most important thermosetting resins in the industry. They attracted lot of attentions due to their high stiffness, adhesive properties, chemical resistance, and good dimensional stability. 18 Many studies have been carried out to investigate the influence of graphene on mechanical properties of epoxy matrices. Rafiee et al. 19 investigated the effect of three nano-fillers, that is, graphene nano-platelets (GnPs) as well as single and multi-walled carbon nanotubes, at fixed 0.1 wt% on epoxy mechanical properties. They reported ∼31% greater tensile modulus of graphene nanocomposites compared to neat epoxy. In contrast, their carbon nanotube composites showed ∼3% improvement. The remarkable property enhancement of graphene nanocomposites compared to carbon nanotubes can be attributed to the two-dimensional geometry and high specific area of GnPs; the structure of the interphase should also be mainly responsible for such property enhancements. Zaman et al. 20 embedded a graphene platelet into an epoxy resin. Adding graphene caused a gradual reduction in the tensile strength of the nanocomposite. However, tensile modulus improved by the addition of 2.5 wt% of graphene. Similar evidence regarding improvement of tensile modulus and reduction in tensile strength of grapheme–epoxy nanocomposites is reported by King et al. 21 Accordingly, tensile modulus was enhanced ∼23% and ultimate tensile strength declined approximately 54% compared to pure epoxy for 6-wt% graphene nanocomposites. The influence of two types of GnPs, that is, GnP-5 and GnP-C750, which are different in aspect ratio, on tensile modulus and strength of epoxy systems is examined by Wang et al. 22 GnP-5 enhanced tensile modulus more than GnP-C750 because of its higher aspect ratio and better dispersion in epoxy matrices. The tensile strength of GnP-C750/epoxy composite remained almost constant compared to pure epoxy. However, poor interaction between GnP-5 and the epoxy matrix caused a reduction in the tensile strength of GnP-5/epoxy composite.
Despite the favorable properties of epoxies, their brittle nature is considered as a drawback in many applications. Thus, toughening epoxies is crucial. Among some approaches, blending epoxies with a suitable rubber, as a second phase, is the common and most effective approach. 23,24 Some researchers have considered the use of elastomeric polymers to modify epoxies. Thomas et al. 25 incorporated hydroxyl-terminated polybutadiene (HTPB) rubber into an epoxy matrix in 0, 5, 10, 15, and 20 parts per hundred rubber (phr) levels and compared it, 26 in which an epoxy matrix was blended with carboxyl-terminated butadiene acrylonitrile (CTBN). Generally, adding a rubber into an epoxy matrix decreases elastic modulus due to its elastomeric nature. Because of lowering the cross-linking density, elastic modulus was less decreased by HTPB than by CTBN. Moreover, the tensile strength was reduced continuously by the addition of rubber.
The presence of rubber particles in epoxy matrices causes stress concentration and authorizes an improvement in toughness of epoxy matrices by various mechanisms 27 but decreases mechanical properties such as elastic modulus and tensile strength. Mechanical properties of a hydroxylated liquid natural rubber modified epoxy are examined by Mathew et al. 28 They reported a decrement in tensile modulus and tensile strength with increase in rubber concentration. Elongation at break was enhanced up to optimum content of rubber, 15 wt%, and then began to decrease. Singhal et al. 29 modified an epoxy with carboxylated nitrile butadiene rubber (XNBR). They showed that adding XNBR improved elongation at break, while decreased tensile strength and tensile modulus.
Due to the demand for superior mechanical properties, simultaneous incorporation of epoxy matrices with rubbers and nano-fillers has been widely studied. Since the addition of rubbers into epoxy matrices decreases tensile strength and modulus, the incorporation of a rubber modified system with nano-fillers can rectify the undesirable effect of rubbers. Wang et al. 18 showed that adding 0.5 wt% multi-walled carbon nanotube into a CTBN/epoxy system increased the elongation at break and tensile strength of the system. Improvement of tensile modulus and strength of GnP/CTBN/epoxy nanocomposites compared to those of CTBN/epoxy composites is investigated by Wang et al. 30
As can be seen from literature, most of studies emphasize investigation only one independent factor to be changed at a time, while keeping others at fixed level. Interaction between variables is an important point, which has been neglected in convenient methods. Statistical tools such as the design of experiments (DOE) and response surface methodology (RSM) can be a solution to consider all factors simultaneously for an experimental run. 31 Multi-response optimization of properties can be determined using desirability function, which is provided by RSM.
In the present work, the goal is to employ the Box–Behnken design in RSM as a DOE method to conduct the modeling process and investigate the effects of parameters including GnPs, XNBR, hardener contents, and different post curing temperatures (PCT) on the tensile strength properties of epoxy/graphene/XNBR ternary nanocomposites. In addition, contour plots were used to determine the optimum values of the desired factors.
Experiment
Materials
Diglycidy ether of bisphenol-A (DGEBA, LY-556) epoxy resin was supplied by Ciba Specialty Chemicals Switzerland Global Enterprise, Office Zurich, Switzerland and used as the matrix. The curing agent was hardener Aradur (anhydride hardener HY-917, Ciba Specialty Chemicals) and an imidazole accelerator (DY-070). GnPs with a specific surface area of ∼750 m2/g, thickness of 5–7 nm, and diameter of less than 2 μm were obtained from XG Science, Manufacturer in Delhi Charter Township, Michigan, USA. In this work, GnPs were used without any surface treatment. The toughening agent was XNBR with 26% of acrylonitrile (Nipol® NX 775, ZCEL Chemical).
Sample preparation
Neat epoxy
To make neat samples, an epoxy resin was preheated at 60°C and mixed by hand with desirable amount of the hardener (according to the three levels of hardener that are considered in this work) and accelerator (2 phr) for 10 min. The mixture was then degassed for 20 min, poured into silicone molds, and cured in oven at 80°C for 4 h and subsequently, was post cured (according to the three levels of PCT that are considered in this work) for 8 h.
Dispersion of GnPs
Weighted amounts of GnPs were first dispersed in acetone (∼15 mg/ml) by employing an ultrasonicator for half an hour followed by adding measured amount of the epoxy resin and then mixed by mechanical stirring (3000 r/min) for 10 min. Next, a hot plate was used to remove acetone from the mixture.
Nanocomposite fabrication
Ternary nanocomposites were fabricated as follows. First, weighted amount of XNBR was dissolved in acetone (∼90 mg/ml). Then, it was added to the GnPs/epoxy mixture and mixed by mechanical stirring. The blend was heated at approximately 60°C to remove the solvent. Afterward, the desirable amounts of the hardener and accelerator were added to the mixture. Finally, the blend was degassed under vacuum to remove all bubbles and solvent trace, poured into silicone molds, and cured in oven pursuant to post cure at the PCTs determined in this work.
Design of experiments
The development of nanocomposites is a complicated process. To optimize processes, many researchers have used statistical methods, such as RSM. 32 –34 RSM is used to design, analyze, and optimize responses and also, to reduce experiment, financial input, and time. 35 Further, it can evaluate the effect of each variable specifically and simultaneously on responses. In this work, Box–Behnken experimental design of RSM is used to design the experiments and optimize the responses. RSM works according to the following equation to find a proper estimation for the unknown relationship between the variables and response

where y is the response; x 1, x 2,…, xq are the variables and q is the number of factors; β 0 is the constant term; βi are the coefficients of the polynomial for linear effects; βii are the coefficients of quadratic effect; βij are the coefficients of the polynomial for the interaction effect; and ε shows the random error in y.
The levels of the parameters, namely GnPs, XNBR, PCT, and hardener, are listed in Table 1. The statistical software Minitab® 17 created the Box–Behnken design, and the 27 experiments are listed in Table 2.
Variables in the Box–Behnken experimental design.

GnPs: graphene nano-platelets; XNBR: carboxylated nitrile butadiene rubber; PCT: post curing temperature.
The Box–Behnken experimental design.

GnPs: graphene nano-platelets; XNBR: carboxylated nitrile butadiene rubber; PCT: post curing temperature.
Characterization
Tensile properties were characterized by the Zwick/Roell-Z100 series instrument, ZwickRoell GmbH & Co. KG (Germany). The tensile samples were prepared according to ISO 527-1, and the tests were accomplished at room temperature and crosshead speed of 5 mm/min; also, for each response (tensile properties), average of the three runs was reported. The fracture surface morphology of the cured systems was specified using a MIRA3 TESCAN field-emission scanning electron microscope (FESEM), Libušina tř. 21, 623 00 Brno – Kohoutovice, Czech Republic. The FESEM images were taken from the fracture surfaces of gold coated samples in vacuum atmosphere with an accelerating voltage of 20 kV.
Tensile properties
To find significant parameters affecting the epoxy/GnPs/XNBR nanocomposites, p-values from analysis of variance (ANOVA) were obtained. The p-value is defined as the lowest level of significance leading to the rejection of a null hypothesis; it appears that the effect of each parameter is statistically significant at the p-value of less than 0.05. A p-value of <0.05 means that this result would have arisen by chance on less than 1 occasion in 20. A result in the statistically significant range (p-value < 0.05) suggests that the null hypothesis should be rejected. The value of coefficient estimates and p-values are presented in Table 3. As can be seen from Table 3, all the linear terms (GnPs, XNBR, PCT, and hardener) have significant effect on all the three responses due to their p-values (≤0.05). For the tensile strength and modulus, the effective interaction term is GnPs × XNBR. Moreover, the effective interaction terms of the elongation at break are consisting of GnPs × XNBR and GnPs × Hardener. Furthermore, R 2 values of the tensile properties are given in Table 3. Although R 2 closer to 100% means that the model is more valid, the range achieved for R 2 in this study indicated very good fitting of the experimental data. The R 2 Adj is also a useful tool for comparing the explanatory power of models with different numbers of predictors. In addition, R 2 Pred. is calculated by systematically removing each observation from the data set, estimating the regression equation, and determining how well the model predicts the removed observation.
Coefficient estimates, p values, and R 2 values for tensile properties.

GnPs: graphene nano-platelets; XNBR: carboxylated nitrile butadiene rubber; PCT: post curing temperature.
The coefficients in the second-order polynomial equation were estimated by multiple regression analysis based on the ANOVA results. After discarding nonsignificant variables, the quadratic models in terms of coded variables for each response were obtained, which are presented in Table 4. It can be seen in Table 4 for tensile properties that all the main parameters had a negative effect on the tensile strength and thus, higher parameters setting resulted in a lower response. One sees that, among all the significant variables and interactions, the GnPs × XNBR had the greatest effect on the tensile strength due to its highest coefficient. Additionally, Table 4 lists that GnPs and the hardener had a high positive effect on the tensile modulus, while the other main parameters had a negative effect on it. On the other hand, among the main parameters affecting the elongation at break, only rubber was observed to have a positive and good effect on it. Generally, it can be seen from Table 4 that among all the parameters affecting the tensile properties, GnPs with the coefficient 82.92 had the most significant positive effect on the tensile modulus.
The quadratic model for each response.
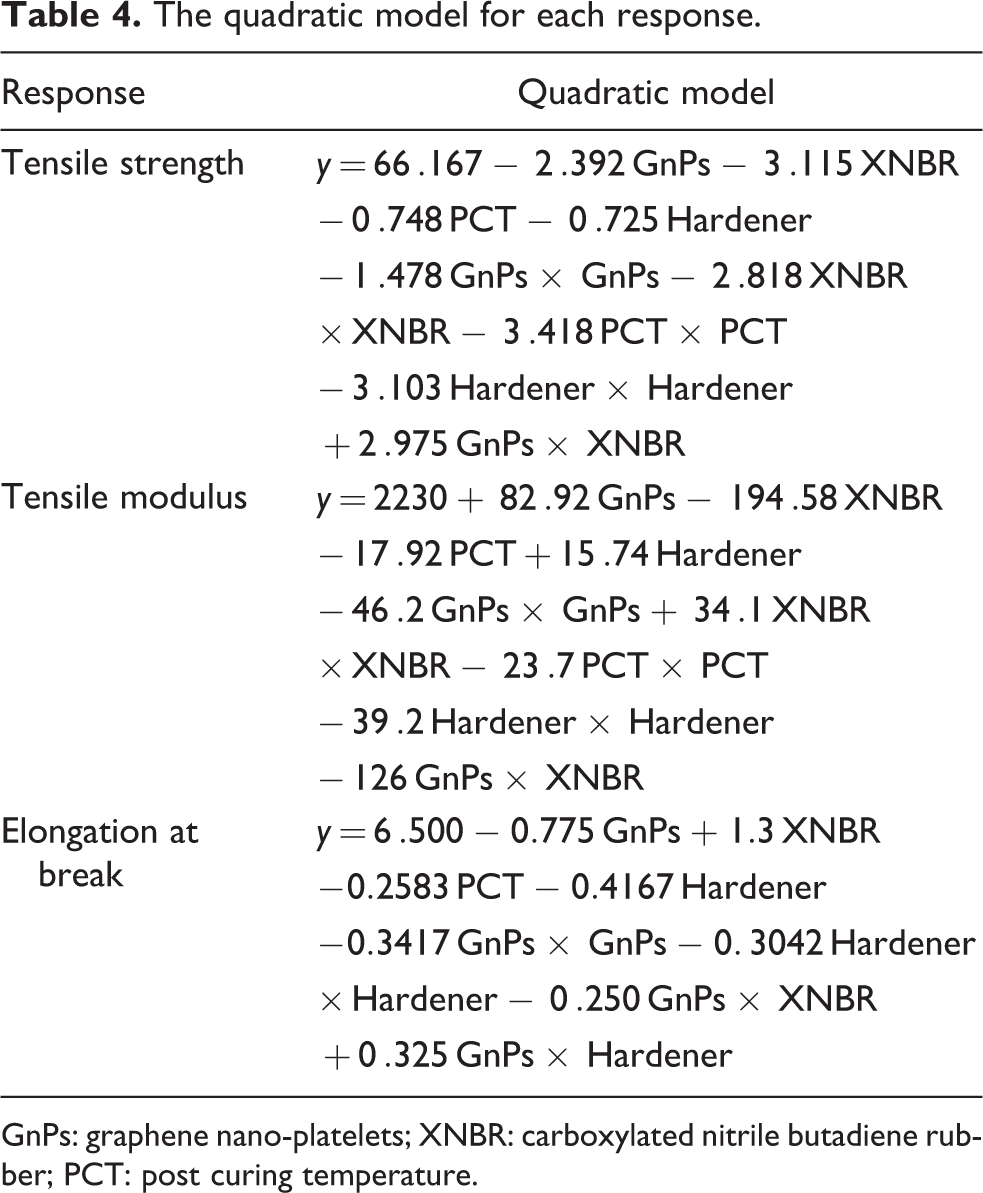
GnPs: graphene nano-platelets; XNBR: carboxylated nitrile butadiene rubber; PCT: post curing temperature.
Tensile strength
The main effect of each factor on the tensile strength is plotted in Figure 1. As can be seen from Figure 1(a), adding GnPs shows a reduction in the tensile strength and the maximum reduction occurred in 1.5 wt% of GnPs loading by approximately 7%. The reduction may be attributed to weak interface between the graphene and epoxy matrix, which results in debonding of particles. 36 Furthermore, as it can be observed from the FESEM images in Figure 2(a), the agglomeration of GnPs in 1.5 wt% causes stress concentration and influences the tensile strength. The decrement of tensile strength of epoxies after the addition of GnPs is also reported by some authors. 20,21

The plot of the main effect for the tensile strength against (a) graphene, (b) XNBR, (c) PCT, and (d) hardener. XNBR: carboxylated nitrile butadiene rubber; PCT: post curing temperature.

Field-emission scanning electron microscopic images of the samples including (a) 1.5 wt% of GnPs and 5 wt% of XNBR; and (b) 0.75 wt% of GnPs and 5 wt% of XNBR. GnPs: graphene nano-platelets; XNBR: carboxylated nitrile butadiene rubber.
Figure 1(b) shows the tensile strength against XNBR. The very slight and unusual improvement in the tensile strength in 2.5-wt% XNBR loading can be seen from this figure which could be related to the interphase enhancement because of interaction of polar groups is more than the effect of lowering of tensile strength due to soft nature of the rubber. The increment in tensile strength at low content of XNBR is also reported by Singhal et al. 29 However, the tensile strength declined at higher content of XNBR. Generally, adding rubber decreases tensile strength of neat epoxies due to its lower strength and modulus. Low modulus rubber particles decrease tensile strength by acting as stress concentration. 37 Incorporating 10-wt% XNBR had the most negative effect (∼10% reduction) on the tensile strength of the epoxy among all the factors.
From Figure 1(c), the tensile strength increased approximately 5% as PCT increased up to 140°C. Increasing PCT enhances the cross-link density of the epoxy. It appeared that the cross-link density became saturated after 140°C, and optimum PCT to have maximum tensile strength for the used epoxy system was around 140°C. At higher PCT, the tensile strength decreased, which can be correlated to destroying of the cross-linked linkages. 38 Moreover, this reduction is an evidence that one or more of the composite components are modified during post curing. Campana et al. 39 showed that the higher the PCT is, the lower the tensile stress is. They reported 40% decrease in tensile strength when the PCT increased from 120°C to 150°C.
According to Figure 1(d), the effect of various amount of the hardener and PCT had a similar trend. By increasing the amount of the hardener, the cross-link density increased. The higher degree of cross-linking makes the material strong and rigid which authorized an increment in the tensile strength (∼4%). By adding more amount of hardener, the system showed less resistance to the pulling load which is probably due to non-reacted hardener molecules making the material less stable.
The response surface plots of the significant interaction are given for more analysis. The 3-D response surface plots for the tensile strength against XNBR × PCT and Graphene × XNBR are presented in Figure 3(a) and (b), respectively.

The surface plots of the tensile strength versus: (a) XNBR and PCT, and (b) graphene and XNBR. XNBR: carboxylated nitrile butadiene rubber; PCT: post curing temperature.
According to Figure 3(a), it is observed that the tensile strength considerably decreased with increasing XNBR from 0 wt% to 10 wt% as PCT was 130°C, while it slightly increased with increasing PCT from 130°C to 140°C and then decreased as XNBR was 10 wt%. It can be also observed that the tensile strength decreased with increasing XNBR from low level (0 wt%) to high level (10 wt%) as PCT was 150°C. Therefore, it can be concluded that there is no interaction between XNBR and PCT; as seen in Table 3, p-value was obtained as 0.922, which is highly above 0.05.
In Figure 3(b), the graphical response surface analysis indicates that the increase of the graphene corresponds to a decrease of the tensile strength. Moreover, the increase of the tensile strength is negligible at medium values of XNBR as the graphene is 1.5 wt%. This is while in the absence of graphene, increase in XNBR leads to decrease in the tensile strength. Therefore, it can be concluded that there is an obvious interaction between GnPs and XNBR; as seen in Table 3, p-value is 0.000 and less than 0.05.
Tensile modulus
Figure 4 depicts the main effect of each factor on the tensile modulus. As can be observed from Figure 4(a), GnPs increased the tensile modulus continuously. Higher modulus, state of dispersion, and aspect ratio of nanoparticles are three crucial points to improve tensile modulus. 22 GnPs with high aspect ratio and good dispersion in the epoxy matrix increased the tensile modulus by ∼8%. In the study performed by Corcione et al., 40 epoxy matrix reinforced with GnPs at 1, 2, and 3 wt% showed higher tensile modulus compared to neat epoxy. In nanocomposite materials, proper dispersion of nanoparticles leads to improvement of tensile modulus. As can be seen from Figure 2(b), good dispersion of GnPs in the epoxy matrix increased the tensile modulus. 22 Tang et al. 41 investigated the effect of dispersion of graphene on the mechanical properties of graphene-reinforced epoxy composites. It was reported that high dispersion caused higher strength and modulus than poor dispersion.

The plot of the main effect for the tensile modulus against: (a) grapheme, (b) XNBR, (c) PCT, and (d) hardener. XNBR: carboxylated nitrile butadiene rubber; PCT: post curing temperature.
The influence of XNBR on the tensile modulus is exhibited in Figure 4(b). As expected, the modified rubber epoxy system had lower tensile modulus compared to neat epoxy. The tensile modulus results in Figure 4(b) show that the tensile modulus decreases as the rubbery phase weight percent increases. By the addition of 5 wt% XNBR, the tensile strength decreased ∼9% which can be related to the flexible chains and much lower modulus of XNBR particles. Further, compatibility of the rubber phase with the polymer matrix is a critical point that influences the tensile modulus reduction. Maximum reduction was ∼17% and occurred in 10 wt% of XNBR loading, which shows a good compatibility of the XNBR with the epoxy resin. Decrement in tensile modulus with increasing soft rubber content is reported by many researchers. 42,43
Figure 4(c) shows the effect of PCT on the epoxy tensile modulus. Generally, PCTs that are considered in this study had no significant effect on the tensile modulus; however, a slight drop was observed at high temperature, which might be attributed to degradation of the epoxy and destruction of the cross-links.
Variation of the tensile modulus against the amount of the hardener is shown in Figure 4(d). Increasing in amount of the hardener results in increasing the cross-link density of the system and actuates the system to a brittle one. As the amount of the hardener increased up to optimum value, the tensile modulus also increased slightly.
The 3-D response surface plots for the tensile modulus against Hardener × PCT and Graphene × XNBR are presented in Figure 5(a) and (b), respectively. According to Figure 5(a), it is observed that the tensile modulus decreased with increasing PCT from 130°C to 150°C as the hardener was 80 phr, while it considerably increased with increasing the hardener from 80 phr to 90 phr and then decreased as PCT was 150°C. It can be also observed that the tensile modulus decreased with increasing PCT from low level (130°C) to high level (150°C) as the hardener was 100 phr. Therefore, it can be concluded that there is no interaction between the hardener and PCT; as seen in Table 3, p-value is 0.640, which is much higher than 0.05.
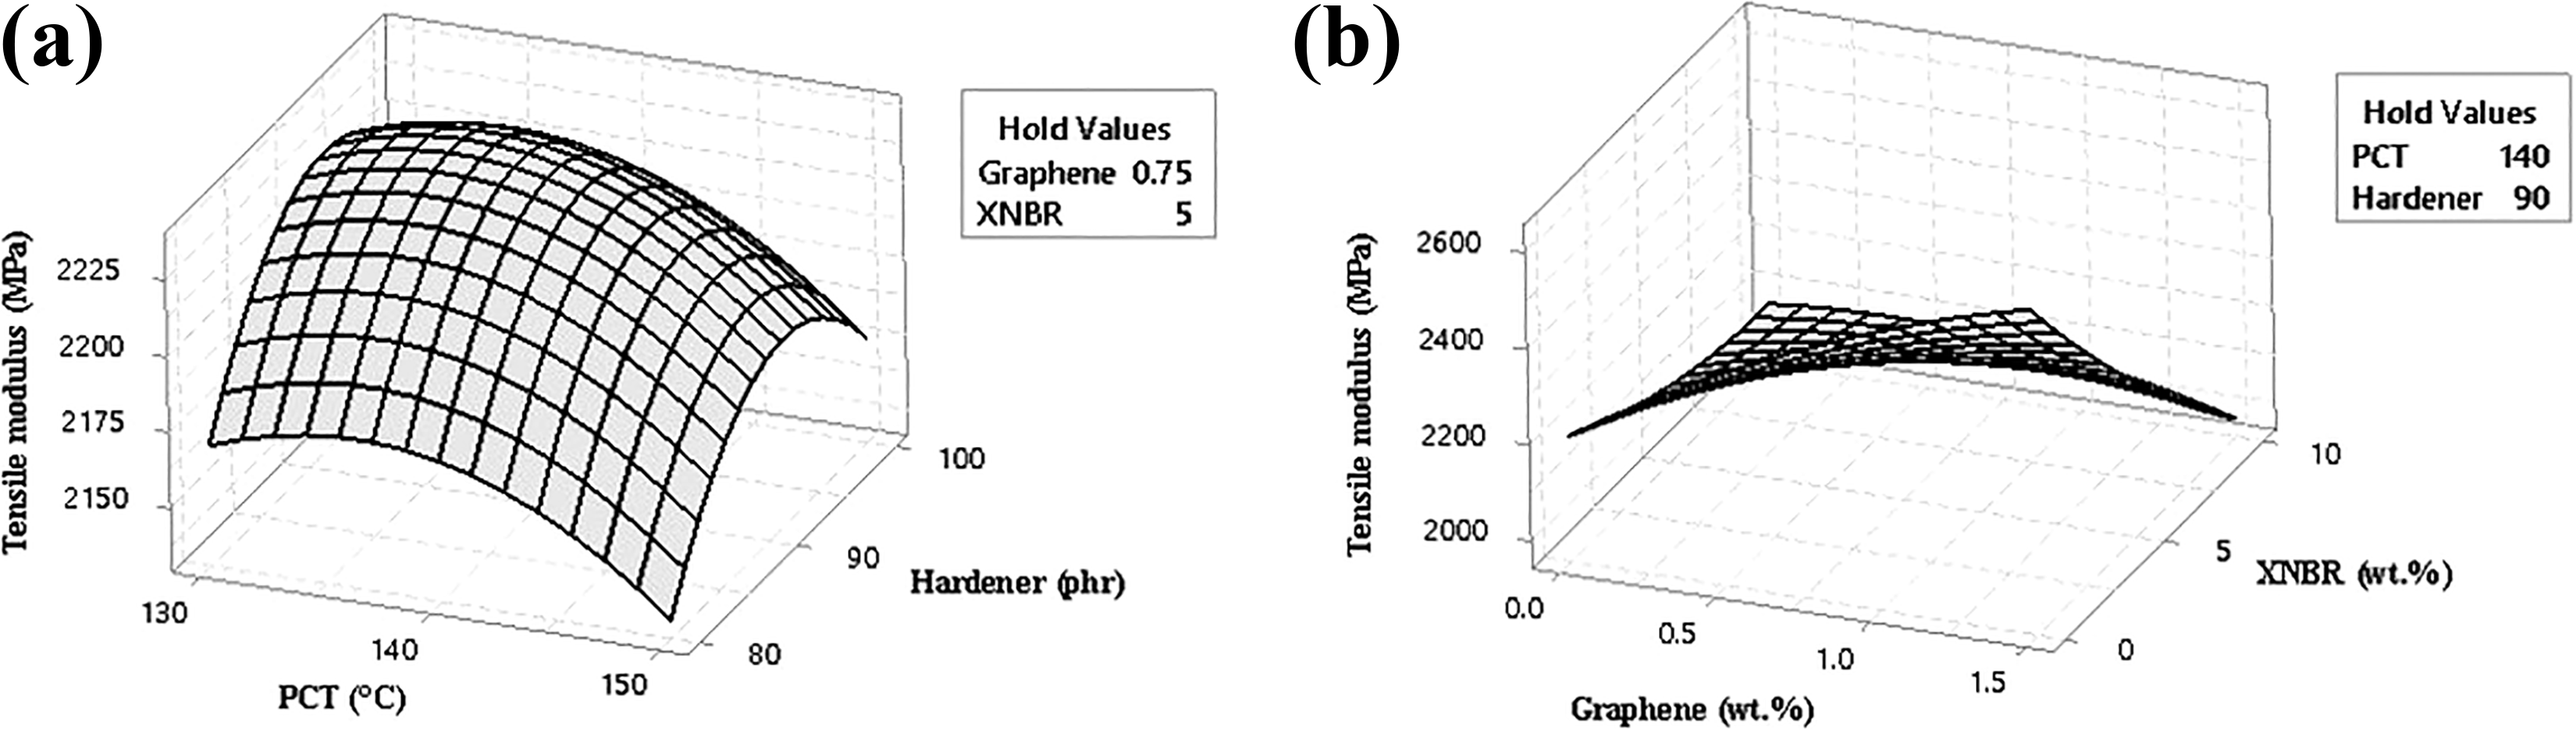
The surface plots of the tensile modulus versus: (a) PCT and hardener, and (b) graphene and XNBR. PCT: post curing temperature; XNBR: carboxylated nitrile butadiene rubber.
In Figure 5(b), the graphical response surface analysis indicates that the increase of the graphene corresponds to an increase of the tensile modulus as XNBR was at low level (0 wt%). Moreover, in the presence of the graphene at 1.5 wt%, increasing XNBR from low to high level led to decreased tensile modulus. However, in the absence of the graphene, increasing XNBR had slight effect on the tensile modulus. Therefore, it can be concluded that there is an obvious interaction between XNBR and graphene, and as seen in Table 3, p-value is 0.000 and less than 0.05. Generally, according to Figure 5(b), the maximum values of the tensile modulus are obtained at low level of XNBR (0 wt%) and high level of the graphene (1.5 wt%).
Elongation at break
Behavior of the elongation at break against each variable is plotted in Figure 6. As can be seen from Figure 6(a), the elongation at break is sensitive to nanoparticles content. The presence of GnPs in the epoxy matrix declined the elongation at break. At high content of GnPs, the elongation at break decreased about 22% compared to neat epoxy. Adding GnPs increases rigidity of the system and causes the epoxy to become more brittle and, thus, results in lower elongation at break. 44 Reduction in the elongation at break by the addition of GnPs is also reported by Zaman et al. 45

The plot of the main effect for the elongation at break against: (a) graphene, (b) XNBR, (c) PCT, and (d) hardener. XNBR: carboxylated nitrile butadiene rubber; PCT: post curing temperature.
As can be seen in Figure 6(b), the elongation at break increased significantly by adding XNBR. In general, adding rubber enhances ductility of blends due to its softer and more elastic phase and increases the elongation at break of the rubber modified system. 23,46 In this study, addition of 10 wt% XNBR enhanced the elongation at break by approximately 49% compared to neat epoxy.
The elongation at break for different PCTs and hardener contents is plotted in Figure 6(c) and (d), respectively. Since increased temperature of the post cure and hardener amount results in increment of the cross-link density, the elongation at break declined in high levels of PCT and the hardener. High cross-link density makes the epoxy system brittle and allows for the reduction of the elongation at break. From Figure 6(c), increasing PCT up to 138°C had no significant effect on the elongation at break, while approximately 9% reduction in high PCT (150°C) compared to 130°C was observed. According to Figure 6(d), it appears that optimum value of the hardener, which does not decrease the elongation at break, is about 80–86 phr. However, approximately 12% drop was observed at high content of the hardener (100 phr) compared to 80 phr.
Figure 7 shows the response surface plots for the elongation at break versus Graphene × XNBR and Graphene × hardener, respectively. According to Figure 7(a), it is observed that the elongation at break considerably increased with increasing XNBR from 0 wt% to 10 wt% as the graphene was absent, while it increased slightly with increasing XNBR from 0 wt% to 10 wt% as the graphene was 1.5 wt%. Therefore, it can be concluded that there is an interaction between the graphene and XNBR; as seen in Table 3, p-value is 0.047 and less than 0.05.

The surface plots of the elongation at break versus: (a) XNBR and hardener, and (b) graphene and hardener. XNBR: carboxylated nitrile butadiene rubber.
In Figure 7(b), the surface plot indicates that the increase of the graphene content leads to a significant decrease in the elongation at break as the hardener was at low level (80 phr). Moreover, in the presence of the graphene at 1.5 wt%, increasing the hardener from low to medium level led to slight increase in the elongation at break, which shows the interaction between these two variables. It can also be concluded from Table 3 that the p-value for GnPs × Hardener is 0.014 and less than 0.05.
Contour plots for tensile properties
A contour plot is a graphic representation of relationships among some numeric variables in two dimensions. Contour plots are useful for the creation of desirable responses. They show the contribution of two factors simultaneously, while preserving other factors at their average levels.
Tensile strength
The contour plots of the tensile strength are presented in Figure 8. Since four variables are considered in this study, variation of the tensile strength is plotted against two of the variables, while the two other variables are kept hold. The hold values are shown in the legend.

The contour plots of the tensile strength versus: (a) XNBR and grapheme, (b) PCT and grapheme, (c) hardener and grapheme, (d) PCT and XNBR, (e) hardener and XNBR, and (f) hardener and PCT. XNBR: carboxylated nitrile butadiene rubber; PCT: post curing temperature.
Figure 8(a) shows the contour plot of the tensile strength as a function of the XNBR and GnPs content in the hardener content of 90 phr and PCT of 140°C. Clearly, addition of XNBR and GnPs at high contents decreases the tensile strength, and the best result for the tensile strength is obtained at low content of XNBR and GnPs. Figure 8(b) presents the tensile strength against PCT and GnPs in hold values of 90 phr hardener and 5-wt% XNBR. According to this figure, samples consisting of low content of graphene, about 0.7 wt%, in the PCT range of 135–145°C have higher tensile strength. Figure 8(c) demonstrated that to have higher tensile strength, optimum value of the hardener and graphene should be approximately 89 phr and 0.7 wt%, respectively (XNBR and PCT are kept in 5 wt% and at 140°C, respectively). Variation of the tensile strength against PCT × XNBR and Hardener × XNBR is shown in Figure 8(d) and (e), respectively. As can be observed from Figure 8(d) and (e), due to the demand for high tensile strength, the optimum value of XNBR is about 0–4 wt% when PCT is approximately 140°C and the hardener is approximately 89 phr, respectively. Figure 8(f) illustrates that when the graphene and XNBR are 0.75 and 5 wt%, respectively, to maximize the tensile strength, PCT should be at 140°C, and ∼89 phr of the hardener should be used.
Tensile modulus
The contour plots of the tensile modulus are presented in Figure 9. By considering the hold values for each plot, which are shown in the legend, Figure 9(a) indicates that the best result and maximum improvement (about 22%) in the tensile modulus is obtained at high content of GnPs and very low content of XNBR. By considering the hold values of Figure 9(b) and (c), it is demonstrated that improvement in the tensile modulus by adding GnPs is not correlated with PCT and amount of the hardener, respectively. As can be seen from Figure 9(d), high tensile modulus is achieved at low content of XNBR, and the improvement (about 17%) is occurred in the wide PCT range of 130–150°C. Figure 9(e) shows the same trend like Figure 9(d). To maximize the tensile modulus, about 81–100 phr of the hardener and low content of XNBR (about 0–1 wt%) should be used. Furthermore, Figure 9(a), (d), and (e) illustrated that the high content of XNBR had the most negative effect on the tensile modulus (∼8% reduction in the tensile modulus). The effect of Hardener × PCT is plotted in Figure 9(f). As can be observed from this figure, the wide range of the hardener (about 84–100 phr) and PCT (about 130–148°C) can enhance the tensile modulus by approximately 4%.

The contour plots of the tensile modulus versus: (a) XNBR and grapheme, (b) PCT and grapheme, (c) hardener and grapheme, (d) PCT and XNBR, (e) hardener and XNBR, and (f) hardener and PCT. XNBR: carboxylated nitrile butadiene rubber; PCT: post curing temperature.
Elongation at break
The contour plots of the elongation at break are shown in Figure 10. By considering the hold values for each plot, which are shown in the legend, Figure 10(a) indicates the variation of the elongation at break against XNBR and GnPs. According to this figure, maximum improvement of the elongation at break (∼46%) can be gained at high content of the rubber phase (about 9–10 wt% of XNBR) and low content of GnPs (about 0–0.6 wt%). From Figure 10(b), approximately 29% enhancement in the elongation at break can be achieved in about 0–0.2 wt% of GnPs and low level of PCT (130–136°C). Figure 10(c) illustrates that the improvement by approximately 29% can be obtained at low content of the hardener (80–88 phr) and graphene (0–0.4). The influence of PCT × XNBR is plotted in Figure 10(d), which shows that high content of XNBR (∼10 wt%) and wide range of PCT (130–150°C) are required to maximize the elongation at break. Figure 10(e) demonstrates that to maximize the elongation at break, 10 wt% of XNBR and wide range of the hardener (80–95 phr) should be used. Furthermore, according to Figure 10(a), (d), and (e), when XNBR content is low, high level of GnPs, PCT, and hardener results in maximum reduction (∼14%) of the elongation at break. Figure 10(f) depicts that the hardener of about 80–92 phr and PCT of 130–144°C are proper ranges to improve the elongation at break.

The contour plots of the elongation at break versus: (a) XNBR and grapheme, (b) PCT and grapheme, (c) hardener and grapheme, (d) PCT and XNBR, (e) hardener and XNBR, and (f) hardener and PCT. XNBR: carboxylated nitrile butadiene rubber; PCT: post curing temperature.
Conclusion
RSM was used to study the influence of four factors including GnPs, XNBR, hardener contents, and PCT on the tensile properties of epoxy/GnPs/XNBR nanocomposites. The contour plots of the tensile strength, tensile modulus, and elongation at break were used to determine the optimum case for each response. The results are briefly explained as follows.1. It was revealed that the GnPs had a good dispersion in the matrix at 0.75 wt%, although some agglomeration was found at the 1.5 wt% of GnPs which caused a reduction in tensile properties of the nanocomposites.
Adding 1.5 wt% of GnPs had positive effect on the tensile modulus of the epoxy matrix (∼8% improvement) and decreased the tensile strength and elongation at break by approximately 7% and 22%, respectively.
Among all the control parameters, XNBR was found to be the most effective one. Presence of 10 wt% of XNBR in the epoxy matrix decreased the tensile strength and modulus by approximately 10% and 17%, respectively. On the other hand, the elongation at break was enhanced by the considerable amount of ∼49%.
It was observed that PCT and the hardener had no significant effect on the tensile properties, as compared to GnPs and XNBR. Although, the best tensile properties were achieved at PCT of approximately 140°C. Furthermore, the optimum value of the hardener was found to be approximately 90 phr.
The best tensile strength of ternary nanocomposites was obtained in the hardener of 90 phr, PCT of 140°C, and low content of GnPs (0–0.3 wt%) and XNBR (0–2.6 wt%).
The tensile modulus had approximately 22% enhancement compared to neat epoxy and was obtained using 1.5 wt% of GnPs, very low content of XNBR, and medium level of the hardener and PCT parameters.
The maximum elongation at break of ternary nanocomposites was found in 10 wt% of XNBR, low content of GnPs (about 0–0.6), medium level of the hardener, and wide range of PCT (about 130–140°C).
Nanocomposite with these properties can provide a good balance of impact resistance and tensile properties for specific applications.
Footnotes
Declaration of conflicting interests
The author(s) declared no potential conflicts of interest with respect to the research, authorship, and/or publication of this article.
Funding
The author(s) received no financial support for the research, authorship, and/or publication of this article.