
Abstract
In this work, the effect of fumed silica on the long-term resistance of high-density polyethylene was investigated. Different amounts of functionalized fumed silica nanoparticles were dispersed in a high-density polyethylene matrix by melt compounding, and compression molded specimens were tested under tensile mode in the quasi-static ramp and creep conditions. In particular, tensile tests at different speeds and temperatures and the subsequent application of the modified Ree–Eyring model allowed the determination of an analytical expression correlating the strain rate with the yield stress and the testing temperature. It was demonstrated that the introduction of fumed silica led to a significant drop in the deformation rate, especially at elevated filler amounts. Creep tests showed that the nanofiller addition led to a progressive reduction of the critical deformation values. The application of this engineering approach evidenced how nanosilica introduction led to a systematic increase of the time-to-failure values, and good accordance between theoretical prediction and experimental measurements was found.
Introduction
Polyethylene is one of the most widely used thermoplastics because of its combination of low cost, high chemical resistance, and relatively good mechanical properties. 1 One of the most important applications for this polymer is the production of pipes and fittings for the transportation of water or gas under pressure, for which creep stability is one of the critical issues. In many technological applications, thermoplastic materials are intended to sustain long-lasting constant loads with limited deformation, and in many cases, the poor creep resistance could represent a severe limitation. 2 Therefore, the comprehension of the failure mechanisms in thermoplastics and their modelization represents a key issue for the development of high-performance components.
It is generally known that failure mechanisms in polymers are strongly dependent on the stress level. 3,4 At relatively high loads, the failure mode is ductile and it is characterized by large, local plastic deformation, and the final failure occurs by ductile tearing of the sample (mode I failure). At lower stress levels, the failure is related to slow crack growth, which is classified as brittle behavior (mode II). In that case, failure is caused by stable growth of a crack resulting in a through-wall slit in radial direction. At even lower stress levels, the failure is largely driven by chemical/molecular degradation of the polymer (mode III), leading to a reduction of molar mass and to the final disintegration of the component by a multitude of cracks. For many applications, mode I failure is the most interesting because it is referred to materials operating at stress levels near the stress at break (σb) determined in quasi-static conditions.
These concepts are particularly important in piping applications. According to ISO/TR 9080, the extrapolated stress level at which the lifetime at 20°C is 50 years is referred to as the minimal required strength (MRS). Sometimes additional certifications are given, for example, for high-density polyethylene (HDPE), if at 50 years, the MRS is over 10 MPa or 100 bar, it is called PE100. Generally speaking, these tests are very expensive and time-consuming, and they are not suitable as a tool in material selection and optimization.
A possible solution could be the development of models and protocols able to predict long-term failure on the basis of short-term testing. In a method recently proposed by Govaert and colleagues, 5 the yield behavior of thermoplastic materials was described using a pressure-modified Eyring relation that links the applied deformation rate to the yield stress and, vice versa, the applied stress to the plastic deformation rate. In combination with a critical strain to limit the development of plastic strain, an effective lifetime prediction tool is obtained. This approach has been successfully applied in polycarbonate (PC), unplasticized poly(vinyl chloride) and poly(lactic acid). 5,6 Recently, this approach has been also proposed to predict the time-to-failure of a glass fiber-reinforced glassy polymer (i.e. a poly-phenylene-ether/polystyrene (PS) blend) 7 and to model the long-term performance and durability of PC/carbon nanotube nanocomposites. 8
In recent years, it has been widely demonstrated that the addition of relatively small amounts of nanoparticles could be an effective solution for improving the creep and the failure resistance of thermoplastic matrices. 2,9,10 For example, titania nanoparticles have been proved to markedly reduce the creep compliance of nylon 66, whereas alumina nanoparticles effectively reduced the creep compliance of PS. 11 –15 Also our research group has documented a marked reduction of the creep compliance of HDPE filled with submicrometric titania particles 1,16 and organoclays. 17 It is generally believed that nanoparticles may effectively restrict the motion of polymer chains with positive effects on the mechanical stability of the material. Relatively less attention was devoted to the development of fumed silica-based nanocomposites. Fumed silica nanoparticles exist in a wide range of size (specific area ranging from 50 m2 g−1 to 400 m2 g−1) and with a variety of surface treatments from hydrophilic to hydrophobic. Due to its fractal structure and high-specific area, fumed silica is subjected to self-aggregation and can consequently form a network of interacting particles in the molten polymer. 18 In the last years, it was largely demonstrated that the introduction of relatively small amounts of silica nanoparticles can strongly improve the thermomechanical behavior of polyolefins, and some theoretical models were developed to explain the obtained results. 19 –23
On the basis of these considerations, the objective of the present work is to apply the theoretical model recently proposed by Govaert and colleagues 6 to HDPE-based fumed silica nanocomposites to assess the effective influence of these nanoparticles on the long-term resistance (lifetime) of these materials.
Theoretical background
It is well-known that the mechanical response of a material strongly depends on the loading conditions. Generally speaking, in a quasi-static tensile test, the sustained stress increases with the strain rate and for a creep experiment, the overall deformation rate increases, and the lifetime decreases, with increasing load. Therefore, the yield stress is observed to increase linearly with the logarithm of the strain rate, while the time-to-failure depends linearly on the applied creep stress, with an identical, but negative, slope (see Figure 1(a) and (b)). 24 Considering that also the temperature dependence is the same, it can be concluded that both phenomena follow the same kinetics. 5
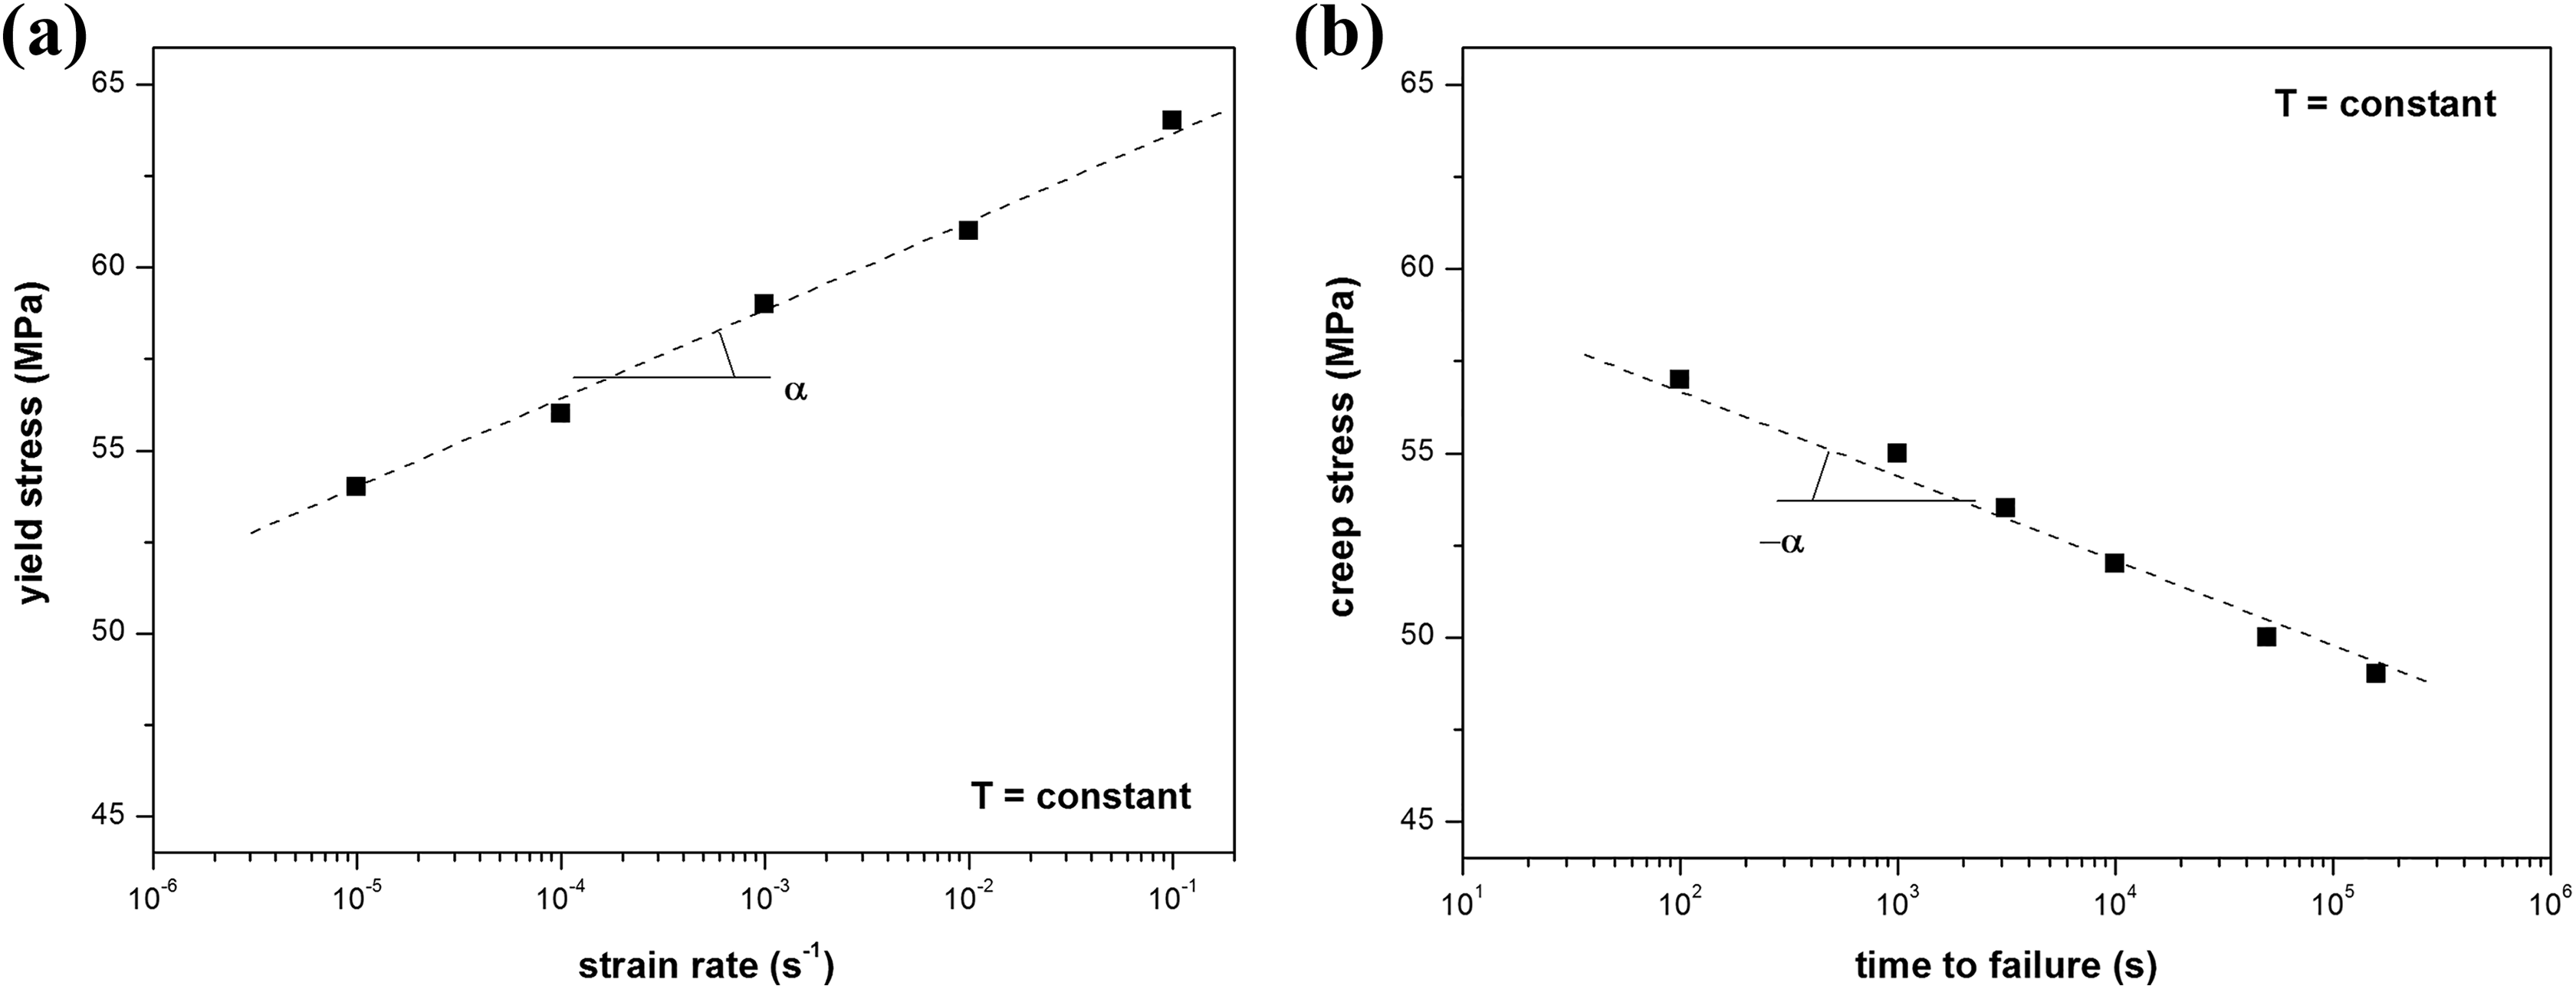
Dependency of (a) the yield stress for the strain rate in tensile tests and of (b) the time-to-failure for the applied stress in a creep test on polycarbonate samples.
When the stress is increased in a quasi-static tensile test, changes in chain conformation start to contribute to the deformation (plastic deformation). Increasing the stress, the mobility continues to increase until the yield point (σ ys) when the deformation rate is equal to the applied strain rate. Therefore, at the yielding conditions, the applied stress determines a state of mobility resulting in a steady state of plastic flow. The magnitude of this plastic strain rate does not only depend on the stress but also on the temperature.
In creep experiments, three distinct regions can be generally visualized, that is, a decreasing strain rate (primary creep), until a steady value (secondary creep) was reached, and upon further straining geometrical and/or intrinsic softening occurs, leading to an increase in strain rate until failure (tertiary creep). During secondary creep, the strain rate reaches a constant, minimum strain rate (ε′min), which indicates a steady state of plastic flow (ε′pl). 25
As demonstrated by Bauwens-Crowet et al., 26 the strain rate dependence of the yield stress, obtained from quasi-static tensile tests at constant strain rate, combined with the stress dependency of the plastic strain rate, obtained from creep tests under constant static load, yield exactly the same curve (see Figure 2). This indicates that the steady state reached in creep tests is equivalent to the steady state reached in tensile tests.

Comparison of yield stress/strain rate relationship in a tensile test and of the constant stress/minimum strain rate relationship for a generic material.
The linear relation between the yield stress and the logarithm of the applied strain rate implies a non-Newtonian flow. The application of the Eyring’s activated flow theory allows the description of the material behavior with its strain rate and temperature dependence, 27 as reported in equation (1):

where k is the Boltzmann constant, taken as 1.381·× 10−23 J K−1, T is the absolute temperature,


Dependency of the yield stress from the strain rate for a generic material with multiple molecular processes.
The rate dependence of the system can now be easily described as a combination of the two individual processes, both described with the Eyring theory and with their own activation energy (Ux ), activation volume (Vx ) and pre-exponential factor ε′0x, where x = I, II,…. In equation (2), the function sinh−1(x) can be approximated with ln(2x), if x >> 1.
It has been observed 29 that in creep rupture, the time-to-failure multiplied by the strain rate at failure is constant, regardless of the applied stress level (see equation (3)):

where t f is the time-to-failure, and ε′f (σ) is the strain rate at failure (see Figure 4).

Graphical procedure for the determination of the time-to-failure in creep tests.
It was demonstrated in the literature 30 that the ratio between the strain rates at failure is the same as the ratio between the minimal strain rates for the applied loads and therefore also the ratio of the minimal strain rate (ε′min) and the time-to-failure is constant for different applied stresses, as shown in equation (4):

The steady state at the minimum strain rate during creep is equal to the state at the yield stress during a constant strain rate experiment, or ε′min = ε′pl. It is, therefore, possible to extrapolate the data and use it to find the steady-state creep rates for different applied stresses and temperatures. A critical strain (ε cr) can be, therefore, introduced to make lifetime predictions, as reported in equation (5):

Therefore, the final expression of the time-to-failure as a function of the applied stress and of the temperature can be expressed, as reported in equation (6):

Note that, as shown in Figure 4, this critical strain is actually smaller than the real plastic strain at failure, because, in tertiary creep, the strain rate gradually increases. But this fictive measure enables to quantitatively predict the time-to-failure by using the stress dependence of the plastic flow. Therefore, to be able to make lifetime predictions according to the proposed approach, quasi-static tensile tests at different strain rates and temperatures should be performed to determine the strain rate dependence of the yield stress and to determine corresponding Eyring parameters. Creep tests should be then carried out to determine the critical strain (ε cr) for every tested material.
Experimental part
Materials
An Eltex® A 4009 MFN 1325 HDPE (density 0.960 g cm−3, melt flow index (MFI) at 190°C and 2.16 kg 0.9 g 10−1 min), supplied by Ineos Polyolefins (UK) in the form of white powder, was used as a polymer matrix. On the basis of a previous study on the thermomechanical properties of HDPE-fumed silica nanocomposites, 20 Aerosil® r974 fumed silica nanoparticles, supplied by Degussa (Hanau, Germany), were selected. This is a particulate nanofiller constituted by aggregates of equiaxic primary nanoparticles having a mean size of 12 nm (SiO2 content 99.8%). These nanoparticles are characterized by a surface area of 170 m2 g−1 and were surface treated with dimethyldichlorosilane, for a total carbon content between 0.7 wt% and 1.3 wt%, and pH value in 4 wt% aqueous solution of 3.7–4.7. This nanopowder is characterized by a bulk density of 1.99 g cm−3 and a tapped density of 60 g l−1. Both matrix and nanoparticles were utilized as received.
Samples preparation
Polyethylene–silica nanocomposites were prepared by a melt compounding process, through a Haake PolyLab system (Karlsruhe, Germany) consisting of a Rheomix 600 internal mixer and a Rheocord 300p control module for continuous monitoring of torque, motor speed, and temperature. Both neat HDPE and relative nanocomposites with different silica amounts (2 and 5 vol%) were melt-mixed for 10 min at a temperature of 155°C and a rotor speed of 60 r min−1. Square sheet samples with a mean thickness of 0.8 mm were then obtained by compression molding for 10 min at 155°C in a Carver laboratory press (Wabash, Indiana, USA) under an applied pressure of 0.2 kPa. The obtained samples were then thermally treated at 100°C for 24 h and slowly cooled to room temperature to relax any residual stress possibly generated by the compression molding and to complete the crystallization process. For shortness, the neat matrix was denoted as HDPE, while nanocomposites were designated as HDPE followed by the silica type (Ar974) and the filler content. For example, HDPE-Ar974-2 indicates the nanocomposite sample filled with the 2 vol% of Aerosil r974 fumed silica nanoparticles.
Experimental methodologies
MFI measurements were performed by a Dynisco Kayeness melt flow indexer at 190°C under a weight of 2.16 kg. At least 10 measurements were conducted for each sample.
Quasi-static tensile tests were carried out to determine the dependency of the strain rate from the yield stress and the temperature (i.e. the ε′ = f(σ y, T) function), by using the Ree–Eyring equation (see “Theoretical background” section). An Instron 4502 tensile testing machine, equipped with a load cell of 1 kN, was utilized and ISO 527 1BA dogbone specimens, having a gage length of 30 mm, were tested at different strain rates and temperatures. In Table 1, the selected testing conditions are summarized. The yield stress (σ ys) was determined as the maximum load reached after the elastic region (i.e. the zero slope point in the stress–strain curves).
Testing conditions of quasi-static tensile tests on HDPE and relative nanocomposites.
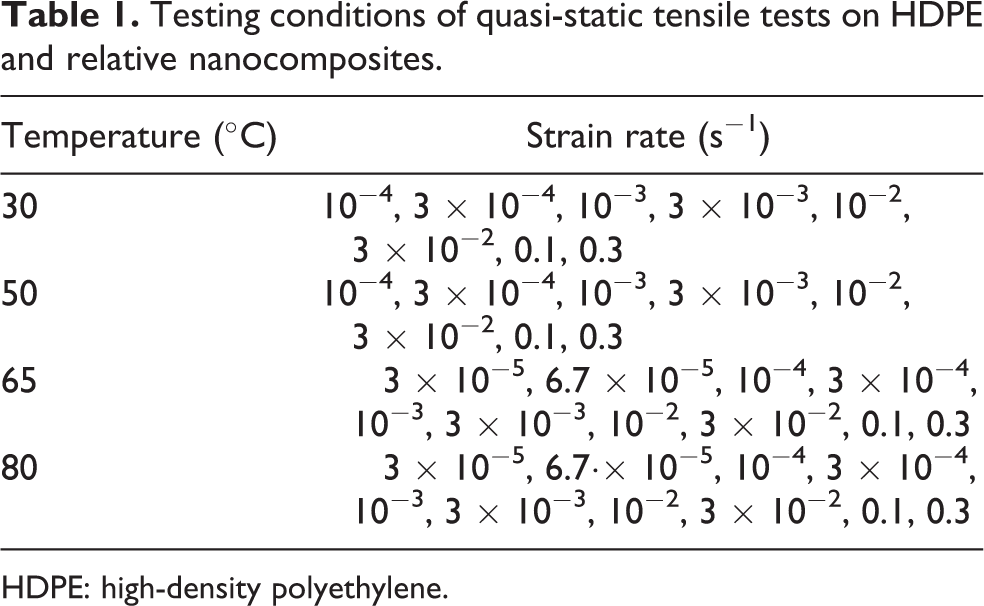
HDPE: high-density polyethylene.
Creep tests were performed to determine the critical deformation values (ε cr) of the tested samples. In principle, only one test could be sufficient to determine ε cr for each composition, but it was preferred to conduct creep tests at different temperatures and various loads. Also, in this case, an Instron 4502 electromechanical testing machine was utilized and 1BA dogbone specimens were tested. Creep tests were carried out at the same temperatures of the tensile tests (i.e. 30, 50, 65, and 80°C), applying stress levels between 0.8σ ys and 0.4σ ys, where σ ys is the yield stress of the neat HDPE at ε′ of 0.1 s−1, determined at the same temperature of the creep test.
Results and discussion
Melt flow index measurements
It is well-known that the addition of nanofillers into polymeric matrices could profoundly affect their workability. Therefore, MFI measurements were performed to evaluate the processability of the materials upon nanofiller addition. In Table 2, the results of MFI evaluation on neat HDPE and relative nanocomposites are reported. Considering the standard deviation values associated with these measures, it can be concluded that the viscosity of nanofilled samples is very close to that of the neat matrix. Therefore, the processability of the pristine materials is substantially retained upon nanofiller addition.
Results of MFI measurements on HDPE and relative nanocomposites.

MFI: melt flow index; HDPE: high-density polyethylene.
Quasi-static tensile tests
In Figure 5(a), representative stress–strain curves at 30°C of HDPE samples tested at different speeds are reported, while the corresponding curves for the nanocomposite samples are reported in Figure 5(b) and (c). As it is well documented in the scientific literature, an increase of the testing speed produces a positive shift of the yield stress, because the mobility of the macromolecules is hindered at high deformation rates. Considering the experimental curves of the nanocomposite samples, it is interesting to note that at elevated testing speeds, the materials reach the failure condition immediately after the yield point without showing a plastic plateau region. This is probably due to the embrittlement effect produced by nanofiller addition at high concentrations. It is also clear that imposing higher strain rates or increasing the nanosilica content over the 5 wt% strongly modifies the failure mode of the material from a plastic to a brittle fracture. Under these conditions, the proposed approach for the description of the ductile fracture behavior of polymeric materials would not be valid anymore. 6
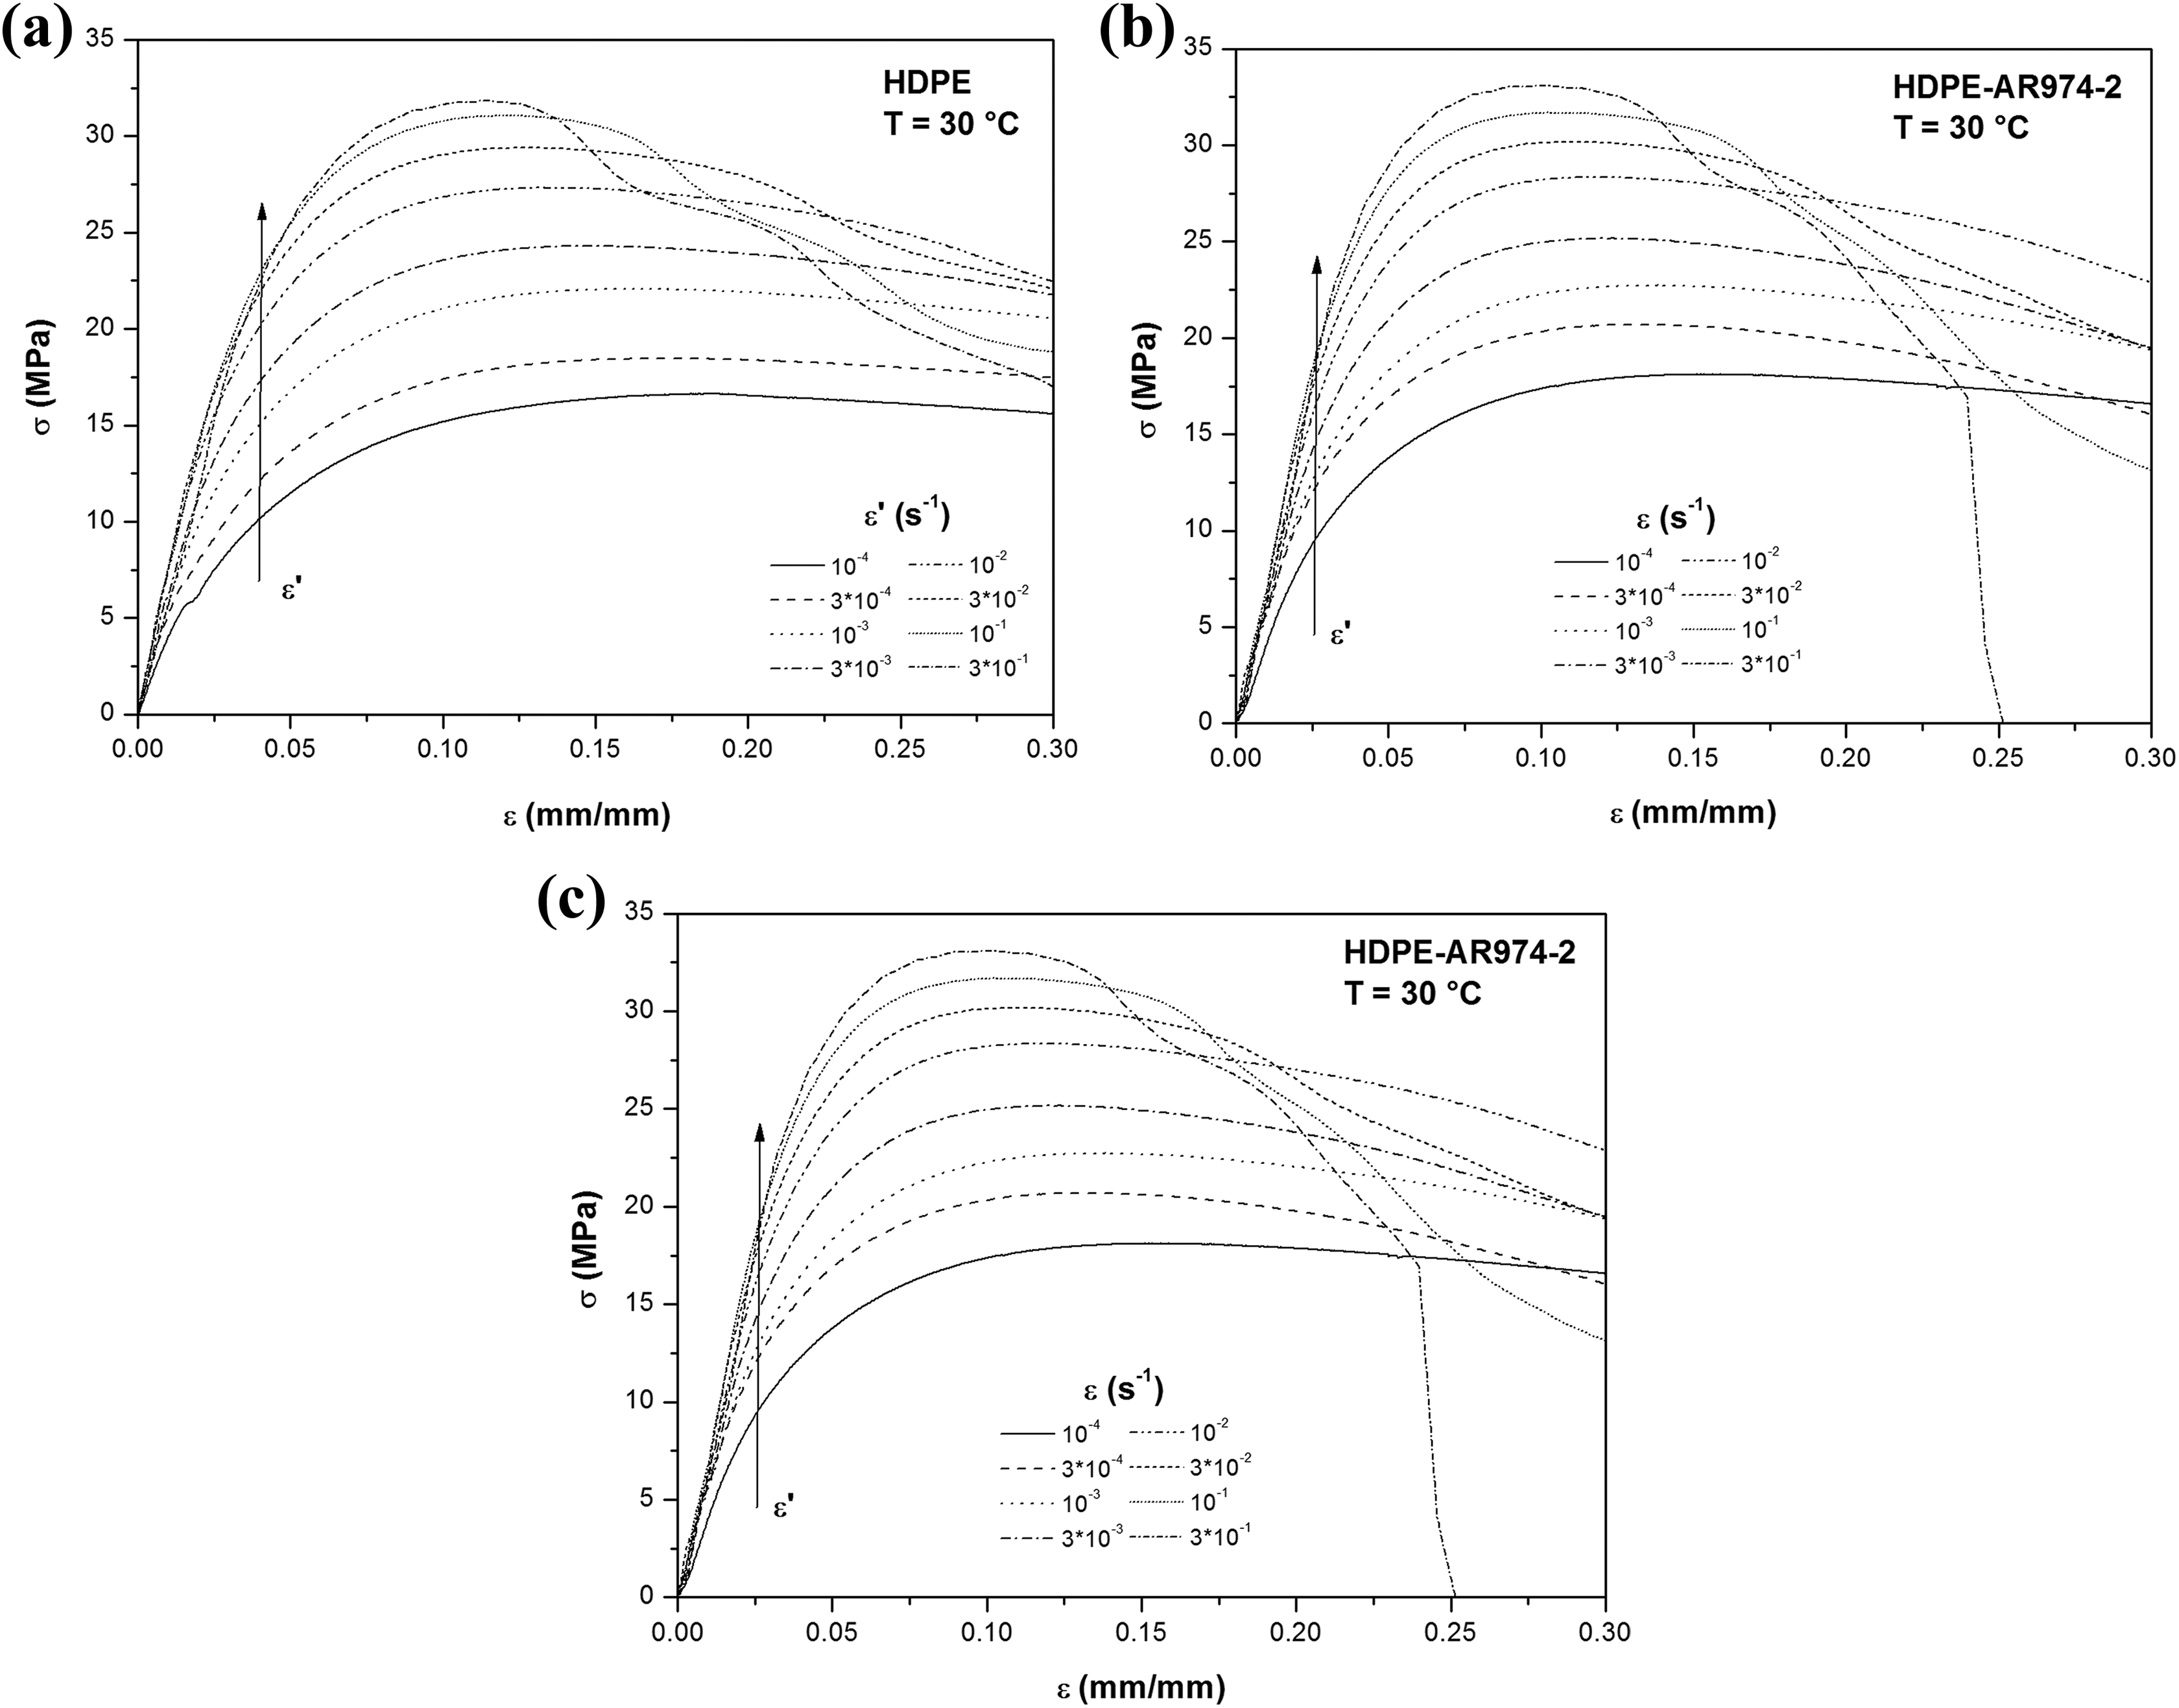
Representative stress–strain curves at 30°C of (a) HDPE, (b) HDPE-AR974-2, and (c) HDPE-AR974-5 from quasi-static tensile tests at different testing speeds. HDPE: high-density polyethylene.
To give a complete overview of the obtained results, in Figure 6(a) to (d), the dependency of the yield stress (σys) from the strain rate of HDPE and relative nanocomposites at the different testing temperatures is shown. As already reported by our group in previous works on polyethylene-based nanocomposites, 2,9,19,20,31 an increase of the nanofiller amount determines a systematic enhancement of the yield stress. As expected, an increase of the testing temperatures promotes a generalized drop of the yield point. It is interesting to note that σ ys trends at 30°C show a substantially linear trend over the whole range of testing speeds, regardless of the nanofiller amount. It is therefore absent in the transition from the region I plastic deformation (at lower strain rate) to the region I + II deformation mode, and all the tested materials plastically deform according to the I + II mechanism (for further clarifications, see “Theoretical background” section). At 50°C, the beginning of the change of the slope of the σ ys − ε′ curves is visible only at ε′ levels lower than 3 × 10⁻³ s−1, while at 65°C and 80°C, the transition of the plastic deformation mode is evident and shifted toward higher strain rates. It is known that the region II plastic deformation mechanism is ruled by the α-transition, due to the migration of Gauche defects on the macromolecules over the whole crystalline lattice. This transition generally hinders the mode II plastic deformation at high temperatures and/or low strain rates.
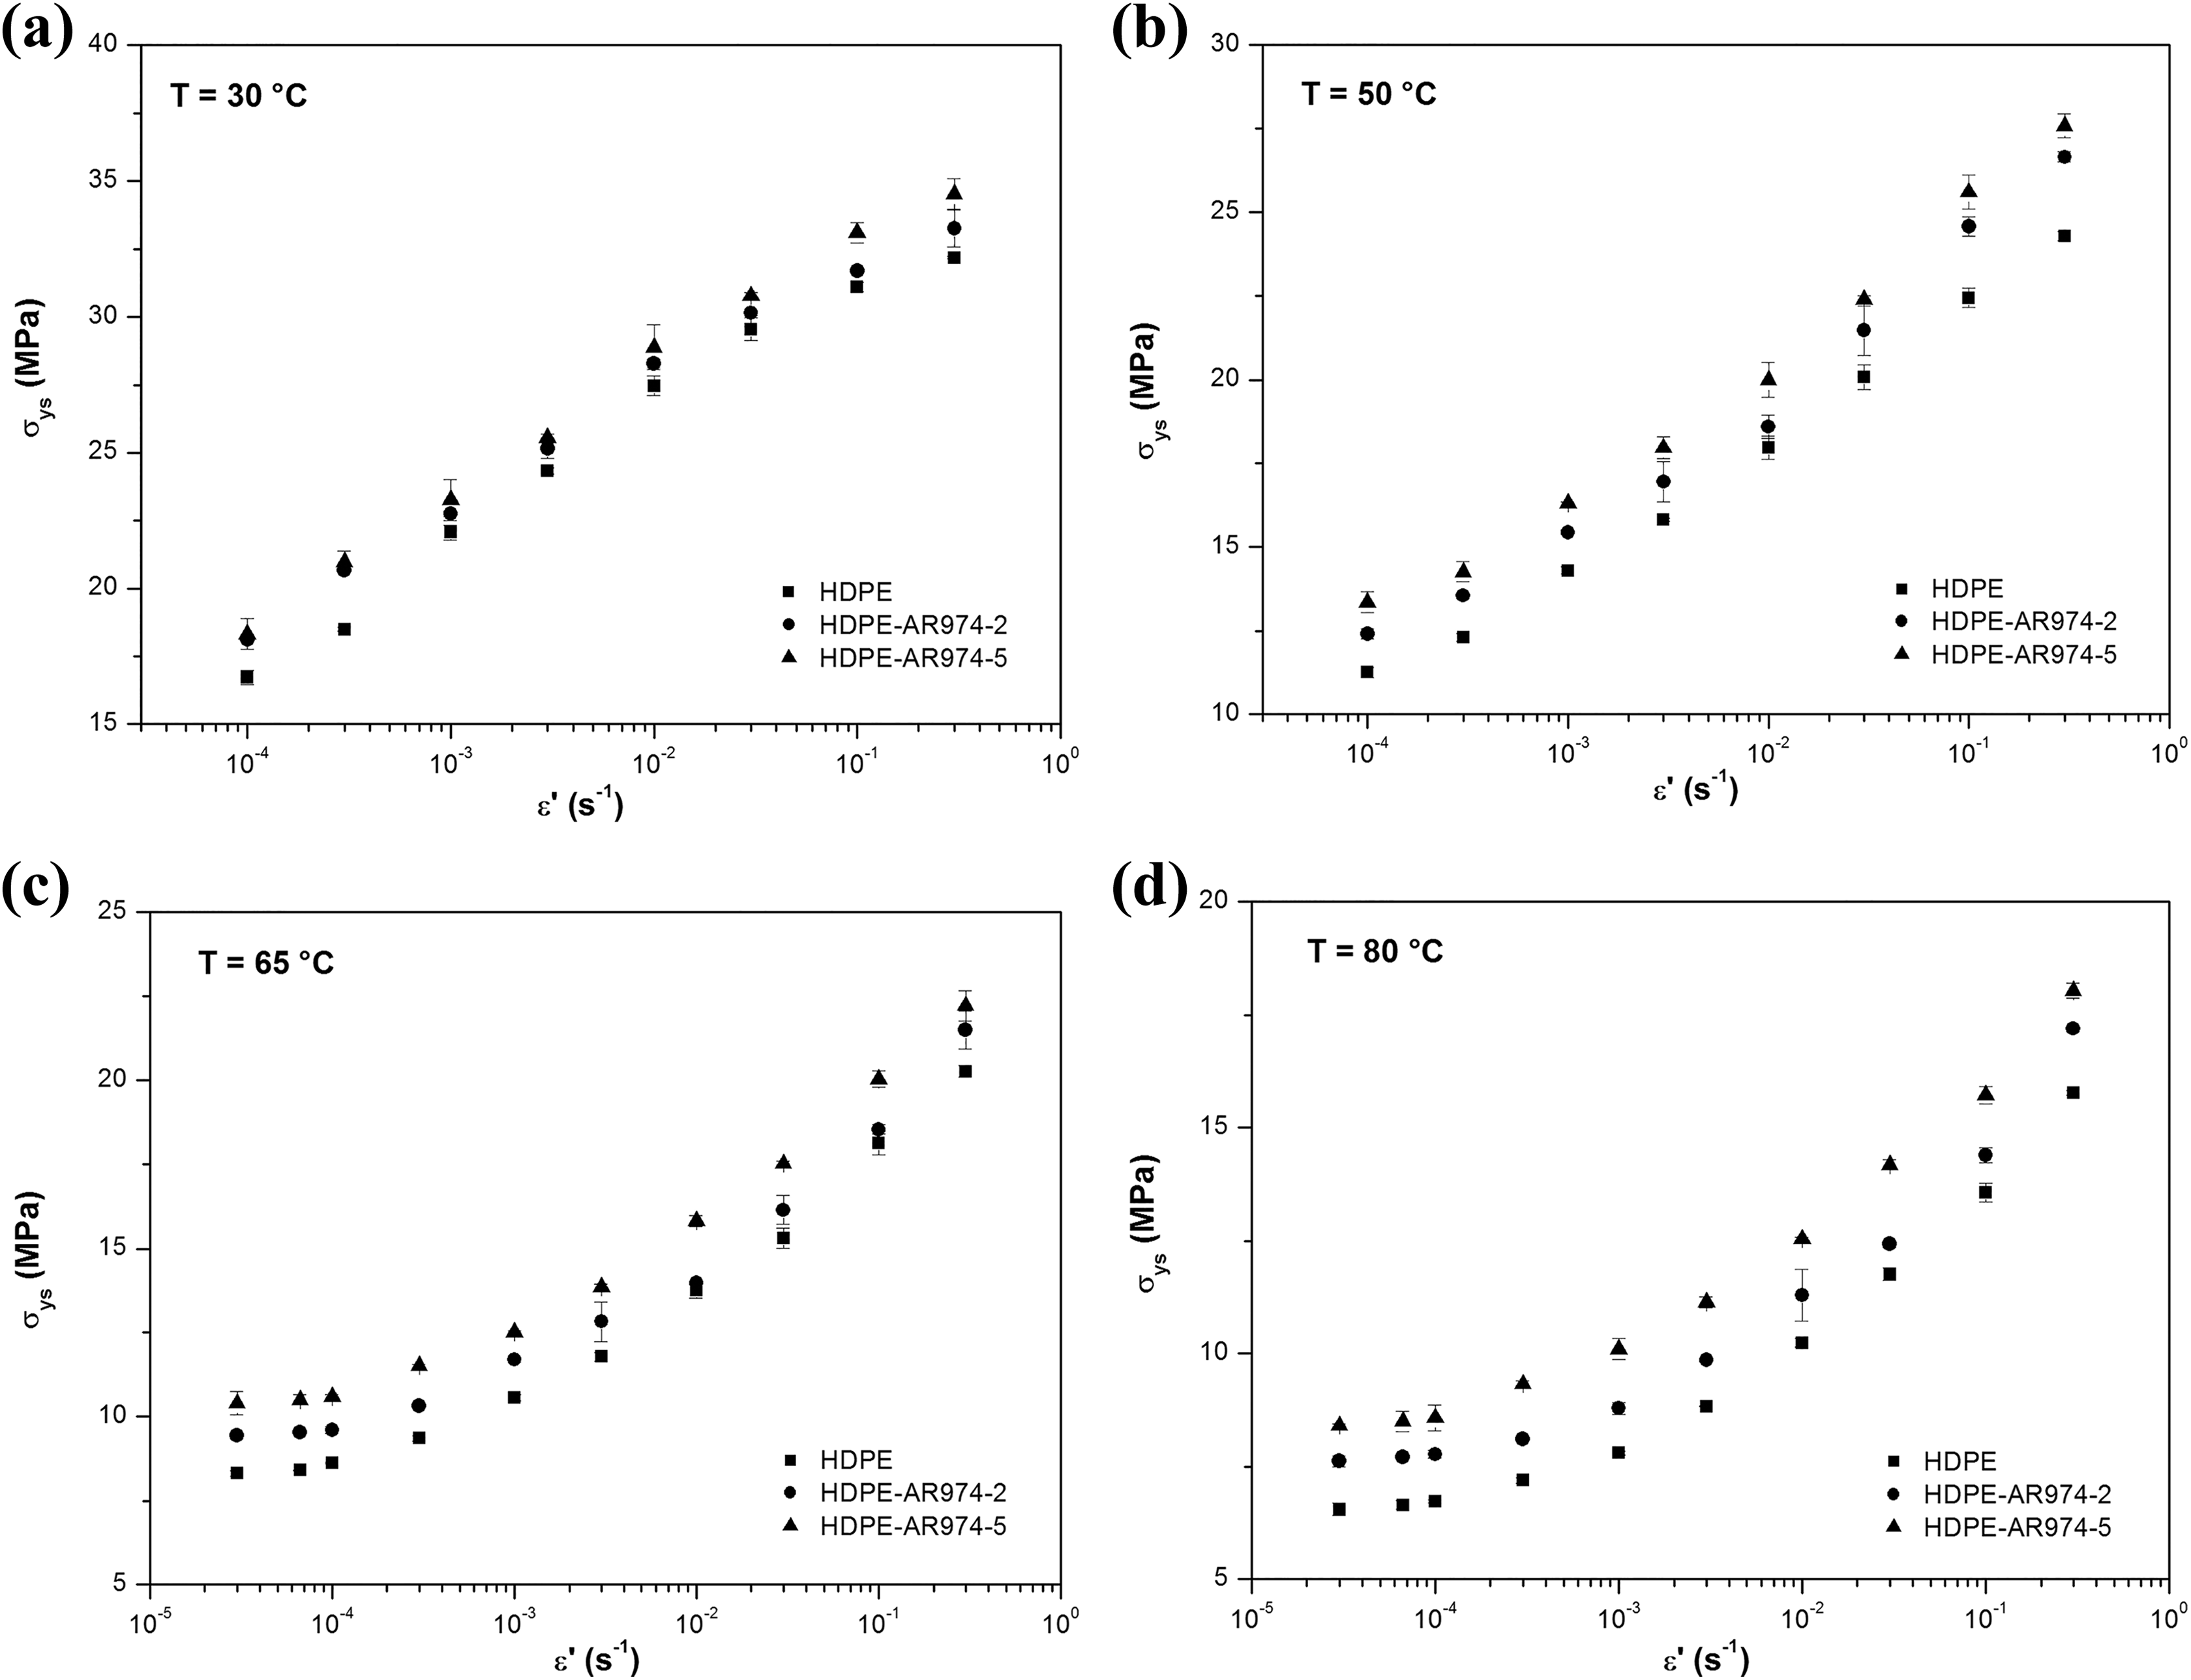
Dependency of the yield stress from the strain rate of HDPE and relative nanocomposites at (a) 30°C, (b) 50°C, (c) 65°C, and (d) 80°C. HDPE: high-density polyethylene.
It is now possible to fit yield stress data by using the modified Ree–Eyring equation (see equation (2)), and the resulting fitting curves of neat HDPE and relative nanocomposites at different testing temperatures are reported in Figure 7(a) to (c). In order to perform the fitting operations, the ε′0I and ε′0II values were taken from a previous work on HDPE (ε′0I = 2.57 × 10105 s−1 and ε′0II = 4.52 × 10¹⁸ s−1). 32 It is evident from the figures that the fitting was clearly split into the I and I + II regions. Once the fitting parameters in the region I were determined, it was possible to fit σys curves in the I+II region. The results of the fitting operations are reported in Table 3. First of all, it is important to underline how a good fitting was obtained for all the samples (R 2 values above 0.98). Therefore, the errors associated with the fitting parameters are relatively limited. The obtained values of V*I, ΔU I, V*II, ΔU II are very similar to those reported in the literature for polyethylene tested with the same approach. 6 Considering the standard deviation values associated with these measurements, the variation of the activation volume in the region I and II (V*I, V*II) due to the nanofiller introduction does not seem to be significant. On the other hand, the activation energy in the region I (ΔUI) seems to be increased by nanofiller introduction. This parameter represents the energy barrier required to activate the viscous flow of the macromolecules at the yield point. This increase could be responsible for an improvement of the mechanical performances of the materials at long time because, at low strain rate and/or at high temperatures (i.e. long testing times), the molecular process II is inhibited. With the results reported in Table 3, it is, therefore, possible to define the ε′ = f (σys, T) relationship for all the tested samples.

Dependency of the yield stress on the strain rate at different temperatures of (a) HDPE, (b) HDPE-AR974-2, and (c) HDPE-AR974-5 samples, with the fitting lines according to the Ree–Eyring model (see equation (2)). HDPE: high-density polyethylene.
Values of the Ree–Eyring parameters determined through the fitting of quasi -static tensile test curves on HDPE and relative nanocomposites.

HDPE: high-density polyethylene.
Creep tests
Once the constitutive relation ε′ = f (σ ys, T) is defined, it is required to perform creep tests to determine ε cr values. As reported in the “Experimental methodologies” section, creep tests at different stress levels and different temperatures were carried out to increase the statistical significance of the results. In Figure 8(a) to (c), representative creep curves at two different temperatures and different strain levels of neat HDPE samples and relative nanocomposites are reported. In all the tested materials, creep curves can be clearly divided into three classical regions. It is worthwhile to note that for every sample, the critical deformation value (ε cr) seems to be practically independent of the testing temperature and the applied stress, regardless of the nanofiller amount. As explained in the “Theoretical background” section, the critical deformation could be determined with the expression reported in Equation (5), by using the geometrical construction shown in Figure 4. In this way, the critical strain results to be slightly smaller than the real plastic strain to failure, because of the gradual increase of the strain rate in the tertiary creep stage. But, in these conditions, it is possible to determine the time-to-failure by using the stress dependence of the plastic flow. In Table 4, the results of critical deformation determined from creep tests on the tested specimens are summarized. Once again, the obtained value of ε cr is very similar to that reported in the literature for similar polymeric systems, 6 and the statistical errors of these measurements are very low. It is therefore confirmed that ε cr is an intrinsic property of the materials and does not depend on the applied stress and temperature. It is interesting to note that ε cr decreases with the nanofiller amount. As an example, ε cr values of the HDPE-AR974-5 nanocomposite are practically one half of that reported for the unfilled matrix. This result can be probably explained considering that the molecular mobility of the macromolecules is hindered by nanosilica addition, and the critical conditions are therefore reached at lower deformation levels.

Representative creep curves at two different temperatures and different strain levels of (a) HDPE, (b) HDPE-AR974-2, and (c) HDPE-AR974-5 samples. HDPE: high-density polyethylene.
Results of critical deformation (ε cr) determined from creep tests on HDPE and relative nanocomposites.

HDPE: high-density polyethylene.
Following the approach described in the theoretical background, it is, therefore, possible to define the dependency of the time-to-failure (t f) from the applied stress and from the temperature for all the tested materials. In Figure 9(a) to (d), t f curves of neat HDPE and relative nanocomposites are compared at different testing temperatures. It is immediately clear that fumed silica introduction plays a positive role in the resistance of the material for all testing temperatures. In the region I, nanosilica introduction determines a shift of σ – t f curves at higher stress levels. This result is probably correlated to the increase of the ΔU I values reported in Table 3. On the other hand, the slope of σ – t f curves in the region I seems to be practically unaffected by the presence of the nanofiller, and it can be correlated to the fact that quasi-static tests showed how V*I values are not influenced by the presence of silica. As an example, if a temperature of 20°C and applied stress of 12 MPa are considered, t f value of neat HDPE is around 106 s, while nanocomposite samples filled with 2 and 5 vol% are characterized by t f values of 109 s and 1013 s, respectively. From a technological point of view, it could be important to consider the mechanical resistance of the material after 50 years (i.e. 1.58·109 s—see ISO 4427 standard for plastic pipes). From σ – t f curves at 20°C, it is possible to see that the residual strength of HDPE is 11.1 MPa, while the resistance of nanocomposite materials is 12.0 and 12.9 MPa for the 2 and 5 vol% filled nanocomposites, respectively.

Dependency of the time-to-failure (t f) from the applied stress of HDPE and relative nanocomposites at (a) 0°C, (b) 20°C, (c) 40°C, and (d) 60°C. HDPE: high-density polyethylene.
Once a theoretical model is proposed, its experimental validation is required. Therefore, a comparison between experimental and theoretical values of the time-to-failure was carried out. In Figure 10(a) and (b), theoretical and experimental values of t f were determined under two different experimental conditions for neat HDPE and the HDPE-AR974-5 nanocomposite. It is important to underline that such comparison is only preliminary, and a wider experimental activity should be performed to validate the proposed approach. In both cases, it is clear that the discrepancy between experimental and theoretical values of the time-to-failure is very small. Therefore, it can be concluded that the proposed approach is characterized by a good reliability.
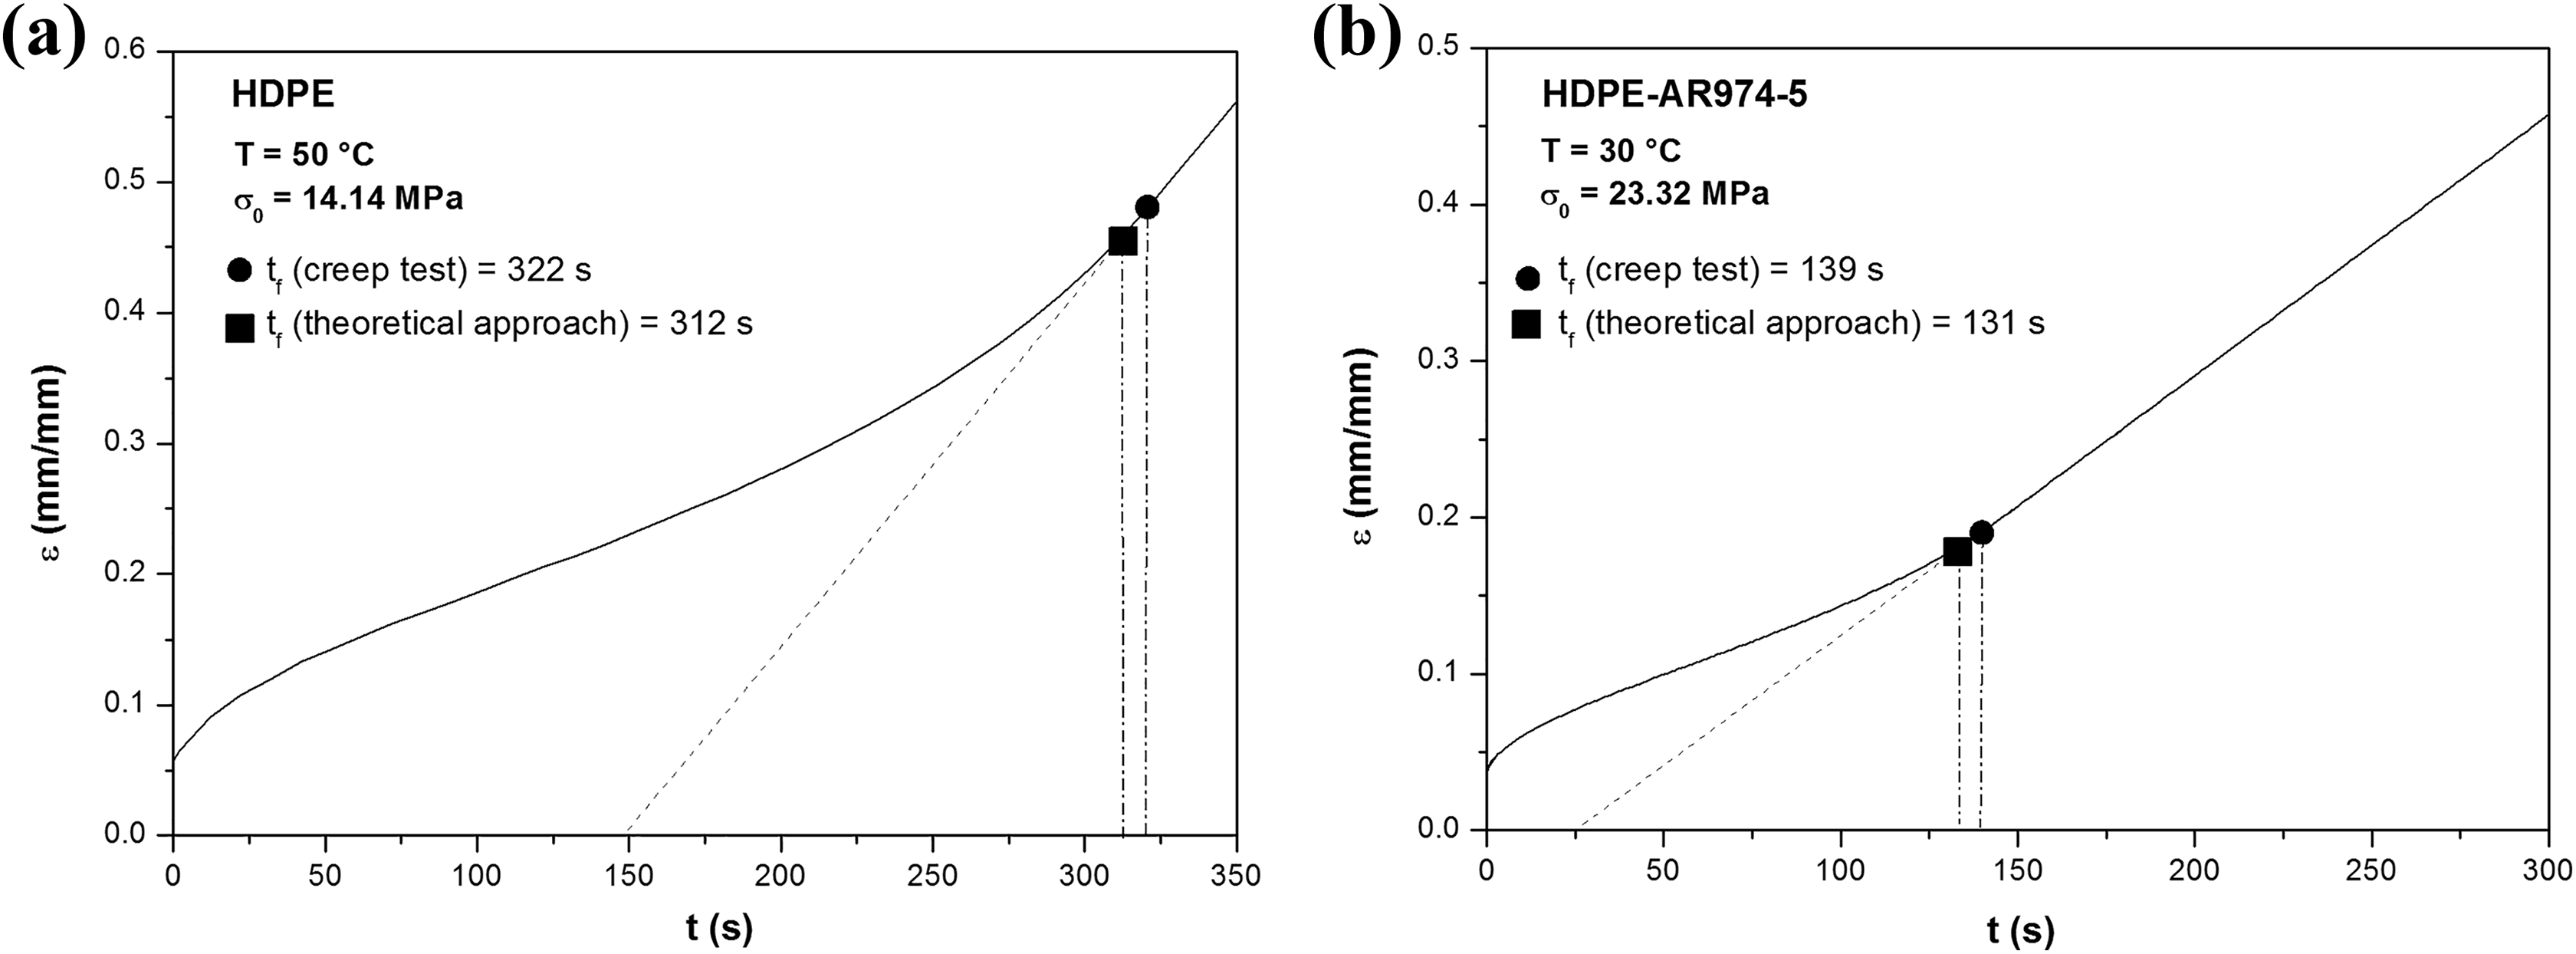
Comparison between experimental and theoretical values of the time-to-failure: (a) HDPE and (b) HDPE-AR974-5 samples. HDPE: high-density polyethylene.
Conclusions
Different amounts of functionalized fumed silica nanoparticles were melt compounded with a HDPE matrix, and the resulting materials were tested through quasi-static and creep tests in order to apply a novel theoretical approach able to predict the long-term resistance of thermoplastic matrices.
MFI measurements highlighted that the processability of the pristine matrix was retained even at elevated filler amounts. Quasi-static tensile tests combined with the application of the modified Ree–Eyring model led to the determination of the function ε′ = f(σ ys, T), and it was demonstrated that the deformation rate values could be substantially lowered upon fumed silica addition, especially at elevated nanofiller concentration. Creep tests at different testing speeds and temperatures showed that fumed silica addition led to a significant reduction of the critical deformation values (ε cr), and the subsequent application of the theoretical model demonstrated that nanosilica introduction determined a substantial increase of the time-to-failure values (t f), with good accordance between theoretical prediction and experimental measurements.
Footnotes
Acknowledgments
Mr. Paolo Bergamini is gratefully acknowledged for his support to the experimental work.
Declaration of conflicting interests
The author(s) declared no potential conflicts of interest with respect to the research, authorship, and/or publication of this article.
Funding
The author(s) received no financial support for the research, authorship, and/or publication of this article.