
Abstract
This present study was carried out to synthesize cobalt-doped and undoped titanium dioxide nanosized particles using sonochemical hydrolysis technique. The microstructure and morphological characteristics of the synthesized samples have been studied using X-ray diffractometer and high-resolution transmission electron microscope, respectively. The obtained results of characterization have confirmed the amorphous nature of the undoped sample. However, cobalt-doped titanium dioxide samples are in anatase phase. The obtained phase structure proposed the effect of acidity level during the hydrolysis process at relatively low temperature. Anatase phase is the predominant phase for the doped samples with small traces of brookite phase depending on the concentration of cobalt nitrate as the precursor salt in the hydrolysis process. The estimated crystallite sizes of the doped samples are ranging from 6.1 nm to 6.8 nm. The diffuse reflectance measurement revealed high near-infrared solar reflectance (R*), 85.3%, for amorphous nanosized titanium dioxide which is a white (non-coloured) sample. Moreover, cobalt-doped titanium dioxide, coloured samples, showed reasonable high values of R* with respect to their coloured feature and were found to be 53% and 51% for the synthesized samples at molecular weight percentage ratios between cobalt and titanium precursors; 5% and 10%, respectively.
Introduction
Metal oxides in their nanosized form play a crucial role in optical, acoustic, luminescent, electronic and optoelectronic applications. Among such materials, nanosized titanium dioxide (TiO2) currently receive much attention due to their novel physical and chemical properties in comparison to their properties in bulk forms. This offers a wider range of extensive applications in various fields such as photocatalysis, photoelectrochemical solar cells and nanopigments painting. 1 –3 Besides the particle size, the crystallite type has significant impacts on the resulting performance of TiO2 in any of the potential applications. Indeed, TiO2 may be formed in three crystalline phases: anatase, brookite and rutile. 4 Specifically, anatase phase has a higher photocatalytic activity compared to rutile and brookite phases. 5 However, the rutile phase is considered the most thermodynamically stable phase with the highest reflectivity to near-infrared (NIR) radiation. This leads to obtaining high-performance cool white pigments due to the effective light scattering property of such phase structure. 6 However, the applications based on the brookite phase is still ongoing, which need much work due to difficulties in obtaining the pure brookite structure. Moreover, both the type and the performance of the TiO2 applications can be tuned by elemental doping which vary the physical and chemical properties of the host TiO2. 7
Many works have been reported for the formation of a particular phase of TiO2 using various preparation techniques including sol–gel, 8 solvothermal, 9 hydrothermal method, 10 and hydrolysis. 1,11 Usually, during the preparation technique, the produced particles obtained after exposing to annealing process at a relatively high temperature. By using such annealing process, the size of the particles could be increased which leads to reduction in the surface area of the resulting particles and consequently lead to limitation in their effective properties. Therefore, the demand for finding controllable factors other than temperature is important from the viewpoint of getting more efficient nanosized particles as well as cost-effective preparation method. Among these factors, the acidity level during synthesization can control the crystallization process to obtain a certain TiO2 phase due to their dependence on the kinetics of reaction. 12 Moreover, doping by transition elements has a significant effect on the characteristic properties of TiO2 nanosized particles. 13 In this respect, we hydrolyzed the titanium (IV) isopropoxide (TTIP) in the presence of different doping doses of cobalt nitrate as the salt of strong acid. These enabled nanocrystalline cobalt (Co)-doped TiO2 at relatively low temperature. The microstructure, morphological and diffuse reflectance spectroscopic analyses were investigated for the as-synthesized pure and Co-doped TiO2 samples. The present study introduces the reflection in the variation of acidity level and doping concentration on the optical properties of TiO2. Moreover, this study concerns on the NIR reflectance of the investigated samples to check the ability to use them in cool pigment applications, which is considered a novel study especially for amorphous sample.
Experimental details
Materials
The reagents were of analytical grade and provided from Aldrich, UK. TTIP [Ti(OC3H7)4, 97% Aldrich, UK] and cobalt nitrate hexahydrate Co (NO3)2·6H2O from Sigma-Aldrich, UK) were used as precursors of Co-doped TiO2.
Synthesis
Amorphous TiO2 and Co-doped TiO2 nanoparticles have been synthesized via sonochemical hydrolysis of TTIP in the presence of the desired amount of Co (NO3)2·6H2O.
For pure TiO2 sample, 0.0125 mol of TTIP was added dropwise into 100 mL of distilled water. However, for Co-doped TiO2, the desired amount of Co (NO3)2·6H2O was dissolved in 100 mL of distilled water prior to the gradual addition of 0.0125 mol of TTIP. The molar percentage ratios between the Co (NO3)2·6H2O to TTIP were 0%, 5%, 10% and 20%. After complete addition of TTIP, the solutions were exposed to sonication using ultrasonic bath for 1 h. In fact, the ultrasonic radiation enables the formation of well-distributed large number of seed nuclei. 1,11 The obtained gel was aged 36 h to complete the hydrolysis process of TTIP. Thereafter, such aged gel was dried for 8 h at 100°C. The obtained as-synthesized powder was used in the present study without further annealing process. The obtained samples are labelled as TC0, TC5, TC10 and TC20 according to the used molar percentage ratios between the Co (NO3)2·6H2O and TTIP, 0%, 5%, 10% and 20%, respectively.
Characterizations
X-Ray diffractometer (XRD; XRPhillips X’pert, MPD 3040, France) was used to perform the XRD measurements. The diffracted intensities were collected throughout the diffraction angle 2θ ranging from 10° to 80° with 0.03° step. JASCO FT/IR-4100 (Japan) spectrometer was employed to conduct the Fourier transform infrared (FTIR) transamination spectra for the synthesized samples in the range of wave numbers from 400 cm−1 to 4000 cm−1. The morphology of the synthesized powder was inspected using high-resolution transmission electron microscope (HRTEM; JEM-2100, Japan). Diffuse reflectance measurements were done in the wavelength range from 200 nm to 2500 nm using a JASCO (Japan) spectrophotometer of type UV/Vis/NIR V570.
Results and discussion
XRD characterization of the synthesized pure and Co-doped TiO2 nanosized particles
Figure 1 shows the diffraction patterns of the as-synthesized pure TiO2 and Co-doped TiO2 samples. For pure TiO2 sample (TC0), the obtained diffraction pattern did not include any characteristic diffraction lines. However, such pattern has a pronounced stepped-hump that identifies the amorphous feature of such pure TiO2 sample. This result is in agreement with that obtained elsewhere 1,11 for amorphous TiO2 which is prepared by the hydrolysis of TTIP. In contrast, the obtained patterns for Co-doped TiO2 samples (TC5, TC10 and TC20) display the formation of a crystal structure. This result reveals the role of acidic medium, due to the dissolving of cobalt nitrate during the investigated hydrolysis process, to enable the crystallization of TiO2. In fact, the acidic medium promotes the nucleation and crystal growth processes of TiO2 as reported by Yin et al. 14 The obtained patterns of such doped samples exhibit the predominance of the well-defined characteristic peaks of anatase phase (JCPDS-21-1272). However, the diffraction peak at 2θ = 31.9° as assigned by asterisk in Figure 1 could be attributed to (211) plane of the brookite phase (JCPDS-29-1360). It is worth to mentioning that the acid concentration has a major impact on the formed crystal phase type of TiO2, anatase, brookite and rutile, during hydrolysis process due to its effect on the variation of the kinetics of the reaction as a result of the changing in OH− amount. 12 One can notice that the obtained peak related to brookite decreased with increasing cobalt nitrate concentration, that is, the most pronounced peak was obtained for TC5 sample. Moreover, the weight fractions of the phases (W) could be calculated using the obtained peak integrals (A) for the most intense peak for each phase, (101) for anatase and (121) for brookite, via the following equations 12 with considering no rutile phase is existed:


XRD patterns for the as-synthesized pure and Co-doped TiO2 samples. XRD: X-ray diffraction; TiO2: titanium dioxide; Co: cobalt.
where W A and W B are the weight fractions of anatase and brookite phases, respectively. Whereas A A and A B are the obtained peak integrals for A (101) and B (121), respectively. In addition, the response factors for each phase K A = 0.886 and K B = 2.721. The obtained weight fractions for the investigated samples are listed in Table 1. Such result refers to the ability of brookite phase formation to reduce with increase in the acidity level during the reaction. A similar behaviour was reported in the literature, 12 which introduced the hydrolysis of TTIP with different acid concentrations. Moreover, Wu et al. 15 and Fischer et al. 12 have proposed the formation of brookite phase at certain intermediate acid concentrations and vanished at the high acid concentrations which led to the formation of the rutile phase.
Calculated weight fractions of the phases (W A and W B), λ c and E g for Co-doped TiO2.

WA: weight fraction of anatase phase; WB: weight fraction of brookite phase; λ c: cut-off wavelength; E g: optical energy gap; TiO2: titanium dioxide.
The absence of any additional peaks related to pure Co or cobalt oxide refers to the fact that the host TiO2 lattice remained unchanged with the incorporation of Co atoms. Moreover, there is no shift in the peak positions, with the almost constancy of the broadening of the obtained peak with variation of Co content. Such result may be referring to the formation of other Co-based phase but with small intensity which is hard to distinguish in the presence of basic TiO2 phase using XRD. The crystallite size of the Co-doped TiO2 samples were calculated using the line broadening of the most preferred diffraction peak using Scherer formula. 16,17 The obtained values of crystallite size were found to be 6.8, 6.6 and 6.1 nm for TC5, TC10 and TC20 samples, respectively.
FTIR characterization of the synthesized pure and Co-doped TiO2 nanosized particles
FTIR transmittance spectra of the prepared undoped TiO2 and Co-doped TiO2 samples are shown in Figure 2. All the investigated samples exhibit characteristic broadband at 3332 cm−1 and other small one at 1622 cm−1 that can be assigned for stretching and bending vibration modes of the hydroxyl groups, respectively. These bands confirm the presence of hydroxyl groups that chemisorbed on the surface of the synthesized powder. 18 The bands at 2360 cm−1 are obtained for all the investigated samples that can be related to the absorption of CO2 from the atmosphere. 19 The obtained narrow peak at 1389 cm−1 corresponds to the stretching modes of –CH3, which can be attributed to the hydrolytic product of TTIP. 20 One can notice that the intensity of such peak increased with the addition of cobalt nitrate as shown in Figure 2. This indicates the effect of increase of acid concentration in the limitation of hydrolysis process of TTIP. Moreover, Figure 2 displays the broadband ranging from 400 cm−1 to 1000 cm−1. This absorption band represents the vibration of Ti–O–Ti. 21
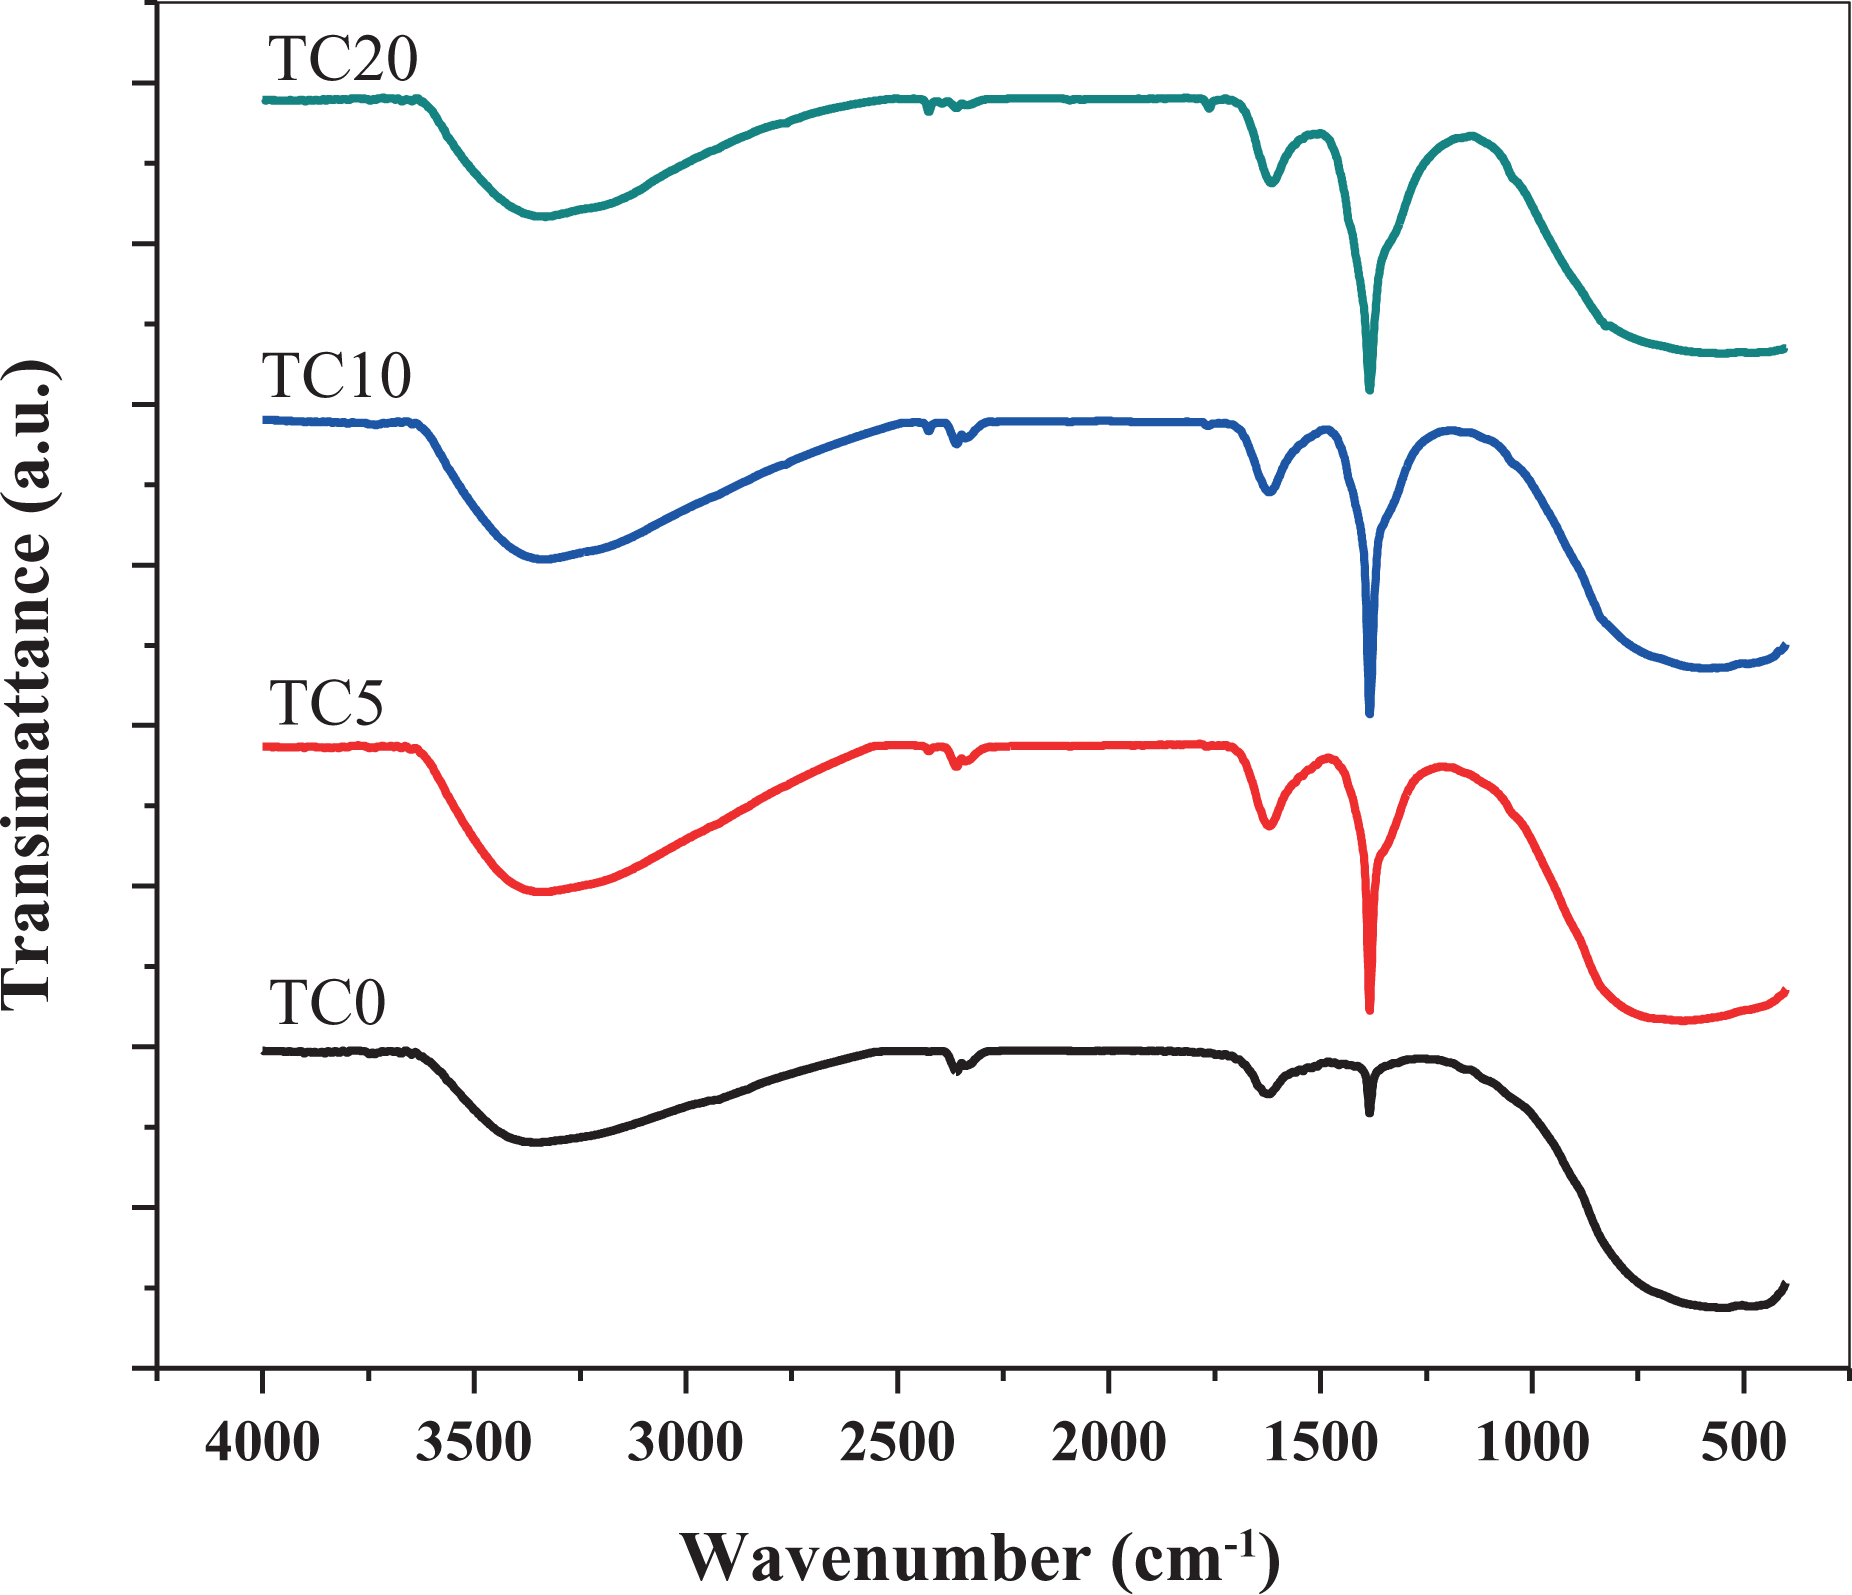
FTIR transmittance spectra of the investigated samples. FTIR: Fourier transform infrared.
Morphological characterization of the investigated samples
Figure 3 illustrates HRTEM micrographs for the TC0 and TC5. Figure 3(a) and (b) confirms the amorphous nature of the pure TiO2 sample by obtaining spherical-shaped microparticles including seed nuclei to grow the TiO2 crystals. Such morphology for pure TiO2 is commonly obtained for amorphous materials. 22,23 However, TC5 sample showed different morphologies as shown in Figure 3(c) and (d), which reveal well-defined nanoparticles. This confirms the successful formation of TiO2 nanocrystals using the acidic medium, due to the dissolving of cobalt nitrate during the investigated hydrolysis process, as discussed previously in the ‘XRD characterization of the synthesized pure and Co-doped TiO2 nanosized particles’ section. The obtained TiO2 nanoparticles disjointed in most sites of view as shown in Figure 3(c) with irregular shape and small average size around 7 nm.Some little sites include clusters of nanoparticles as shown in Figure 3(d). It worth mentioning here that the obtained small size of doped samples is due to the low temperature of the preparation (100°C), which may not be sufficient to grow large particles.

HRTEM micrographs: (a) and (b) for TC0 sample and (c) and (d) for TC5 sample. HRTEM: high-resolution transmission electron microscope.
(DRS) measurements of the synthesized undoped and Co-doped TiO2 nanosized particles
Figure 4 shows the diffuse reflectance ultraviolet (UV)–visible–near-infrared (NIR) spectroscopy (DRS) spectra of the as-synthesized nanoparticles. All the investigated samples exhibit strong absorption band at less than 400 nm due to the optical transitions arising the optical band gap. The DRS spectra of the Co-doped TiO2 samples showed other absorption band in the visible range region at approximately λ = 700 nm. This is referring to the extent of the band gap absorption into the visible light region as reported by Mugundan et al. 8 for Co-doped TiO2 nanoparticles prepared by sol–gel technique. The obtained absorption edge of the strong band, cut-off wavelength (λ c), for the doped samples showed a slightly UV shift with respect to that obtained for the pure amorphous sample. However, the values of λ c for the doped samples exhibited a slight red shift with the increase in the concentration of Co as shown in Table 1. This red shift can be attributed due to the expected formation of the electronic states in the optical band gap of the TiO2 as a result of the substitution of Co2+ to Ti+4 as well as the created oxygen defects due to charge imbalance in the lattice. 13 Similar result has been reported for TiO2 doped by Co as well as some other transition metals. 24 –26 Kubelka–Munk (K-M) function 27,28 is usually used to determine the optical band gap energy (E g) from the DRS measurements by using of K-M function instead of absorption coefficient in Tauc relation. 29,30 However, using the K-M function in the DRS results of the investigated samples failed to get the actual values of E g, especially for the highly doped samples (TC10 and TC20) due to their high absorbance. Indeed, the used approaches in K-M theory are valid only in diffusive light transport regime at which the scattering is dominated over the absorption. 31 Due to the limitation of the K-M theory in the present case, E g of the investigated samples were estimated from the simple relation; E g = hc/λ c, where h is Planck’s constant and c is the speed of light in vacuum. The obtained E g values of the investigated samples range from 3.483 eV to 3.625 eV as listed in Table 1, which is a larger range than commonly obtained for bulk TiO2 anatase phase (about 3.2 eV. 32 ). Such variation is quite expected due to quantum confinement effect in case of nanostructured materials. However, the obtained large value of E g for the investigated pure amorphous sample (3.625 eV) is attributed to an unrealistic bandgap value in case of the indirect transition for amorphous materials due to their surface morphology. 33,34
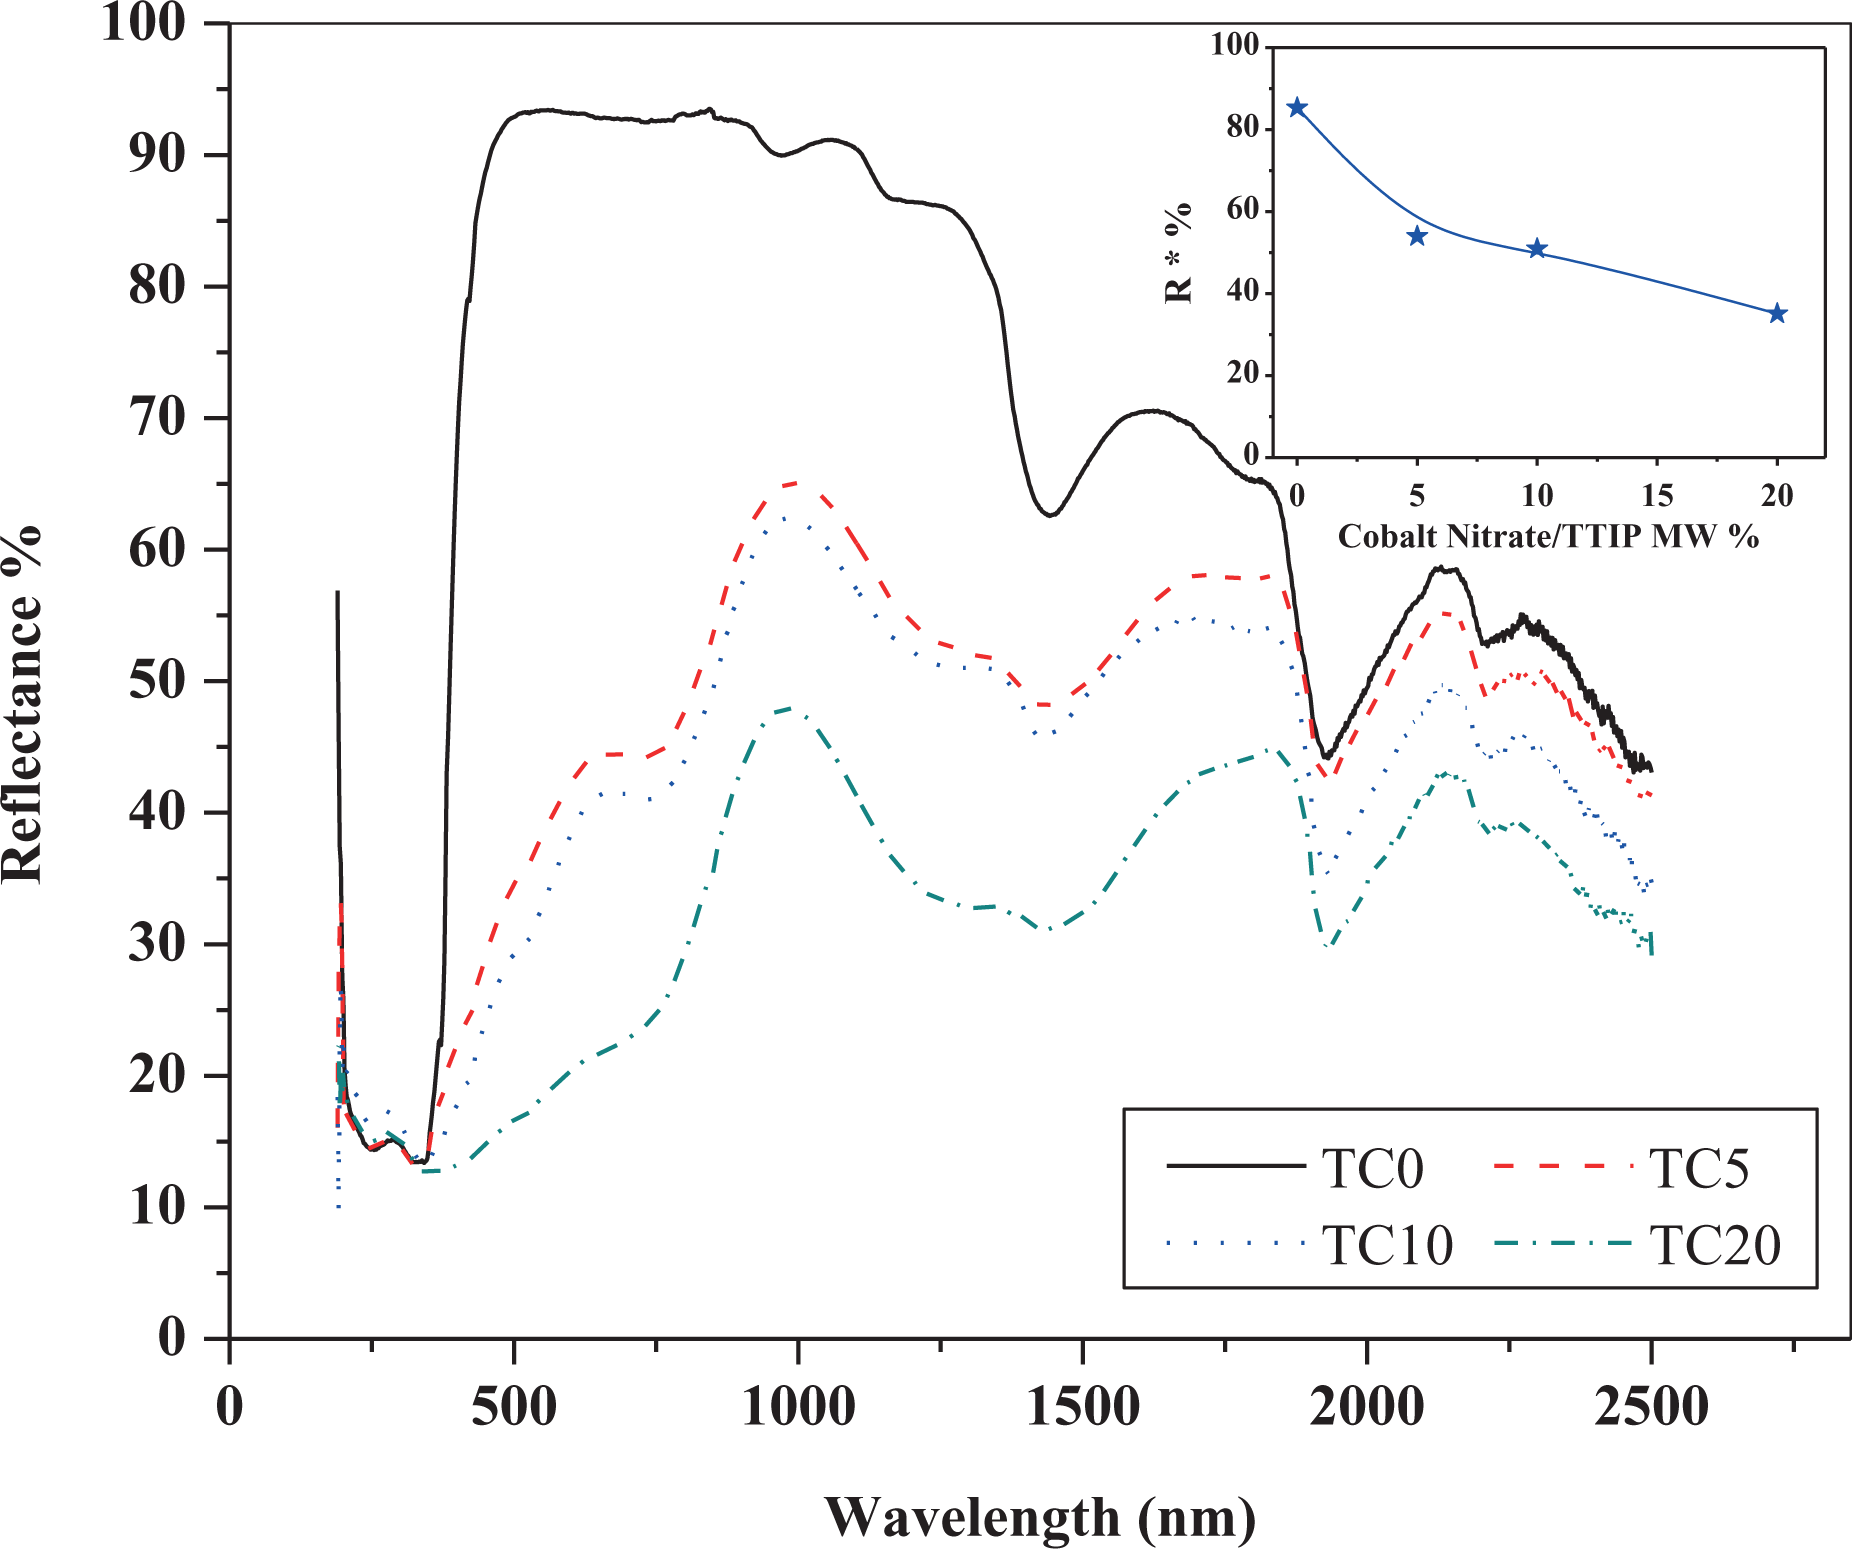
UV-Vis-NIR diffuse reflectance of the as-synthesized undoped and Co-doped TiO2 samples. The inset represents the variation on NIR reflectance (R*) on the cobalt nitrate concentration. UV-Vis: ultraviolet–visible; TiO2: titanium dioxide; NIR: near infrared; Co: cobalt.
In fact, DRS measurements for powdered materials help to expect the reflected part from solar energy for whether such materials will be used as cool nanopigments. As can be seen from Figure 4, the undoped amorphous TiO2 sample exhibited high reflectance feature, especially in the range from 490 nm to 900 nm, which revealed nearly constant reflectance plateau approximately 92%. However, the minimum value of reflectance for such samples was recorded at 1932 and 2500 nm and was around 44%. This reasonable high reflectance results refer to the successful obtaining of white cool nanopigments synthesized in relatively low temperature (100°C), which provide a cost-effective synthesization technique. All the investigated samples showed a depressed in reflectance at approximately 1500 nm due to the expected absorption band which commonly obtain in this range for complex-based TiO2. 35 The reflectance of the investigated samples was decreased with the increase in Co content. This considered a common behaviour due to an increase in density of energy levels due to impurities that is leading to increase the absorption of light in NIR region.
Due to 52% of solar energy that exists in the NIR spectrum ranging from 700 nm to 2500 nm 36 in addition to its responsibility for rising the temperature of the building materials, NIR solar reflectance (R*) is considered one of the most important characteristic merits to determine the suitability of nanoparticle powder materials to use as cool nanopigments. In this respect, R* values were calculated for all the investigated samples in such range from 700 nm to 2500 nm according to the ASTM (G173-03) 37 using the following equation

where R(λ) is the measured reflectance for each sample in W·m−2 throughout such range and i(λ) is the solar spectral irradiance in W·m−2·nm−1 as collected under ASTM standard condition (G173-03). The inset of Figure 4 shows the variation of the calculated R* values with Co content. For white amorphous TiO2 sample, the R* was found to be 85.3% which can be comparable to the commonly obtained white crystalline TiO2, approximately 87%, 38 that is prepared at high temperature. This result can be referred to the important role of high surface area of nanosized amorphous TiO2 in increasing the reflectance due to their high roughness morphology as shown in the HRTEM micrographs in Figure 3(a) and (b). On the other hand, the obtained R* values for Co-doped TiO2, coloured samples, exhibit a reasonable high values especially the obtained values for TC5 and TC10 are 53% and 51%, respectively. Such results suggest the ability of utilization of these samples as cool-coloured nanopigments, with recommendation for study their colours performance.
Conclusions
Amorphous nanosized TiO2 and Co-doped TiO2 nanocrystals have been successfully synthesized by sonochemical hydrolysis of TTIP. The obtained results from HRTEM and XRD confirmed the obtaining amorphous nanosized feature for pure sample as well as TiO2 nanocrystals for the Co-doped samples. All the synthesized samples were collected after the hydrolyzed gel was conducted to relatively low temperature at 100°C. The successful formation of the anatase crystal structure for the doped samples at such low temperature confirmed the role of acidity level on the nucleation and crystal growth. The high surface area of amorphous nanosized TiO2 sample exhibits a good impact on its NIR solar reflectance. Moreover, the small particle size of the Co-doped TiO2, coloured samples, from 6.1 nm to 6.8 nm, compensates for the reduction in reflectance due to doping trap level and/or the changing in sample compositions. The investigated synthesization technique presents facile and cost-effective method to get nanoparticle powder, which could be used as cool-coloured nanopigments.
Footnotes
Declaration of conflicting interests
The author(s) declared no potential conflicts of interest with respect to the research, authorship, and/or publication of this article.
Funding
The author(s) disclosed receipt of the following financial support for the research, authorship, and/or publication of this article: The authors are indebted to the Deanship of Scientific Research at Nourah Bint Abdulrahman University, for funding this study and (the relevant project number is (37-s-202).