
Abstract
In spite of advantages of direct methanol fuel cells, low methanol oxidation reaction and fuel crossover from anode to cathode, there remains a challenge that inhibits it from being commercialized. Active electrocatalysts are in high demand to promote the methanol oxidation reaction. The methanol reached at the anode can be immediately reacted, and thus, less methanol to cross to the cathode. The performance of electrocatalysts can be significantly influenced by varying the concentration of precursor solution. Theoretically, concentrated precursor solution facilitates rapid nucleation and growth; diluted precursor solution causes slow nucleation and growth. Rapid nucleation and slow growth have positive effect on the size of electrocatalysts which plays a significant role in the catalytic performance. Upon the addition of appropriate concentration of graphene oxide, the graphene oxide was reported to have stabilizing effect towards the catalyst nanoparticles. This work synthesized reduced graphene oxide–supported palladium electrocatalysts at different concentrations (0.5, 1.0, 2.0, 3.0 and 4.0 mg mL−1) with fixed volume and mass ratio of reduced graphene oxide to palladium by microwave-assisted reduction method. Results showed that reduced graphene oxide–supported palladium synthesized at a concentration of 1.0 mg mL−1 gave the best methanol oxidation reactivity (405.37 mA mg−1) and largest electrochemical active surface area (83.57 m2 g−1).
Keywords
Introduction
Depletion of fossil fuels in near future and its arisen pollution issue have sparked interest of scientists and engineers to seek for alternative energy supply. 1 Direct methanol fuel cells (DMFCs) emerge to be suitable green power source that directly convert chemical energy into electric energy for portable electronic devices owing to its low operating temperature, high theoretical energy density, low-cost liquid fuel and relatively quick start-up. 2 –4 Nonetheless, the methanol at the anode tends to permeate through the electrolyte membrane into the cathode. 5 This results in reduced cell voltage (sometimes called a mixed potential), flow of internal currents and a waste of fuel. 6 A solution to this problem is to synthesize active anodic electrocatalysts. Active electrocatalysts allow the methanol reached at the anode to be reacted effectively. Hence, this will cause less methanol available to diffuse through the electrolyte to the cathode. 6
Active electrocatalysts can be characterized by large electrochemically active surface area (ECSA), which can be obtained by less agglomerated and small-sized catalysts. 7 Loading catalysts onto the surface of graphene has been found effective in limiting the aggregation and size of catalysts. 8,9 Previous works have provided in-depth studies on the unique properties of graphene and its contribution to the performances of graphene-related electrocatalysts. 10,11 Its large surface area (2630 m2 g−1) immobilizes catalysts on the surface, making the catalysts stable, smaller and less agglomerated, maximizing catalyst utilization and catalytic sites for reactions. 5
Formation of nanoparticles (NPs) involves three steps: (i) generation of supersaturation, (ii) nucleation and (iii) growth of NPs. 12 Current research has been focusing on growth controlling by using surfactants such as polyvinylpyrrolidone, 13 polyvinyl alcohol 14 and poly(diallyldimethylammonium chloride). 15 Nonetheless, there are reports stating that surfactants will cover the active sites of catalysts, thereby limiting the catalytic activity. 15 In fact, the size of catalysts can also be controlled through careful manipulation of the concentration of precursors. 12 The precursors can be reduced by ethylene glycol (EG). During the reduction process, EG reduces the starting precursors to final products and itself gets oxidized to carbonyl compound (mainly diacetyl). 16,17 Notably, reduction capability of EG is rather weak. Sodium hydroxide (NaOH) is added to accelerate the reduction reaction by inducing monoanion of EG, which has been reported active towards reduction reaction. 18 High concentration favours the rate of the above three steps. 12 Nevertheless, varied to the first two steps, fast growth of NPs is unintended because it leads to the formation of large particle. 12
To date, the number of work reported on the effect of concentration of precursor mixture (graphene oxide (GO) + metal ions) is scarce. Therefore, the objective of this work is to investigate the effects of various concentrations of starting precursor (palladium chloride (PdCl2) + GO) on the catalytic activity of the electrocatalysts at a fixed mass ratio of palladium (Pd) to GO.
Experimental
Materials
Graphite flake (50 mesh) was purchased from Asbury Carbons (Asbury, New Jersey, USA). Concentrated phosphoric acid (H3PO4) and potassium permanganate (KMnO4) were obtained from Wako Pure Chemical Industries, Ltd (Chuo-ku, Osaka, Japan). Concentrated sulphuric acid (H2SO4), hydrogen peroxide (H2O2), fuming hydrochloric acid (HCl, 37%), PdCl2, EG, Nafion, NaOH and potassium hydroxide (KOH) were from Sigma-Aldrich (Meguro-ku, Tokyo, Japan). All chemicals were analytically pure and used as received without further purification. The deionized (DI) water for solution preparation was produced from Advantec Aquarius RFD230NA, Japan (conductivity = 0.06 µS).
Pd/reduced GO preparation
Graphite flake was oxidized to graphite oxide by improved Hummers’ method published elsewhere with slight modification, but the main features are briefly illustrated here. 19 H2SO4 was mixed with H3PO4 at a ratio of 360:40 mL followed by the addition of 3 g of graphite flake. Then, 18 g of KMnO4 was added into the above mixture and stirred. After 3 days of stirring, by immersing in ice bath, 500 mL of DI water was added to the above mixture, and 17 mL of H2O2 was added dropwise to halt the oxidation. The mixture was then sequentially washed with 1 M of HCl thrice at 6000 r min−1 for 30 min, and followed up by using DI water for seven times at 10,000 r min−1 for 1 h by centrifugation. Next, the synthesized graphite oxide was dried overnight at 60°C in an oven.
For the synthesis of reduced graphene oxide (rGO)–supported Pd (Pd/rGO) at concentration 0.5 mg mL−1, denoted as Pd/rGO (0.5), the dried graphite oxide (30 mg) was dispersed in 80 mL of DI water and ultrasonicated for 2 h to obtain GO. Subsequently, 50 mg of PdCl2 was added and sonicated for 30 min. Then, the above mixture was stirred for 1 h at room temperature. Meanwhile, 80 mL of EG was added dropwise. The pH of the mixture was adjusted to 10 by 1 M of NaOH. Subsequently, the mixture was reduced by household microwave oven at 700 W for 700 s. Finally, the resulting black solid powders were washed by DI water thrice via centrifugation at 6000 r min−1 for 30 min and were dried overnight in an oven at 60°C. The samples with other concentrations (1.0, 2.0, 3.0 and 4.0 mg mL−1, denoted as Pd/rGO (1.0), Pd/rGO (2.0), Pd/rGO (3.0) and Pd/rGO (4.0), respectively) as recorded in Table 1 were synthesized by repeating the above procedures with different mass of GO and Pd.
Samples of different total mass of GO and PdCl2 mixture, and concentration.

PdCl2: palladium chloride; Pd: palladium; GO: graphene oxide; rGO: reduced graphene oxide; Pd/rGO: reduced graphene oxide–supported palladium.
Characterization
The characterization of morphologies and compositions of the samples were performed by field-emission scanning electron microscopy (FESEM; HITACHI S-4800, Chiyoda-ku, Tokyo, Japan) coupled with energy dispersive X-ray spectroscopy (EDX). Raman analysis, a non-destructive characterization technique, was used to investigate the defect levels, crystallinity and structure. The procedure was performed by a JASCO NRS-3100 (Easton, Maryland, USA) equipped with a charge-coupled-device detector using Argon ion at a wavelength of 532 nm. The crystallite structures were investigated by X-ray powder diffraction (XRD) by using an Ultima IV X-ray diffractometer (Rigaku, [Matsubara-cho, Akishima-shi, Tokyo, Japan], USA) with a Cu X-ray source (λ = 0.1541 nm) operating at 40 kV and 40 mA. Fourier-transform infrared (FTIR) spectroscopy (Shimadzu TCC-240A, Nakagyo-ku, Kyoto, Japan) was conducted to verify the successful reduction of the samples.
Electrochemical measurement
All the electrochemical experiments were examined with a conventional three-electrode electrochemical cell by using a Solartron 1280C (Farnborough, Hampshire, UK) with computerized control by ZPlot software at room temperature. A platinum sheet of 1 cm2, silver/silver chloride (Ag/AgCl) (3 M potassium chloride (KCl)) electrode and glassy carbon electrode (GCE; 3.0 mm diameter) were used as counter, reference and working electrodes, respectively.
To prepare the working electrode, 2 mg as-prepared catalysts were first dispersed in 1 mL DI water and ultrasonicated for 30 min. Then, 10 μL of the suspension was casted onto the surface of polished GCE and dried in an oven at 60°C. Subsequently, 5 μL of Nafion (0.05 wt%) was dropped onto the electrode surface and dried at 60°C in the oven.
The ECSA of each electrocatalyst was conducted by cyclic voltammetry (CV) measurement in a solution of 1 M KOH from −1.0 V to 0.6 V versus Ag/AgCl. Meanwhile, methanol oxidation activity was investigated by CV measurements in 1 M KOH + 1 M methanol at similar potential range. All the electrochemical tests were carried out at a scan rate of 50 mV s−1 for 10 runs. Chronoamperometry (CA) measurements were studied in the same methanol-contained KOH solution at an applied voltage of −0.2 V for 1000 s. Electrolytes were all purged with nitrogen gas for 30 min to remove any dissolved oxygen prior to the measurements.
Results and discussion
Characterization
Crystalline phase structures of samples were characterized by XRD measurement. Figure 1 shows the XRD of GO, rGO and Pd/rGO at different concentrations. The disappearance of the peak of GO at 10.3°, and appearance of weak and broad peak at 24°, which belongs to C(002) planes of rGO, imply that GO sheets were successfully reduced by microwave irradiation for all samples. 20 Meanwhile, the peaks at approximately 40.1°, 46.5°, 68.2°, 82.1° and 86.69° could be indexed to the (111), (200), (220), (311) and (422) lattice planes of the face-centred cubic crystalline structure of Pd (JCPDS No. 46-1043), respectively. By using Scherrer’s formula based on the Pd (220) peak, the particle size of Pd was calculated to be 8.69, 8.08, 7.57, 8.32 and 8.64 nm for Pd/rGO (0.5), Pd/rGO (1.0), Pd/rGO (2.0), Pd/rGO (3.0) and Pd/rGO (4.0), respectively. Increasing the concentration to 1.0 mg mL−1, the particle size became smaller. Such phenomenon can be rationalized by Figure 2. The nucleus formed is stable only when it overcomes the critical energy (ΔG*) and exceeds the critical size (r*). Equations (1) to (5) are the related formulas 12

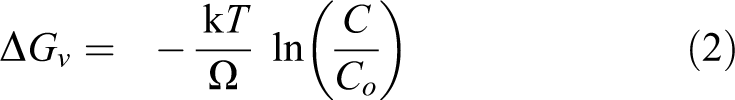
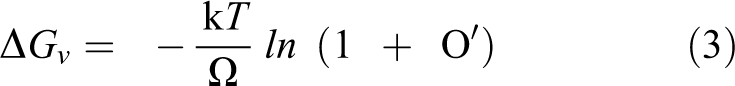


where γ is the surface energy per unit area of the formed nucleus, ΔGv is the change of Gibbs free energy per unit volume of the nucleus, C is the concentration of the solute, Co is the equilibrium concentration or solubility, k is the Boltzmann constant, T is the temperature and O' is the supersaturation. From the above equations, the critical size and critical energy can be reduced with increased supersaturation that relates to concentration. High initial concentration favours the formation of a large number of nuclei, signifying smaller sized nuclei. 12 Nevertheless, further increment of concentration beyond 1.0 mg mL−1 resulted in bigger Pd NPs. At concentration beyond 1.0 mg mL−1, the newly formed small nuclei have high surface energy, causing it to be unstable. Thus, the small nuclei tend to grow bigger by Ostwald ripening and agglomeration to reduce the surface energy. 12 At concentration beyond 1.0 mg mL−1, nuclei are in close proximity, and collide with each other all the time, resulting in large agglomeration and high growth rate. 12

XRD images of Pd/rGO (0.5), Pd/rGO (1.0), Pd/rGO (2.0), Pd/rGO (3.0) Pd/rGO (4.0), rGO and GO. XRD: X-ray powder diffraction; Pd: palladium; GO: graphene oxide; rGO: reduced graphene oxide; Pd/rGO: reduced graphene oxide–supported palladium.

Figure illustrating the change of total free energy, ΔG, as function of nucleus’ radius, r.
Figure 3(a) to (e) shows transmission electron microscopy (TEM) images of the Pd/rGOs at different concentrations. Mean particle size as well as size distribution were calculated from 50 NPs and are shown in Figure 3(f) to (j). Wrinkles and ripples that induced from the removal of oxygen-containing functional groups of GO can clearly be observed for all samples. 21 Pd NPs appeared as dark dots on the transparent rGO sheets. The Pd NPs were successfully loaded onto the surface of the rGO for all samples. Serious agglomeration with wide size distribution occurred at Pd/rGO (0.5) because the low concentration of GO was unable to stabilize the Pd NPs. At concentration 1.0 mg mL−1, the agglomeration was alleviated. The GO is at appropriate concentration to stabilize the Pd NPs, uniformly distributing the Pd NPs on rGO surface and contributing to narrow size distribution. Further increment in concentration beyond 1.0 mg mL−1 resulted in wide particle size range and serious agglomeration because of the close proximity between neighbouring particles. The particles agglomerated together to reduce surface energy. The tendency of agglomeration of NPs exceeded the stabilizing effect of GO for concentrated precursor mixture with concentration beyond 1.0 mg mL−1. The Pd NPs of Pd/rGO (1.0) were further observed at higher resolution (Figure 3(k)). The high-resolution TEM image revealed a lattice spacing of 0.22 nm, corresponding to the Pd (111) crystalline planes.
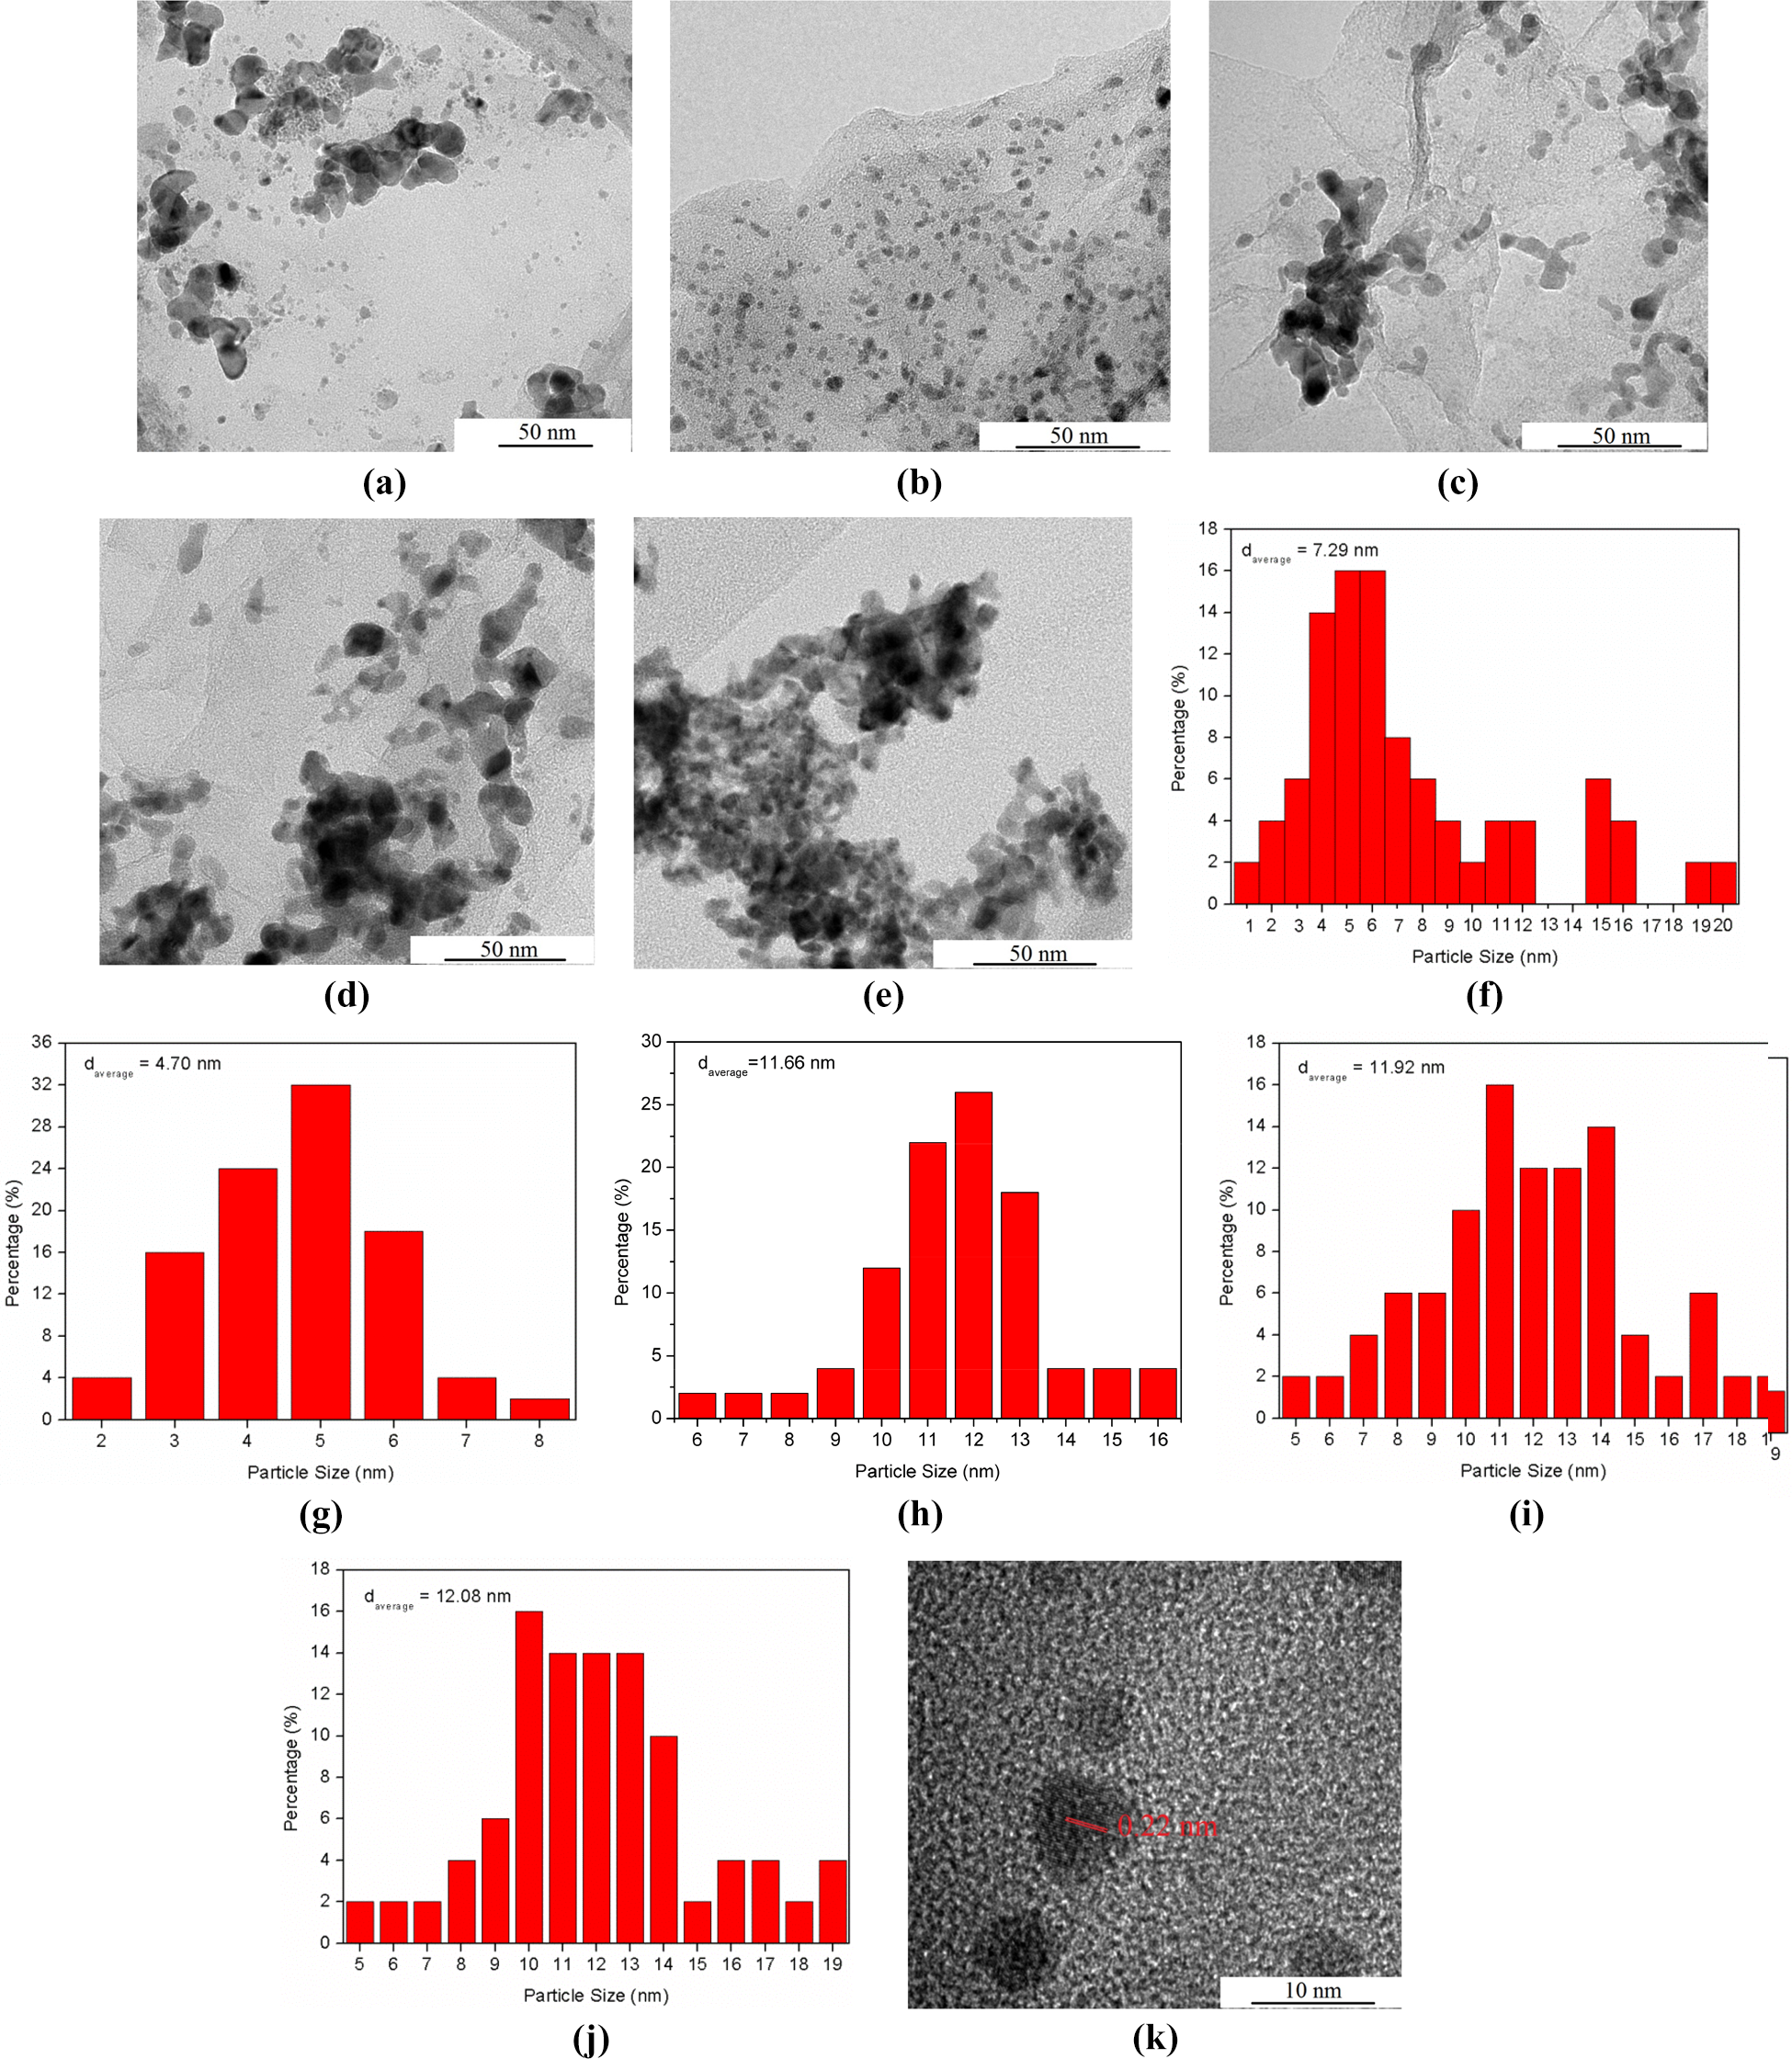
TEM images of (a) Pd/rGO (0.5), (b) Pd/rGO (1.0), (c) Pd/rGO (2.0), (d) Pd/rGO (3.0) and (e) Pd/rGO (4.0). NP size distribution of (f) Pd/rGO (0.5), (g) Pd/rGO (1.0), (h) Pd/rGO (2.0), (i) Pd/rGO (3.0) and (j) Pd/rGO (4.0). (k) HRTEM image of Pd/rGO (1.0). TEM: transmission electron microscopy; Pd: palladium; rGO: reduced graphene oxide; Pd/rGO: reduced graphene oxide–supported palladium; HRTEM: high-resolution transmission electron microscopy; NP: nanoparticle.
EDX (Table 2) shows higher mass loading of Pd for more concentrated samples with the Pd/rGO (2.0) having the highest amount of Pd deposition. Correlating to the FESEM images, it suggests that the high mass loading leads to agglomeration. The unexpected lower mass of Pd/rGO (3.0) and Pd/rGO (4.0) could be explained by the possible severe agglomeration that detach from rGO surface during centrifugation.
The EDX of Pd/rGO (0.5), Pd/rGO (1.0), Pd/rGO (2.0), Pd/rGO (3.0) and Pd/rGO (4.0).

EDX: energy dispersive X-ray spectroscopy; Pd: palladium; rGO: reduced graphene oxide; Pd/rGO: reduced graphene oxide–supported palladium.
Raman characterization was performed to analyse the defect level and quality of rGO.
22
As shown in Figure 4, all samples present two intense peaks at 1330–1350 cm−1 and approximately 1590 cm−1 that correspond to D band and G band, respectively. The former peak was attributed to the structural disorder or intrinsic defects due to an A1 g vibrational mode. The latter was related to the first-order scattering of the E2 g mode of graphite that was associated to the coplanar vibration of sp2-hybridized carbon atoms in a two-dimensional hexagonal lattice.
23
The intensity ratio of D band to G band
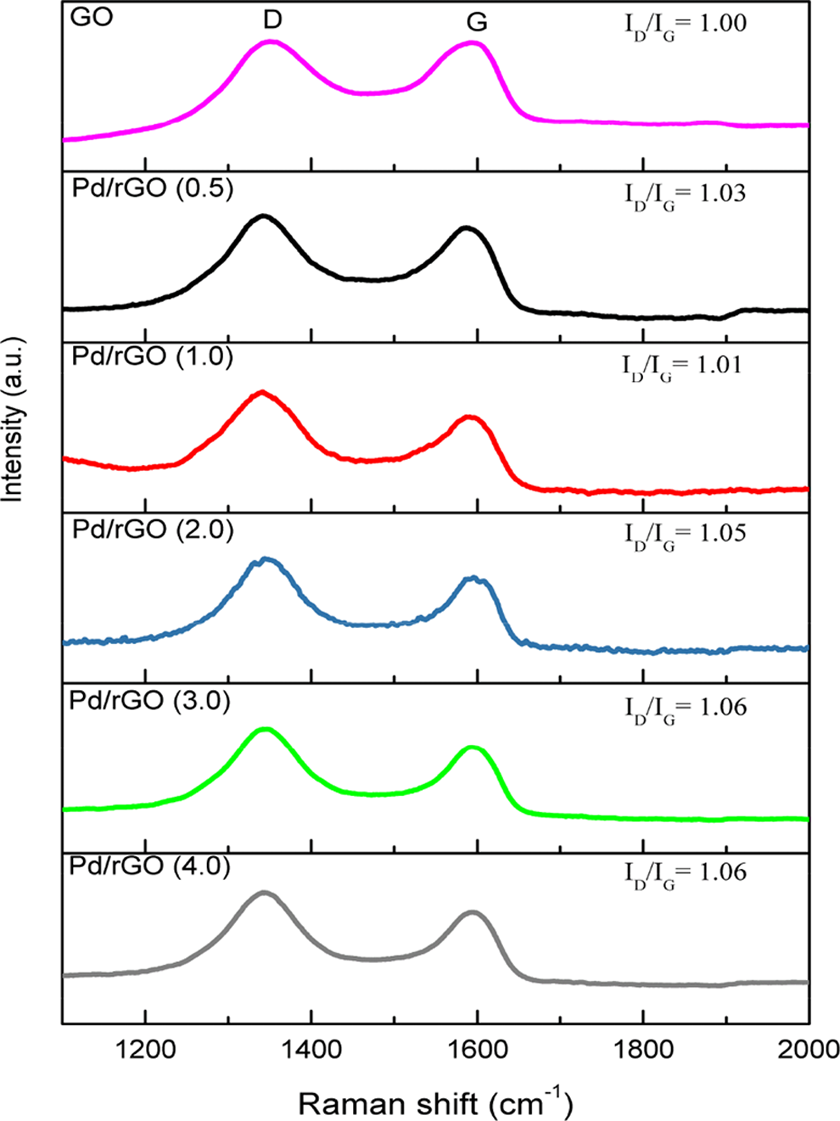
Raman images of Pd/rGO (0.5), Pd/rGO (1.0), Pd/rGO (2.0), Pd/rGO (3.0), Pd/rGO (4.0) and GO. Pd: palladium; GO: graphene oxide; rGO: reduced graphene oxide; Pd/rGO: reduced graphene oxide–supported palladium.
Figure 5 shows FTIR spectra of the GO and samples at different concentrations. All samples exhibited rather similar spectra. Peaks of GO can clearly be observed at 1126, 1637 and 3431 cm−1, corresponding to C–O stretching vibration, sp2-hybridized C=C stretching vibrations and OH stretching vibration, respectively. 28 Most of the associated oxygen-containing peaks were removed or greatly decreased after the reduction process, verifying the successful reduction of the samples despite some weak residual O–H peaks can be observed at approximately 1048 and 1173 cm−1. 29 Some new peaks also appeared at approximately 2923 and 2852 cm−1, attributed to the CH2 stretching vibration and CH stretching vibrations, respectively. 30 The appearance of these new peaks can be ascribed to the reduction of the carbocylic acids in GO to CH2OH. The strong peak at 1575 cm−1, associating to skeletal vibration of sp2-hybridized carbon ring in graphene, suggested the recovery of sp2 lattice. 29

FTIR spectra of GO, Pd/rGO (0.5), Pd/rGO (1.0), Pd/rGO (2.0), Pd/rGO (3.0) and Pd/rGO (4.0). FTIR: Fourier-transform infrared; Pd: palladium; GO: graphene oxide; rGO: reduced graphene oxide; Pd/rGO: reduced graphene oxide–supported palladium.
Electrochemical measurements
The ECSA of the electrocatalysts accounts for the number of catalytic sites that are active for electrochemical reaction and provides information on the conductive path accessible for electron transfer to and from the electrode surface. 5,31 The values of ECSA were calculated from the area of reduction peak of palladium oxide (PdO) in the potential region of −0.7 to −0.2 V versus Ag/AgCl on the CV in Figure 6(a) according to Equation (6) 32

where ‘Q’ is the coulombic charge (mC) for the PdO reduction, ‘S’ is a conversion factor corresponding to 0.424 mC cm−2 and ‘l’ is the mass of catalyst (mg) loaded on the GCE.
32
Table 3 reports the ECSA values of various electrocatalysts ranging from 30.68 m2 g−1 to 83.57 m2 g−1. Well distribution of Pd NPs on the surface of rGO, small particle size (8.08 nm) and less defects of rGO (as reflected by

The cyclic voltammograms of Pd/rGO (0.5), Pd/rGO (1.0), Pd/rGO (2.0), Pd/rGO (3.0) and Pd/rGO (4.0) in nitrogen saturated solutions of (a) 1 M KOH and (b) 1 M KOH/1 M CH3OH with scan rate of 50 mV s−1. (c) The chronoamperogram of Pd/rGO (0.5), Pd/rGO (1.0), Pd/rGO (2.0), Pd/rGO (3.0) and Pd/rGO (4.0) in nitrogen saturated solution of 1 M KOH/1 M CH3OH with scan rate of 50 mV s−1 at an applied potential of −0.2 V. Pd: palladium; rGO: reduced graphene oxide; Pd/rGO: reduced graphene oxide–supported palladium; KOH: potassium hydroxide; CH3OH: methanol.
ECSA, peak potential, peak current density and percentage of current drop over time of various Pd/rGOs.

ECSA: electrochemically active surface area; AgCl: silver chloride; Ag: silver; Pd: palladium; rGO: reduced graphene oxide; Pd/rGO: reduced graphene oxide–supported palladium.
The electro-oxidation of methanol of as-prepared electrocatalysts is shown in Figure 6(b). Relating to the XRD result, where Pd (111) crystal facets predominate for all samples, it can be inferred that Pd (111) is mainly responsible for the methanol oxidation reaction (MOR). Two peaks, which are forward peak at approximately −0.1 V and reverse peak at approximately −0.4 V, can be observed. The forward peak can be attributed to the methanol oxidation and the reverse peak can be ascribed by the oxidation of the residual carbon species. 33 Peak current density and peak potential of electrocatalysts are recorded in Table 3. The highest current density of Pd/rGO (1.0) can be attributed to the small size, uniform distribution and large ECSA of Pd catalysts. CA in Figure 6(c) reveals that Pd/rGO (1.0) retained highest current density and smallest current drop (Table 3). The better stability can be ascribed to the lower defect level because defects cause the as-synthesized electrocatalysts to corrode easily under electrochemical operation. 23 Owing to the attachment of intermediate species that were generated during methanol electro-oxidation to the surface of electrocatalysts, initial current density dropped rapidly. 34 When the poisoning species released over time, approximately 100 s, the current dropped steadily. 35
Conclusions
By keeping the ratio of Pd to rGO fixed at 1:1, Pd/rGOs of different concentrations were successfully synthesized by microwave reduction method in EG solution. Altering the concentration, the rate of nucleation and growth of NPs and stabilizing effect of GO change. These changes manipulate the mean particle size and distribution of catalysts on the surface of rGO. At concentration 0.5 mg mL−1, the GO was unable to stabilize the Pd NPs, furthermore, the rate of nucleation is low, forming large nuclei. By contrary, concentration at 1.0 mg mL−1 and beyond favoured the nucleation of large number of nuclei, meaning small-sized nuclei. However, concentration beyond 1.0 mg mL−1 resulted in rapid growth, leading to large particle size. The NPs were at close proximity in mixture with concentration beyond 1.0 mg mL−1, causing them to agglomerate together to reduce surface energy, and even overwhelmed the stabilizing capability of GO. Altering the concentration, the difference in NP size and MOR is approximately 15% and 195%, respectively. Results proved that 1.0 mg mL−1 is the optimum concentration.
Footnotes
Authors’ note
Chou Yong Tan and Boon Kar Yapa are also affiliated with International School of Advanced Materials, School of Materials Science and Engineering, South China University of Technology, 510640 Guangzhou, China. The raw/processed data required to reproduce these findings cannot be shared at this time as the data also form part of an ongoing study.
Declaration of conflicting interests
The author(s) declared no potential conflicts of interest with respect to the research, authorship and/or publication of this article.
Funding
The author(s) disclosed receipt of the following financial support for the research, authorship and/or publication of this article: This study was supported under the Frontier Research Grant (grant no. FG0011-17AFR), Postgraduate Research Grant (PPP; grant no. PG207-2015A) and Nippon Sheet Glass Foundation for Materials Science and Engineering (NSG Foundation; research grant no. IF014-2017). The authors gratefully acknowledge AUN/SEED-Net, JICA, University of Malaya and the Ministry of Higher Education Malaysia for the financial support.