
Abstract
The heterogeneous photocatalysis using semiconductor nanocrystals is an important process in the field of water treatment since it is a low cost, environmentally friendly, and zero waste technique. In this work, titanate nanostructures (sheets, tubes, and wires) were prepared by simple hydrothermal method. All samples were characterized by X-ray diffraction, transmission electron microscopy, Brunauer–Emmett–Teller surface area analysis, and Zetasizer. The results revealed that tuning the morphology of TiO2 changed the activity of the prepared nanostructures, where titanate nanowires exhibited the highest photocatalytic activity toward crystal violet dye, reaching 100% at pH 3 under ultraviolet illumination for 35 min.
Introduction
One of the most significant issues worldwide is the large demand and shortage of clean water. Around four billion people have no or little access to clean water. 1 The reuse of wastewater of industrial or agricultural activities (such as dyes, herbicides, pesticides, ....etc) after treatment will participate in solving this problem. Such pollutants are in part of being endocrine-disrupting chemicals (EDs). 2 About 20% of dyes are produced and lost during dying process around the world. Some of these colored dyes are extremely toxic to microorganisms, aquatic life, and human beings. These dyes produce toxic by-products after hydrolysis, oxidation, and other reactions in waste-water medium. 2,3 Among treatment methods are traditional physical techniques (adsorption, coagulation by chemical agent, ultrafiltration, reverse osmosis, ion exchange on synthetic adsorbent resin, etc). 4 These methods are not able to destroy these pollutants, but they only transfer them from liquid phase to solid phase generating toxic secondary pollutants. 5 Chemical methods such as chlorination generate carcinogenic and mutagenic by-products that threaten human health. It is also too expensive because they require high dosage of chemicals. 1,5 Advanced oxidation process is an innovative technology that is used for degradation of various organic pollutants by the generation of highly reactive species. 6 Heterogenous photocatalysis is the most effective and attractive method leading to complete mineralization of most of organic pollutants to CO2, water, or low molecular weight compounds under visible or UV light radiation. 5,7 –9 Photocatalytic degradation of various families of organic pollutants had been studied using semiconductors such as titanium dioxide (TiO2), ZnO, Fe2O3, CdS, GaP, and ZnS. 10 –19 TiO2 is the most widely used material in treating contaminated water because it is nontoxic, strong oxidant for organic pollutants, superhydrophilic, chemically stable, inexpensive, and insoluble. 5,20 –23
The mechanism of destruction of an organic pollutant using TiO2 nanostructures depends mainly on producing hydroxyl radicals (OH). TiO2 absorbs in the ultraviolet (UV) region of the electromagnetic spectrum and produce electron–hole pairs. The electron–hole (e–-h+) pairs generate superoxide ions (O2 −), peroxide radicals (OOH), hydroxyl ions (OH−), and H+ ions; these species are in contact with the surrounding water molecules and dissolved oxygen in the reaction. All these species will finally form hydroxyl radicals (OH). Free radicals are highly active and aggressive species in the chemical reactions which attack the pollutants forming different oxygenated intermediates and finally mineralizing them into CO2 and H2O.
TiO2 nanostructures can be prepared by using different methods such as sol-gel method, hydrothermal method, chemical vapor deposition, electrodeposition, and microwave-assisted method. 24,25 Variable morphologies of TiO2 (spheres, rods, fibers, tubes, sheets, interconnected architectures) have been fabricated using many methods; mainly electrospinning, templating, and hydrothermal methods.
The photocatalytic performance of TiO2 depends on many factors such as size, specific surface area, pore volume, pore structure, crystalline phase, and the exposed surface facet. 24,26,27 Achieving selective degradation using TiO2 depends on crystallinity and crystal facet. 28 –30 Recent studies explained selectivity of different morphologies for degradation of targeted dyes. 31 Introducing molecular sites on the surface of TiO2 also produce selective adsorption and degradation for targeted compounds. 32 Compared to the available data in literature, a small % of researches are focusing on studying the effect of morphology on the degradation efficiency.
Crystal violet (CV) is an industrial synthetic cationic dye with applications in biological staining, dermatological agent, veterinary medicine, and dye processing. It is a member of the triphenylmethane family. This dye is characterized as a toxic agent that destroys the aquatic life and has a risk to human health, because it can easily interact with negatively charged cell membrane surfaces and enter into cells and concentrate in cytoplasm and may even cause cancer. It is mutagenic and mitotic poison. Therefore, it is a significant environmental issue, that is, its elimination through transformation into non-hazardous species using different semiconductors. CV is chosen as the model pollutant in this research. It is usually difficult to degrade due to its complex structure which contains aromatic rings.
Herein in this work, titanate nanostructures (nanosheets, nanotubes, and nanowires) with different morphologies were prepared and employed in photocatalytic degradation of CV for the first time. Moreover, we investigated the influence of different morphologies on the degradation efficiency.
Materials and methods
Preparation of titanate nanostructures
As in our previously published work 26,33 with some modifications, 10 g of TiO2 (anatase) bulk-powder (TNP) was added to 500 mL of 10 M NaOH aqueous solution under constant stirring, then the solution was placed in a teflon-lined stainless steel autoclave with 1000 ml capacity and heated at 160°C for 6, 20, and 48 h to prepare TiO2 nanosheets (TNS), nanotubes (TNT), and nanowires (TNW), respectively. The formed white precipitates were collected and washed several times with distilled water. Samples were washed with 0.1 N HCl solution using ultrasonication, and the precipitates were finally calcinated at 500°C for 4 h in air.
Physical characterization of the photocatalysts
High-resolution transmission electron microscopy (HRTEM) micrographs were obtained from JEOL-JEM 2100 (Japan) with an acceleration voltage of 200 kV. X-ray diffraction (XRD) patterns were recorded on a PANalytical (Empyrean) XRD using Cu Kα radiation (wavelength 0.154 cm−1) at an accelerating voltage of 40 kV, current of 35 mA, scan angle 5–80° range, and scan step 0.02°. The zeta potential was measured by Zetasizer Nano-ZS90 (Malvern, UK). Brunauer-Emmett-Teller (BET) surface area was measured by N2 adsorption using Micromeritics TriStar II. UV-visible (Vis) diffuse-reflectance absorption spectra of the samples were collected on a ultraviolet-visible-near infrared (UV-VIS-NIR) spectrophotometer (Shimadzu UV-3600, Japan).
Photocatalytic experiments
Solution of CV was prepared by dissolving the colored powder in distilled water to obtain a solution concentration of 200 mg/l. The photocatalysis experiments were carried out in a 100 mL beaker containing about 20 mL of 5 ppm dye aqueous solution and about 0.02 g of the catalyst equal 1 g/l. The irradiation was carried out using a UV lamp as (wavelength 100–280 nm, 16 watt) a source of UV radiation, which was placed vertically on the reaction vessel at a distance of 20 cm. At specific time intervals, a certain amount of the sample solution was withdrawn, and the changes in concentration of the dye were observed using a UV-Vis spectrophotometer model (Thermo Scientific, Evolution 600, USA).
Results and discussion
Characterization of TiO2 and prepared titanate nanostructures
XRD pattern of the starting TiO2 is illustrated in Figure 1 (d), the sample of TiO2 revealed pure anatase form with excellent crystallinity, and the crystallite size was calculated using Scherer’s formula, which was found to be 69 nm. The data were compared and indexed with the ICDD card no 21-1272.

XRD patterns of (a) TNS, (b) TNT, (c) TNW, and (d) TNP. XRD: X-ray diffraction.
Figure 1(a) to (c) shows the XRD patterns of TNT, TNS, and TNW, and it is clear from patterns Figure 1(a) that the main characteristic peaks of titanate nanotubes were observed at 2θ; 9.8°, 24.2°, 28.2°, 48.2°, 61.7° correspond to the lattice planes of (200), (110),(310), (020), and (002), respectively, are the same as that of hydrogen titanium oxide hydrate nanotubes and coincide with [ICDD card no. 00-047-0124]. The crystal structure of nanosheets (TNS) that are observed as an intermediate product during nanotube or nanowires synthesis, with peaks observed at 2θ; 5.6°, 10.6°, 25.3°, 29.6°, 44.1°, and 48.3° (Figure 1(c)) may be assigned to dihydrogen trititanate (H2Ti3O7) structure which coincides with the monoclinic phase of titanate [ICDD card no. 01-077-4140]. Increasing the hydrothermal time to 48 h to get TNW alter the intensities of the peaks at 2θ; 9.8°, 24.2°, 28.2°, 48.2°, and 61.7° (Figure 1(b)) when compared to titanate nanotubes (TNT). The nanosheets exhibit different features, where peaks at 2θ; 9.7°, 24.5°, 28.76°, 48.3°, 60.8° correspond to the lattice planes of (200), (400), (310), (203), (1402), and (020).
The XRD pattern shows that as the morphology changed from 2-D form (TNS) to 1-D (TNT and TNW), the intensities of peaks at 2θ; 9.8°, 28.2°, and 48.2° increased significantly, while the peaks at 2θ 24.2° decreased. A new peak appeared at 2θ 61.2° in TNT and TNW. While the peak at 2θ 5° totally disappeared. It is clear from the previous data that each morphology has its own preferred orientation.
Figure 2 shows HRTEM images of TNS, TNT, TNW, and TNP supporting the change in morphology by change in heat treatment time during preparation. Figure 2(a) and (b) confirmed the successful formation of nanosheets, where many nonuniform layers can be observed. The existence of hollow structure in Figure 2 (c) and (d) indicating that nanotubes structure was obtained, the average inner and outer diameters of nanotubes are about 4 nm and 10 nm, respectively. The multiwalled character of the tubes is very clear in Figure 2(d), which is an evidence of the tubular morphology with good crystallinity confirming the obtained XRD diffractogram. Hydrothermal treatment for 48 h resulted in the transformation of the nanotubes to nanowires with non-hollowed structure with different aspect ratios, with average diameter of 5 nm as shown in Figure 2(e) and (f). HRTEM image of the starting TiO2 is shown in Figure 2(g), and it is clear from the figure that the particles are not uniform in size.

TEM images of TNS (a, b), TNT (c, d), TNW (e,f), and (g) TNP. TEM: transmission electron microscopy.
The surface area was calculated using BET method, which was found to be 9, 73, 84 and 72 m2/g for TNP, TNS, TNT, and TNW, respectively. The isotherms of nitrogen adsorption on the surface of TNS, TNT, TNW, and TNP are shown in Figures 3(a) to (d), respectively. The observed hysteresis loops at high relative pressure indicate that the three morphologies are mesoporous. In case of TNT, it can be attributed to the inner cavities of the tubes; while in case of TNS and TNW, it is mainly resulted from the pores between agglomerated sheets and wires.

The isotherms of nitrogen adsorption on the surface of (a) TNP, (b) TNW, (c) TNT, and (d) TNS.
Electronic properties
Diffuse reflectance spectra of titanate nanostructures are shown in Figure 4. The band gap energies of the samples were calculated from the diffuse–reflectance spectra by performing a Kubelka–Munk analysis 34 using the equation
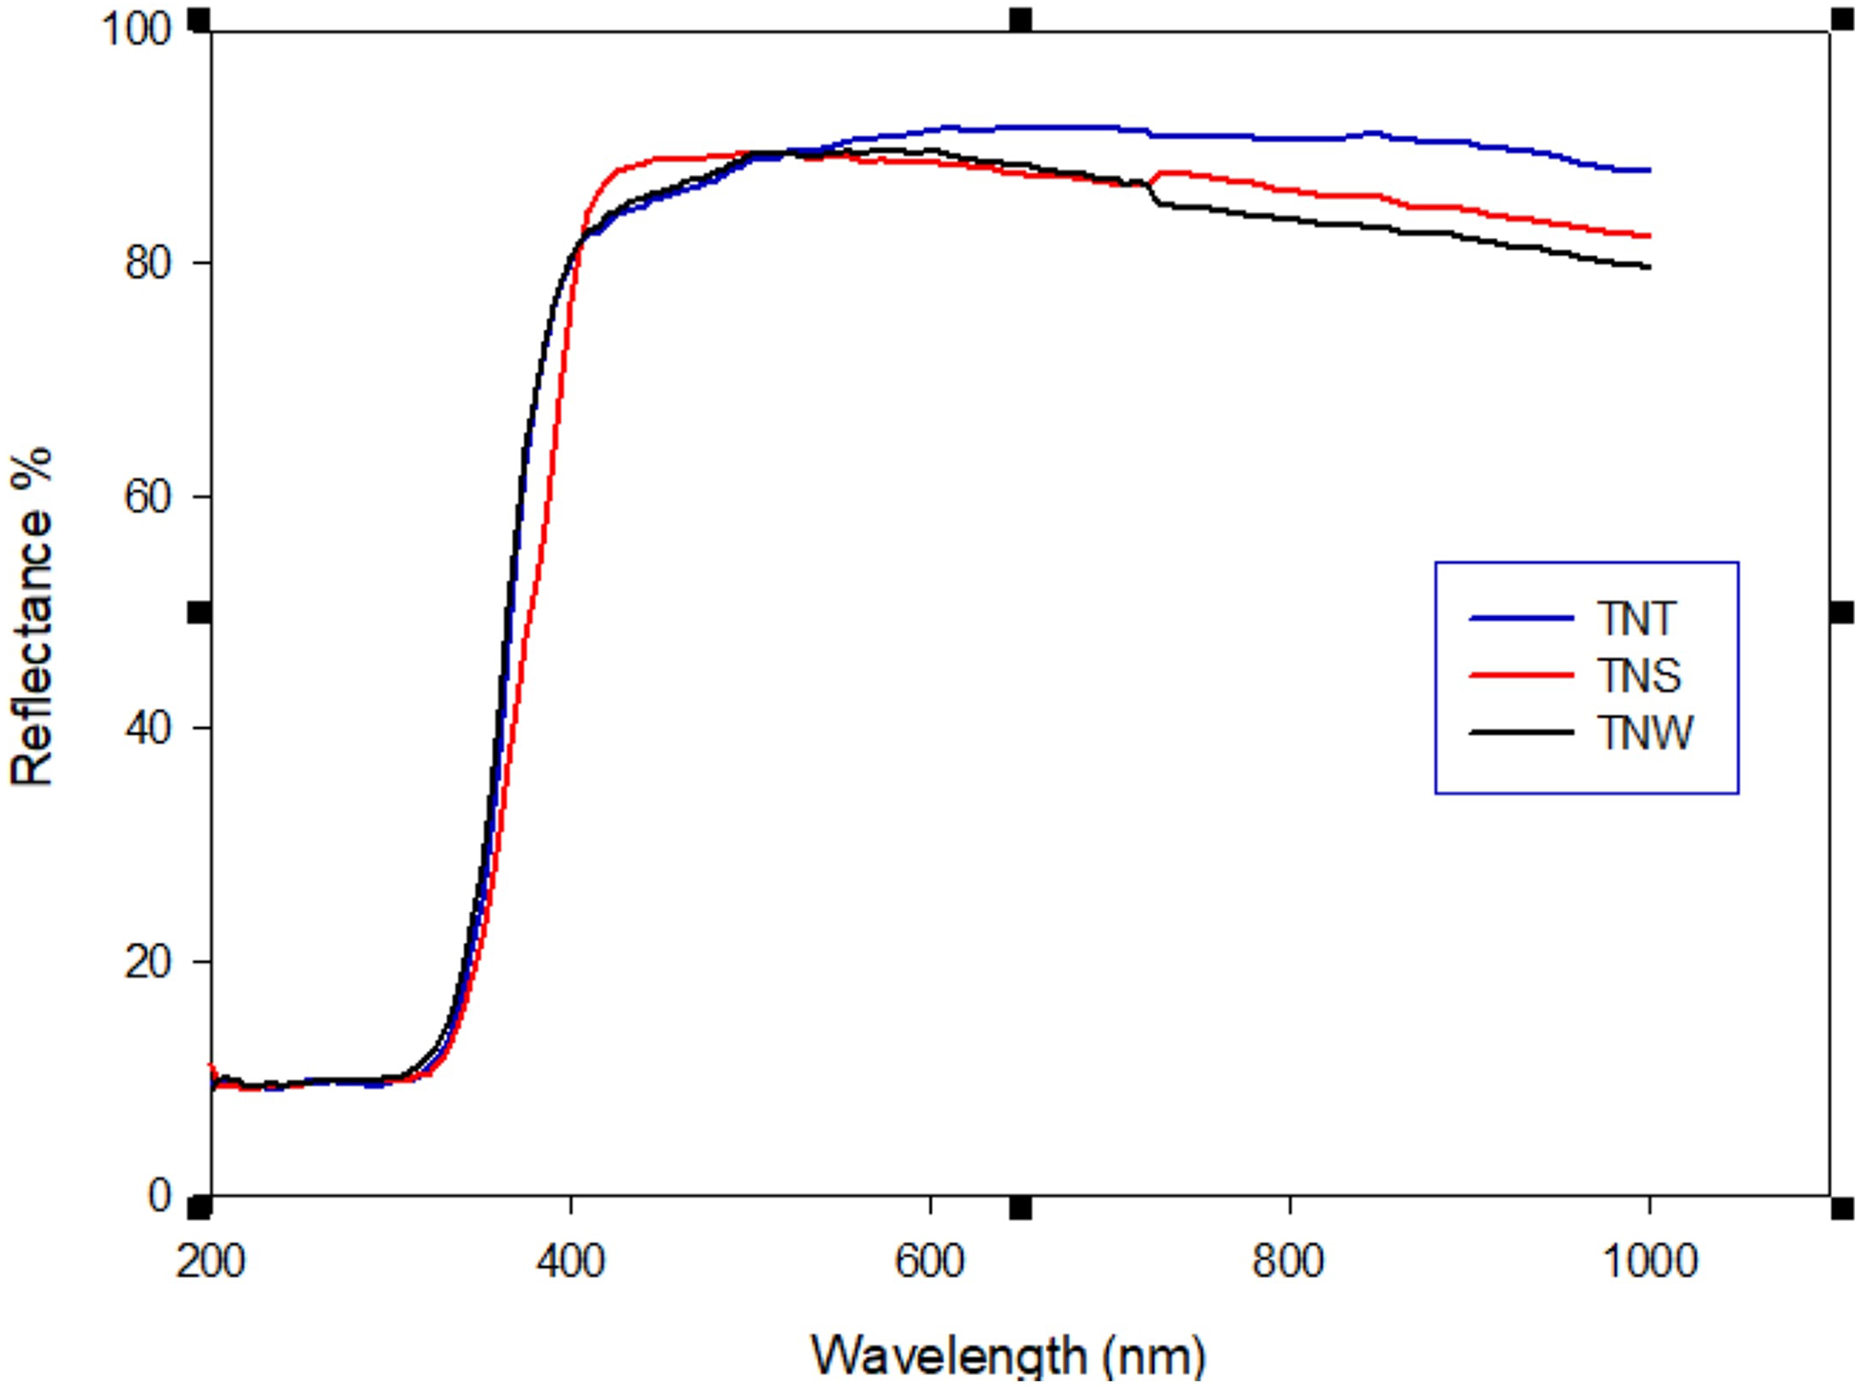
UV-Vis DRS spectra of morphologically different titanate nanostructures. UV-Vis: ultraviolet-visible; DRS: diffusion reflectance spectra.
F(R) = (1 − R)2/2R where R is the diffuse reflectance. A modified Kubelka–Munk function can be obtained by multiplying the F(R) function by hv, using the corresponding coefficient (n) associated with an electronic transition as follows: (F(R) × hv) n . By plotting this equation as a function of the energy in electron volts, the band gap can be calculated. It was found to be 3.35 (eV), 3.5 (eV), and 3.55(eV) for TNT, TNS, and TNW, respectively, in Figure 5. This difference in band gap may be attributed to the difference in size, since the band gap of nanomaterial-based photocatalysts is size-dependent. 35,36

Graphical representation of modified Kubelka–Munk function for TNT, TNS, and TNW.
The mechanism of hydrothermal growth
From the obtained results of XRD, TEM, and BET analyses, it is clear that TNS, TNT, and TNW formation mechanism is agreed with that found in literature.
20,37
–39
In our work, the process of transformation of raw TiO2 (TNP) to different titanate nanostructures can be summarized into several stages as follows and summarized in Figure 6(a) and (b). Dissolving of raw TiO2 and growth of single-layer or multilayered nanosheets of sodium titanate which play an important role during the formation of the nanotubular morphology. Curving and wrapping nanosheets to nanotubes , the driving force for this curving is proposed by several groups. Zhang’s group
40
proposed that an asymmetrical chemical environment is caused by the H+ or Na+ ion concentration imbalance on the different locations of the titanate nanosheets. Bavykin et al.
41
proposed the bending of the multilayered nanosheets is due to the mechanical tension resulted from the nanosheets dissolution and crystallization process. By further hydrothermal treatment, the nanotubes will transform to nanowires.
37,42,43

(a). Graphical representation of the transformation of TiO2 powder to TNS, TNT, and TNW. (b) Schematic illustration of the reaction method and the formation mechanism of TNS, TNT, and TNW.
Photocatalytic degradation of CV
Effect of dyes solution pH
Figure 7(a) to (d) shows the change in concentration of aqueous solution of CV as a function of irradiation time at different pH values. It is clear from figure that the three morphologies showed the best activity toward CV at pH 3 compared to other pH values, where the degradation % reached 100% using TNW, TNT, and TNS in 35, 45, and 75 min, respectively. By increasing the solution pH to 5 and 7, none of the three morphologies was able to completely degrade CV in 8 h (840 min), where TNT showed the best activity at pH 5 (98%), and TNS at pH 7 (95%) and 8, respectively. In slightly alkaline solution (pH 8), the photocatalytic activities of the three morphologies increased again and reached 100%, 99%, and 88% for TNT, TNS, and TNW, respectively. This increase in activity may be attributed to the presence of hydroxyl ions in the alkaline solution (OH) which react with the holes in the conduction bands of the photocatalysts to form hydroxyl radicals, and these radicals attack the dye molecules to form smaller intermediate molecules then CO2 and H2O. Similar trend at lower pH values was observed by Kassaee et al. 44 It is worth mentioning that CV is colorless at pH ≥9, and also its color changes at highly acidic pH values, 44 therefore, the range of pH for this study was selected to be from 3 to 8.
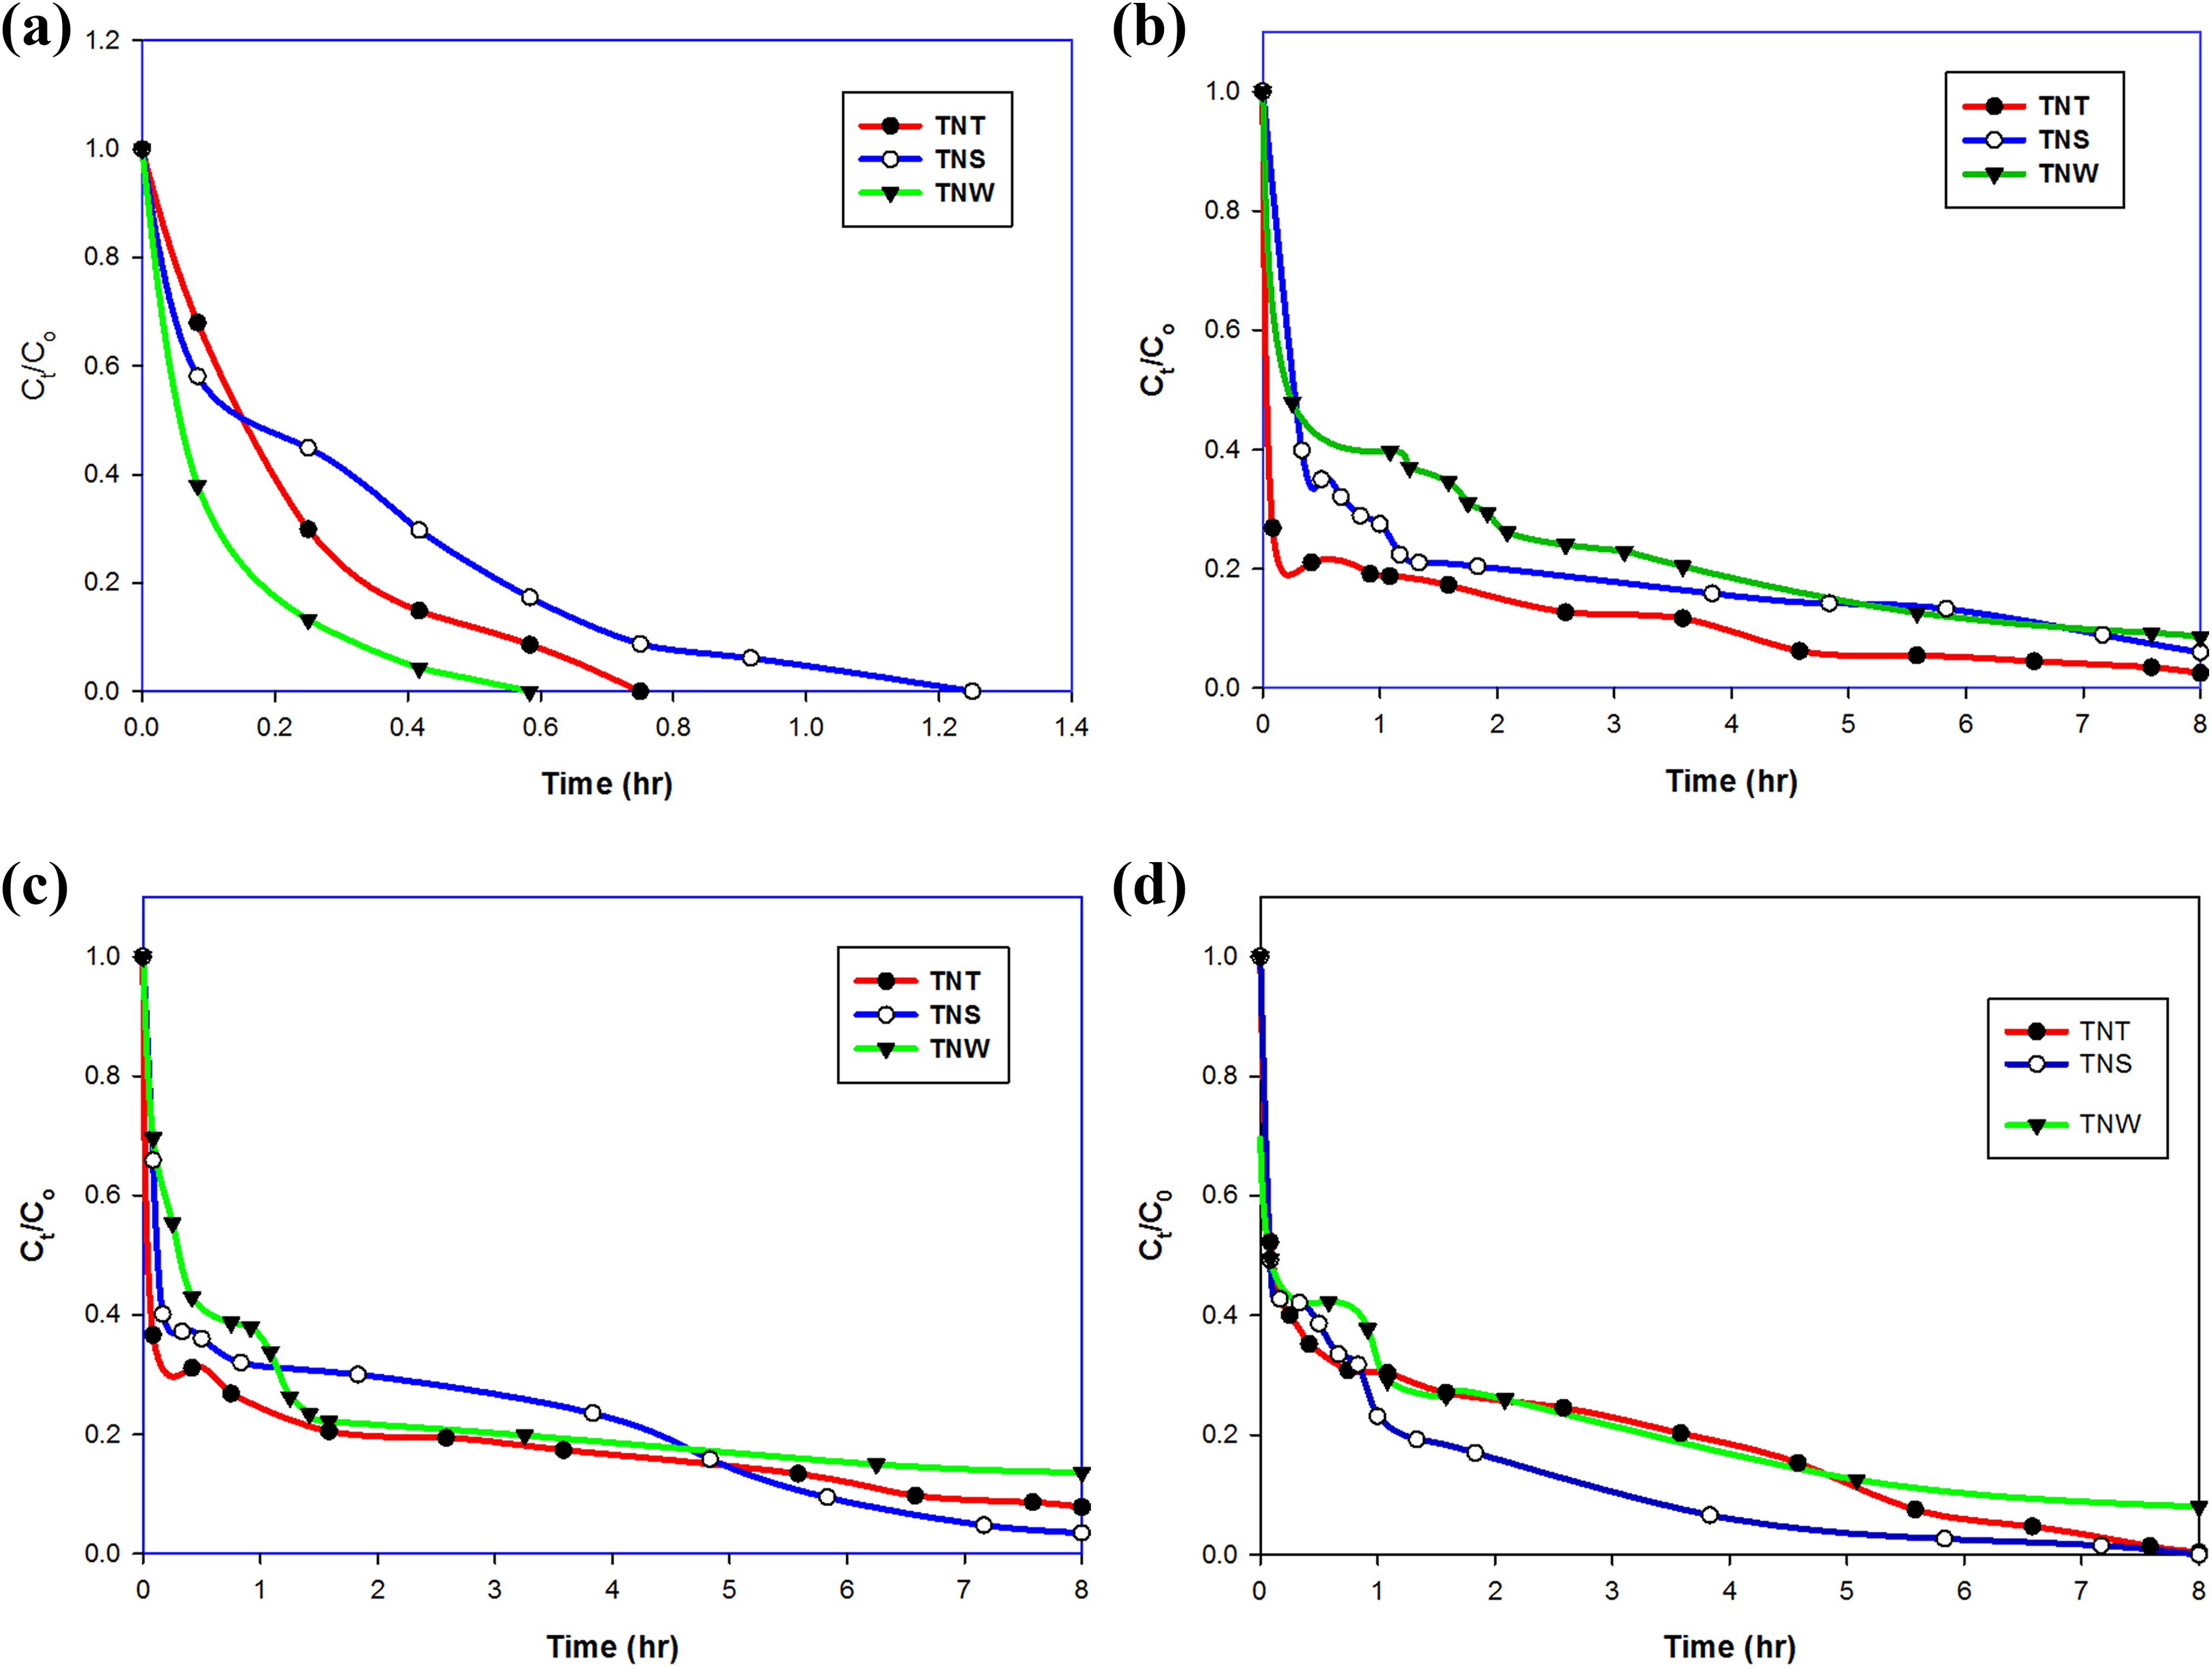
Photocatalytic activity of TNT, TNS, and TNW at (a) pH 3; (b) pH 5; (c) pH 7; (d) pH 8.
Effect of zeta potential, surface area, and titantae structure
Table 1 summarizes the obtained data for TNS, TNT, and TNW. The presented data show the degradation percentage of CV using different nanostructures at different pH values. The data revealed that the photocatalytic activity does not depend strongly on zeta potential, since the highest zeta potential value was −34 for TNW at pH 7, and the lowest degradation% was achieved at this condition. The data also indicated that the measured BET surface areas are too close. They were found to be 73, 84, and 72 m2/g for TNS, TNT, and TNW, respectively.
Summary of the obtained data for TNS, TNT, TNW, BET, zeta potential values, and the degradation percentage of CV after 8 h at different pH values for each morphology.
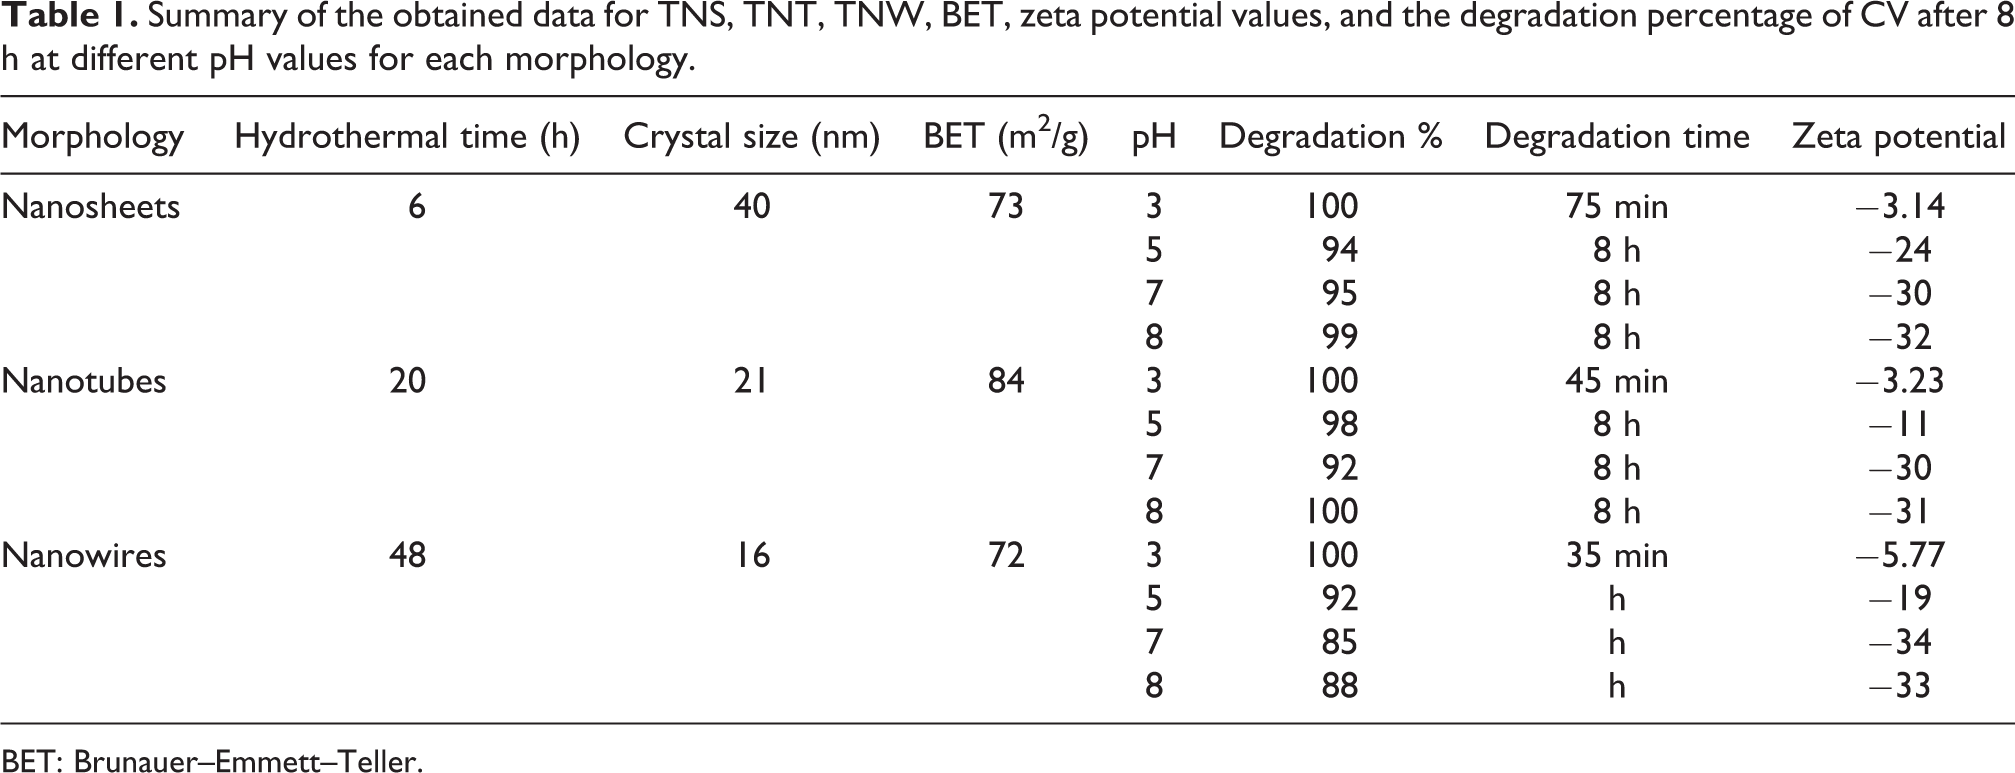
BET: Brunauer–Emmett–Teller.
The preferred orientations of the prepared titanate nanostructures may be the main reason for the observed difference in their photocatalytic activities. Some recently published researches paid great attention to the role of crystals orientations in the photocatalysis processes. 26 This preferred orientation makes the dye adsorb preferentially on certain phases of the desired photocatalysts.
In photocatalysis process, the first step is the adsorption of the targeted molecules on the photocatalysts’ surface. This step is very important that affects the overall efficiency of this process. There are many factors affecting on the selectivity in the adsorption stage such as changing the amount, size, morphology, and surface of the catalyst used, as well as the type or size of the target compounds. Some studies showed altering the exposed surfaces of TiO2 nanoparticles by controlling the morphologies of these particles. From these previous research, the dominant exposed {1 0 1} or {0 0 1} crystal facets of the TiO2 has a big effect in selectivity of air pollutants; for oxidizing the NO gas to NO2 and NO3 −, the calcined TiO2 anatase nanoplatelets exhibited the best photocatalytic activity. Also, modifying the surface of TiO2 microspheres by varying the degree of the etching of {001} facets exhibited tunable photocatalytic selectivity toward the decomposition of azo dyes in water. In our recently published work, we found that changing the morphology of TiO2 from spherical structure to the layered and tubular morphology made each morphology resulted in a preferential decomposition of one dye more than the others. 26 In this work, CV preferred to be adsorbing on specific morphology and decomposed more rapidly than other morphologies at certain pH values.
Table 2 is a summary of the catalytic activity of reported photocatalysts as compared with our obtained results, and it is clear from these data that our materials showed higher activities compared to those used the same irradiation sources.
Comparison of CV dye degradation by some photocatalysts compared to our results.

TNS: TiO2 nanosheets; TNT: titanate nanotube; TNW: titanate nanowires; CV: crystal violet; UV: ultraviolet; NPs: nanoparicles; PVP: Polyvinylpyrrolidone.
Conclusion
Titanate nanostructures (nanosheets, nanotubes, and nanowires) were prepared by hydrothermal method, and the photocatalytic activity of the three morphologies was tested against CV as a model dye. It was found that all morphologies showed different degradation efficiencies, where the nanotubes showed the highest degradation %. Based on these findings, it is concluded that the photocatalytic activity of titanate can be tuned by tuning the titanate morphology.
Footnotes
Acknowledgment
We would like to thank Professor SI El-dek for their contribution to improve the quality of our work.
Declaration of conflicting interests
The author(s) declared no potential conflicts of interest with respect to the research, authorship, and/or publication of this article.
Funding
The author(s) received no financial support for the research, authorship, and/or publication of this article.