
Abstract
Using an FeOOH/Mg(OH)2 precursor, maghemite-based magnetic nanoparticles can be prepared by a chemically induced transition in an Iron(II) chloride (FeCl2) treating solution. FeCl2 solutions of various concentrations were used to investigate the dependence of sample components and magnetization on the treating solution. The bulk chemical species, crystal structures, surface chemical components, morphologies, and specific magnetizations of the samples were characterized. When the concentration of FeCl2 solution was in a moderate range of 0.060–0.250 M, maghemite nanoparticles coated by hydromolysite, that is, maghemite/hydromolysite nanoparticles, could be prepared. At lower concentrations, below 0.030 M, the samples contained maghemite/hydromolysite and magnesium oxide nanoparticles, and at higher concentrations, up to 1.000 M, the samples contained maghemite/hydromolysite and hydromolysite nanoparticles. The molar and mass percentages of each phase were estimated for each sample. The apparent magnetization behavior of the samples, which exhibited a non-monotonic variation with increasing concentration of FeCl2 solution, is explained from the variation of mass percentage of the maghemite phase with concentration.
Introduction
Nanoscale materials having dimensions of roughly 1–100 nm can display different physical and chemical properties from those of their bulk counterparts. Nanoparticles are typically defined as solids measuring less than 100 nm in all three dimensions. 1 Magnetic nanoparticles have attracted increasing interest as particles in this size range and may allow investigation of fundamental aspects of magnetic ordering phenomena in magnetic materials with reduced dimensions, leading to new technological applications. 2 –4 Studies of magnetic nanoparticles have focused on the development of novel synthesis methods. 1 The synthesis of nanoparticles is a complex process, and hence there is a wide range of techniques available for producing different kinds of nanoparticles. 5 Liquid-phase synthesis remains one of the most common methods to obtain inorganic nanoparticles. The synthesis of many oxide nanoparticles, including ferrite particles, can be achieved by the co-precipitation method. Reactions for the synthesis of oxide nanoparticles can be classified into two categories: oxide nanoparticles produced directly and production of a precursor that is then subjected to further processing (drying, calcination, and so on). 6
Iron (Fe) oxides, including maghemite (γ-Fe2O3), magnetite, hematite, akaganetite, and goethite, have attracted enormous attention due to their interesting electrical, 7 magnetic, 8 and catalytic 9 properties. They show a wide variety of potential applications in various fields as electro-optical materials, 10 sorbents, 11 ion exchanges, 12 magnetic resonance imaging, 13 catalysis, 14 biotechnology, 15 magneto-optical effects, 16 the removal of toxic metals ions, 17 and so on. In the past decade, the synthesis of magnetic Fe oxide nanoparticles has been intensively developed not only because of its fundamental scientific interest but also for its many technological applications. 18 Many methods have been presented for the preparation of γ-Fe2O3 nanoparticles, such as co-precipitation, gas-phase reaction, thermal decomposition, sonochemical synthesis, microemulsion techniques, hydrothermal synthesis, 19 –25 and so on. Generally, the preparation of γ-Fe2O3 particles by FeOOH transformation is a complex process, including dehydration, reduction, and oxidation. 26 Recently, we proposed a method of liquid-phase synthesis to produce γ-Fe2O3-based magnetic nanoparticles, which involved preparing an FeOOH/Mg(OH)2 precursor having loose aggregation without regular edges and treating the hydroxide precursors in an Iron(II) chloride (FeCl2) solution at 100°C. 27 For the preparation, FeOOH species dehydrated to transform it into the γ-Fe2O3 nanoparticles and Mg(OH)2 dissolved to act as a precipitation agent. This method is referred to as chemically induced transition (CIT), 28 which is a novel reaction on a nanoscale and may provide a new route for the preparation of oxide nanoparticles. In the work presented here, we investigate the components and magnetization of the nanoparticles as a function of the concentration of FeCl2 treating solution used.
Experiments
Chemicals
FeCl2.6H2O(AR), Mg(NO3)2.6H2O(AR), NaOH(AR), FeCl2.4H2O(AR), and acetone(AR) were all purchased from China National Medicines Corporation Ltd (Shanghai, China), and they were used as received without further purification. Distilled water was used throughout the experiments.
Preparation
The preparation of the nanoparticles by a CIT was divided into two steps. First, a precursor based on FeOOH wrapped with Mg(OH)2 was synthesized using the well-known co-precipitation method, which has been described in detail elsewhere. 24 Second, 5 g of the dried precursor was added to various FeCl2 solutions using the concentrations of 0.010, 0.030, 0.060, 0.125, 0.250, and 1.000 M to obtain 400 mL of solution (samples 1–6, respectively). The mixing solutions, whose pH values were about 6, were then heated to boiling for 30 min in atmosphere, and the nanoparticles gradually precipitated out after the heating was completed. Finally, these samples were washed with acetone and allowed to dry at laboratory atmosphere. It was noted that sample 6 was significantly more hydrophilic than the other samples.
Characterization
The bulk chemical species were analyzed by energy disperse X-ray spectroscopy (EDS) using an EDS spectrometer on a scanning electron microscope (Quanta-200, Hillsboro, Oregon State, USA) at 25 kV. The crystal structures were measured by X-ray diffractometry (XRD; D/Max-RC, Japan) with Cu Kα radiation. Sample’s morphologies and microstructure were observed by transmission electron microscopy (TEM) and high-resolution TEM (HRTEM; JEM-2100F, Japan). Surface chemical compositions were analyzed using X-ray photoelectron spectroscopy (XPS, ESCALAB 250Xi; Boston, Massachusetts, USA) with Al Kα radiation. The specific magnetization curves of the precursor and a series of samples were measured by a vibrating sample magnetometer (HH-15; China) using go-and-return magnetic field cycles at room temperature.
Results and analysis
EDS analysis indicated that all the samples contained oxygen (O), Fe, and chlorine (Cl) elements. In addition, there was magnesium (Mg) in samples 1 and 2. For quantitative analysis, many zones in each sample were probed to average the content of each element. Typical EDS spectra and the zone probed are shown in Figure 1. The quantitative results are shown in Table 1. The ratio of Cl to Fe increased monotonically with increasing concentration of FeCl2 solution, which means the Cl-containing phase increased with increasing concentration.

Typical (a) EDS spectra and (b) zone probed for the samples. EDS: energy disperse X-ray spectroscopy.
Atomic percentages of the samples from EDS.
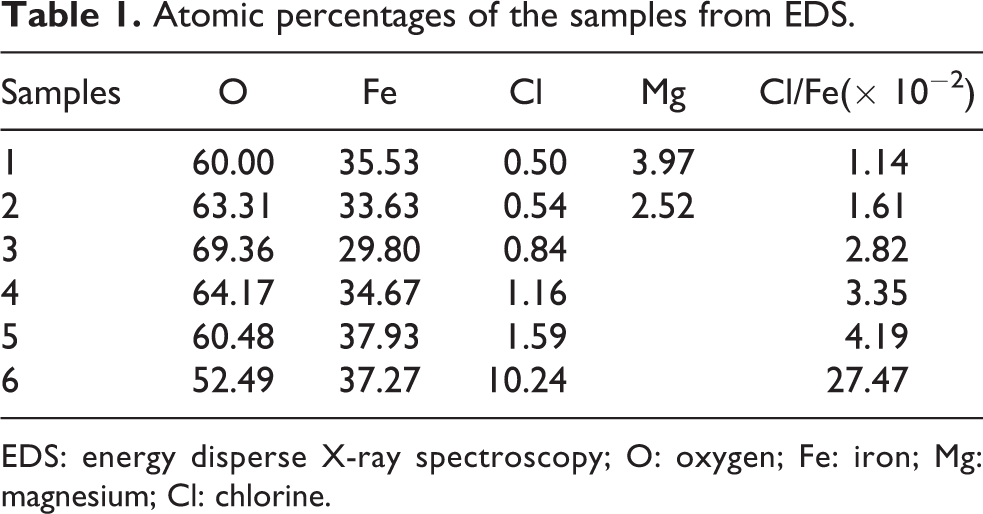
EDS: energy disperse X-ray spectroscopy; O: oxygen; Fe: iron; Mg: magnesium; Cl: chlorine.
The XRD results (Figure 2) showed that these samples contained mainly γ-Fe2O3 (JCPDS file 39-1346). In addition, there could be trace of hydromolysite (FeCl3·6H2O; JCPDS file 33-0645), whose diffraction peaks of (

XRD patterns for the samples with (hkl), (hkl)Mg, and (hkl)Cl corresponding to γ-Fe2O3, MgO, and FeCl3.6H2O, respectively. (?)Mg means that the index corresponding the peak of MgO is undetermined in JCPDS file 30-0794. XRD: X-ray diffractometry; γ-Fe2O3: maghemite; MgO: magnesium oxide; FeCl3.6H2O: hydromolysite.
Typical TEM images of the samples are shown in Figure 3. Particles in samples 1–5 are mostly spherical, with size ranging from 4 nm to 20 nm. Samples 1 and 2 show a mixture of large (arrow A) and small (arrow B) particles. Sample 6 shows both rod-shaped (inset) and spherical particles. HRTEM indicates that the spherical and rod-shaped particles in sample 6 are γ-Fe2O3 and FeCl3·6H2O single crystalline grains, respectively, as shown in Figure 4. Also, as shown in Figure 4, it can be seen from HRTEM images that the both γ-Fe2O3 and FeCl3·6H2O particles contained a coating layer, whose thickness is about 0.8 nm. The fast Fourier transform pattern of the spherical particles (inset, Figure 4(a)) justifies the crystalline plans displayed on the XRD pattern.

TEM images for the samples. TEM: transmission electron microscopy.

HRTEM image of (a) spherical particle and (b) rod-shaped particles in sample (6). The corresponding spacing of 0.250 nm is indexed to the (311) plane of γ-Fe2O3 and that of 0.443 nm is indexed to the (11) plane of FeCl3·6H2O, respectively. Inset exhibits the FFT pattern of the image. HRTEM: high resolution transmission electron microscopy; FFT: fast Fourier transform; γ-Fe2O3: maghemite; FeCl3.6H2O: hydromolysite.
Combining the results from EDS, XRD, and HRTEM, we conclude there could be two Fe-containing phases, γ-Fe2O3 and FeCl3·6H2O in all samples and an additional MgO phase in samples 1 and 2. To study the surface characteristics of the particles, XPS analysis was carried out, which indicated the existence of the same chemical species for each samples as EDS. It is known that XPS spectra can be used to determine the oxidation state and the environment of Fe. 29 –31 For samples 1–5, the measured binding energy of O1s was approximately 530 eV, which agreed with binding energy of O1s line for ferric oxide. 31 The binding energy of O1s for sample 6 was 531.7 eV, which was significantly larger than that of the other samples and meant having two components. The Fe 2p3/2 peaks for all the samples were approximately 710.5 eV, which could be assigned to Fe3+ oxidation sample. Accordingly, the Fe 2p3/2 peaks were resolved into two peaks for each of the samples, and the O1s peak was resolved into two peaks for sample 6, as shown in Figure 5, in which the solid lines are experimental results and dashed lines are resolved results. Table 2 summarizes the results extracted from the XPS analysis. These results confirmed the presence of γ-Fe2O3 and FeCl3·6H2O in all samples, MgO in samples 1 and 2, and molecular water in sample 6. In addition, the O1s peak corresponding to crystal water (P1 peak) in sample 6 is very strong, whereas that in other samples is difficult to distinguish. This means that the FeCl3·6H2O phase in sample 6 could be far more than that in other samples. The signal collection depth in the XPS experiments is 3λ, where λ = 1.12 nm for Fe 2p electrons. 32 Thus, combining the results of HRTEM, it can be judged that for spherical particles contain γ-Fe2O3 and FeCl3·6H2O, γ-Fe2O3 is the core, and FeCl3·6H2O is the coating due to the depth of the Fe 2p electrons measured in XPS (approximately 3.4 nm) being larger than the thickness of the coating layer (approximately 0.8 nm).

XPS spectra of the (a) O 1s and (b) Fe 2p3/2. XPS: X-ray photoelectron spectroscopy; O: oxygen; Fe: iron.
Binding energies from XPS (electronvolt) for the elements in the samples.a

aData for Fe2O3, FeCl3, MgO, and H2O are sourced from the NIST online database for XPS (www.nist.gov).
XPS: X-ray photoelectron spectroscopy; O: oxygen; Fe: iron; Mg: magnesium; Cl: chlorine.
Figure 6 shows the specific magnetization curves of the precursor and the samples. The precursor was paramagnetic, whereas the samples prepared using the FeCl2 treating solution exhibited a superparamagnetic-like transition having no clear remanence or coercivity. The specific magnetization of the samples varied non-monotonically, similar to the γ-Fe2O3 diffraction peak intensity, with increasing concentration of FeCl2 treating solution, that is, magnetization increased as the concentration of the treating solution increased from 0.010 M to 0.060 M and then decreased with increasing concentration from 0.060 M to 1.000 M. The specific saturation magnetization (σs ) of as-prepared samples was obtained from σ versus 1/H data at high field. 33 The values of σs are listed in Table 3.

Specific magnetization curves for the precursor and samples.
Specific saturation magnetization, σs , molar percentage, yi , and mass percentage, zi , of the phase for the samples.
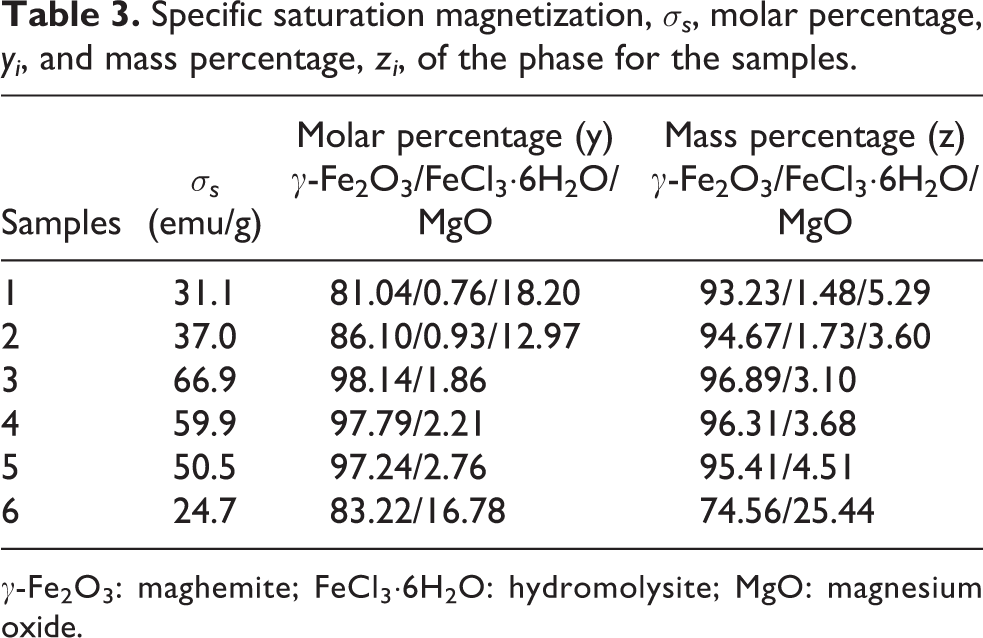
γ-Fe2O3: maghemite; FeCl3·6H2O: hydromolysite; MgO: magnesium oxide.
Discussion
According to the experimental results and analysis, it was determined that when the precursor based on FeOOH/Mg(OH)2 was treated in the FeCl2 solution, the FeOOH species was transformed into γ-Fe2O3 crystallites by dehydration, and the Mg(OH)2 species was dissolved to either assist the precipitation of nanoparticles or to form MgO particles. During the precipitation, both Fe3+ resulted from the oxidized Fe2+ and Cl− were absorbed on the γ-Fe2O3 crystallites to form γ-Fe2O3-coated FeCl3·6H2O (γ-Fe2O3/FeCl3·6H2O) nanoparticles, and single FeCl3·6H2O nanorods could also be formed. The characteristics of the as-prepared sample components depended on the concentration of the FeCl2 treating solution used. In a moderate concentration range from 0.060 M to 0.250 M, the samples were pure γ-Fe2O3/FeCl3·6H2O nanoparticles, in which γ-Fe2O3 crystallites were coated by FeCl3·6H2O. 28 With concentrations less than 0.060 M, the dissolved Mg partially formed MgO, such that the sample contained spherical γ-Fe2O3/FeCl3·6H2O nanoparticles and a few MgO nanoparticles. For high concentrations, the samples contained spherical γ-Fe2O3/FeCl3·6H2O nanoparticles and rod-shaped FeCl3·6H2O nanoparticles, which shown that in addition to Fe3+ and Cl− adsorbing on the γ-Fe2O3 crystallites to form FeCl3·6H2O coating, excessive Fe3+ and Cl− would crystallize to form FeCl3·6H2O nanorod. On the surface of the rod-shaped particles, there exists a thin amorphous layer (see HTRM image), which could result from crystal symmetry breaking at the surface. 1,34 Furthermore, for concentrations exceeding 0.060 M, the samples contained no MgO species. This indicates that the acidity of the treating solution, which increased with increasing FeCl2 concentration, could make MgO formation difficult.
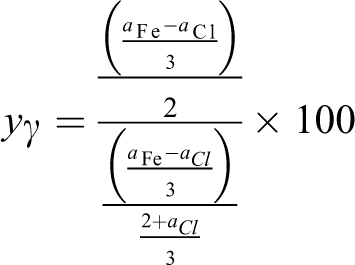
For magnetic nanoparticle systems having many phases, the magnetization of the system is related to the ratios among the phases. 26,35 Samples 1 and 2 included γ-Fe2O3, FeCl3·6H2O, and MgO phases. Using the measured atomic percentages of Fe, Cl, and Mg (a Fe, a Cl, and a Mg, respectively), the molar percentages of the γ-Fe2O3 phase, yγ , FeCl3·6H2O phase, y Cl, and MgO phase, y Mg, could be estimated by


and

Samples 3–6 have γ-Fe2O3 and FeCl3·6H2O phases. Using the measured atomic percentages of Fe and Cl (a Fe and a Cl, respectively), the molar percentages of yγ and y Cl are estimated by
and

Thus, the molar percentages of yi in the respective samples are estimated from the atomic percentages (a Fe, a Cl, and a Mg) measured by EDS (see Table 1). These values are listed in Table 3. The mass percentage of each phase in a sample, zi , is

where Ai is the molar mass of the ith phase. The calculated zi values are also listed in Table 3. The γ-Fe2O3 content changed non-monotonically with increasing concentration of FeCl2 solution, similar to the XRD results. Also, it can be seen from Table 3 that the FeCl3·6H2O content increased monotonically with increasing concentration of FeCl2 treating solution, which confirms that the FeCl3 in the samples resulted from the treatment solution. From Table 3, the FeCl3·6H2O content in sample 6 is significantly larger than that in the other samples. The additional oxide has a binding energy approximately 532.00 eV (Table 2), which could be attributed to crystal water in the FeCl3·6H2O, which are hydrophilic. As a consequence, sample 6 was significantly more hydrophilic than the other samples since the FeCl3·6H2O content of the former was far more than that of the latter. Additionally, the FeCl3·6H2O content in samples 1–5 is much less than the γ-Fe2O3 content, and so the additional oxide is difficult to distinguish from the oxide of γ-Fe2O3 from the O spectrum of the XPS.
For the systems of particles containing many phases, the magnetization should be given by the weighted sum of the contribution from every phase. For samples 1 and 2, the specific magnetization, σ, is

whereas for samples 3–6, it is

where σγ , σ Cl, and σ Mg are the specific magnetization of γ-Fe2O3, FeCl3·6H2O, and MgO phases, respectively, and φm,i=(zi /100) is the mass fraction. Since FeCl3·6H2O and MgO are non-magnetic and z Cl, z Mg is much less than zγ , equations (4) and (5) can be simplified as

Thus, the specific magnetization of the samples is determined by the mass fraction of the γ-Fe2O3 phase. From Table 3, φm,γ varies non-monotonically with increasing concentration of FeCl2 solution, that is, φm,γ increases with increasing concentration from 0.010 M [sample (1)] to 0.060 M [sample (3)], then decreases as the concentration increases to 1.000 M [sample (6)], which corresponds with the measured σs from samples (1)–(6).
Conclusions
Using a CIT to prepare γ-Fe2O3-based magnetic nanoparticles, the components of the as-prepared products were found to depend on the concentration of the FeCl2 treatment solution. When the FeCl2 concentration was less than 0.060 M, the samples consisted of γ-Fe2O3/FeCl3·6H2O and spherical MgO nanoparticles. When the FeCl2 concentration reached 1.000 M, the sample consisted of spherical γ-Fe2O3 and rod-shaped FeCl3·6H2O nanoparticles. In an appropriate range of FeCl2 concentration in the treating solution, 0.060–0.250 M, the samples contained only spherical γ-Fe2O3/FeCl3·6H2O nanoparticles. The apparent magnetization was determined by the content of the γ-Fe2O3 phase presented in the sample. As the concentration of FeCl2 solution increased, the consequent concentration of FeCl3·6H2O increased, whereas that of MgO decreased, such that the mass fraction of γ-Fe2O3 varied non-monotonically. Thus, the specific magnetization of the samples also exhibited non-monotonic variation with increasing concentration of FeCl2 solution. For the γ-Fe2O3/FeCl3·6H2O magnetic nanoparticles, the FeCl3·6H2O inert surface helped improve their chemical stability and prevented aggregation. In the concentration range of 0.060–0.250 M, the samples contained single γ-Fe2O3/FeCl3·6H2O nanoparticles. The ratio of the γ-Fe2O3 to FeCl3·6H2O phase and hence the magnetization can therefore be modified by changing the concentration of FeCl2 solution used. Such γ-Fe2O3-based nanopaticles having hydrophilic FeCl3·6H2O could be very suitable for the synthesis of the ionic ferrofluids. 36
Obviously, for the preparation of γ-Fe2O3-based magnetic nanoparticles by the CIT method, the dehydration of FeOOH into γ-Fe2O3 (2FeOOH→γ-Fe2O3 + H2O) was induced by the Fe2+ in the FeCl2 solution transforming into Fe3+. The relation between the acting energy of alkali-oxide dehydration and oxidation of ferrous ions may be very interesting as it indicates an unknown reaction process and a new route for preparing oxide nanoparticles. This mechanism will be further investigated.
Footnotes
Declaration of conflicting interests
The author(s) declared no potential conflicts of interest with respect to the research, authorship, and/or publication of this article.
Funding
The author(s) disclosed receipt of the following financial support for the research, authorship, and/or publication of this article: Financial support for this work was provided by the Innovation Foundation Project of Southwest University, China (grant no. 1318001), and the National Science Foundation of China (grant no. 11274257).