
Abstract
In the presented experiments the carbonation process in multiphase system was carried out using the reactor with rotating discs. Calcite was produced by controlled fast precipitation through gaseous carbon dioxide adsorption in calcium hydroxide slurry with the constant discus revolution speed rate equal to 120 r min−1. Initial concentration and volume of the slurry was equal to 23 mM l−1 or 54 mM l−1 and 1 l or 2 l, respectively. The size of monodispersed single crystals precipitated in the aqueous solution was strongly dependent on the process parameters and varied (scanning electron microscope pictures, ImageJ Programme calculation) from 90 nm to 320 nm. To explain the way of single calcite crystal nucleation and growth the simulation of the crystals formation has been performed. This simulation bases on the new model, which takes into account kinetics of the multiphase reaction, crystals nucleation and their growth. Crystal morphology data obtained during the precipitation process have been compared with the model simulation results. The internally consistent model very well describes formation of the calcite nanoparticles and can be used and recommended for accurate calculation of the particle and aggregates size as well as their distribution in the reactor.
Introduction
Calcium carbonate (CaCO3) is one of the most widely used fillers in many industrial applications such as plastics, rubber, papermaking and medicine. Furthermore, the nanocrystalline CaCO3 has much more advantages in comparison to the commonly used normal size CaCO3 and due to that it has attracted wide research interests. 1 Therefore, finding ‘smart’, cheap and energy-saving method, which allows to obtain nanocrystalline CaCO3 is in great demand in industry. However, despite a number of investigations described in literature 2 –18 the molecular level of CaCO3 precipitation as well as the aggregation and formation processes 2 –7,9 –14 are still unclear and have not been fully understood. In general, there are two mechanisms of crystal growth described in the literature. 2,15 Ostwald ripening involves the formation of larger crystals from smaller crystals that have higher solubility than larger ones (the smaller crystals act as fuel for the growth of the bigger crystals). Another mechanism revealed in recent years is called “nonclassical crystallization by aggregation.” It incorporates coalescence of initially stabilized nanocrystals that grow together and form one bigger particle. 15,19
The main objective of this work is to find a way of monodispersed, nanometric CaCO3 crystals production with strictly defined size of single particle in the rotating disc reactor (RDR). 20,21 From our previous study 20,21 we know that the nanostructured CaCO3 powder obtained in the reactor is pure, thermodynamically stable and has very developed specific surface area. 20 Now we want to check whether the nucleation and crystal growth processes can be controlled by mixing conditions in the reactor and initial calcium hydroxide (Ca(OH)2) suspension content.
To explain the way of nucleation and growth of nanoparticles in the reactor we extend our previous precipitation reaction models 21,22 and applied them for simulation of crystals formation during the reaction of precipitation in RDR. The model has taken into account the kinetics of the multiphase reaction, crystal growth rate and nanoparticles agglomeration. Data obtained during the precipitation process concerning the size of obtained nanometric crystals have been compared with the model simulation results.
Experimental
Materials and solutions
Carbon dioxide used in experiments was taken directly from a gas bottle (99.9993% pure, from Linde) and Ca(OH)2 from a pure sample (POCH Gliwice, Poland). Chemicals were used without any further purifications.
All samples were prepared using doubly distilled and deionized water. Two different initial concentrations of Ca(OH)2 were used for the experiments: 23 mM and 54 mM. The slurries were prepared by dispersing consequently 1.7 g or 4.0 g of Ca(OH)2 powder into deionized water in a 100 ml of volumetric flask. Next day slurry was treated by ultrasonic bath for 10 min, then the solution was cooled down to 25°C, diluted to 1 l or 2 l and immediately used for experiments.
Precipitation procedures
In the present experiments the carbonation process was carried out in multiphase system using the RDR, 20,21 as shown in Figures 1 to 3. The one reactor chamber that was used in the experiments has a maximum volume of liquid reactant equal to 2 l. Before each experiment the reactor elements were cleaned with 10% hydrochloric acid solution to get rid of any CaCO3 particles and then rinsed with deionized water. All processes were performed under atmospheric pressure and the constant temperature of the solution equal to 25°C. Gas inflow to the reactor was equal to 2 l min−1 and was maintained at a constant level by Mass Flow Controller GFC (Aalborg) calibrated on CO2.
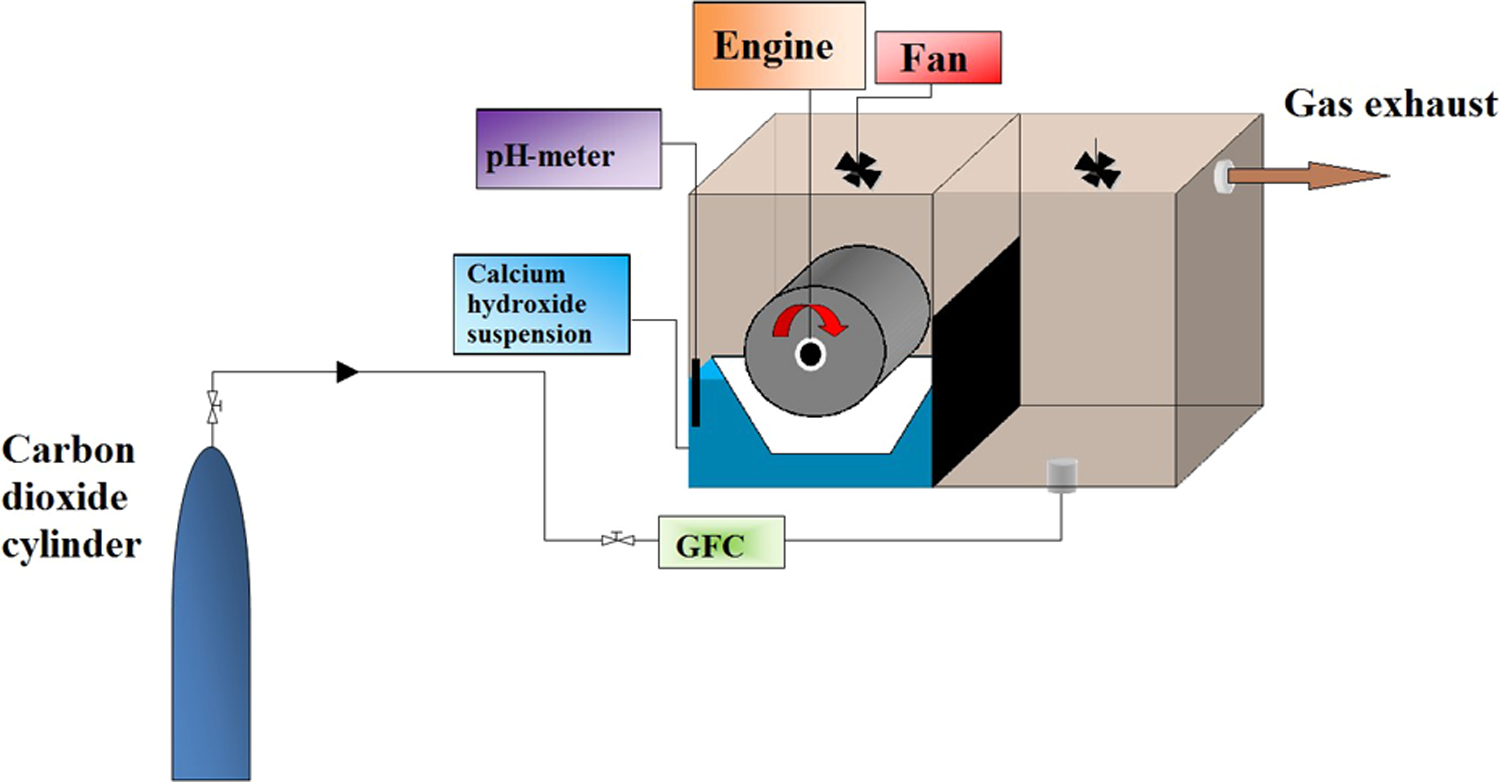
The scheme of experimental set.
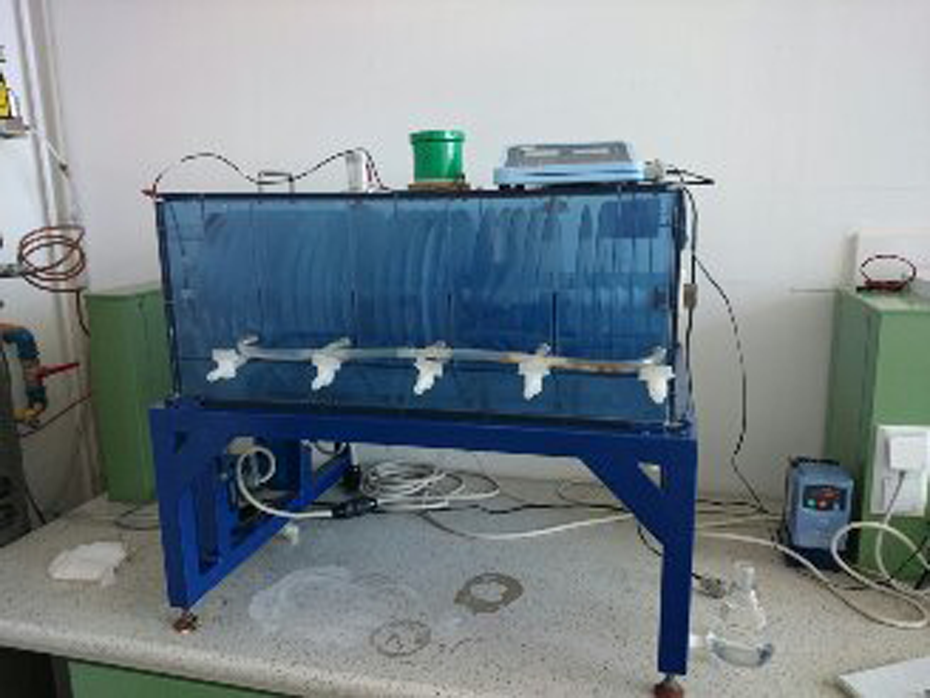
The RDR. RDR: rotating disc reactor.
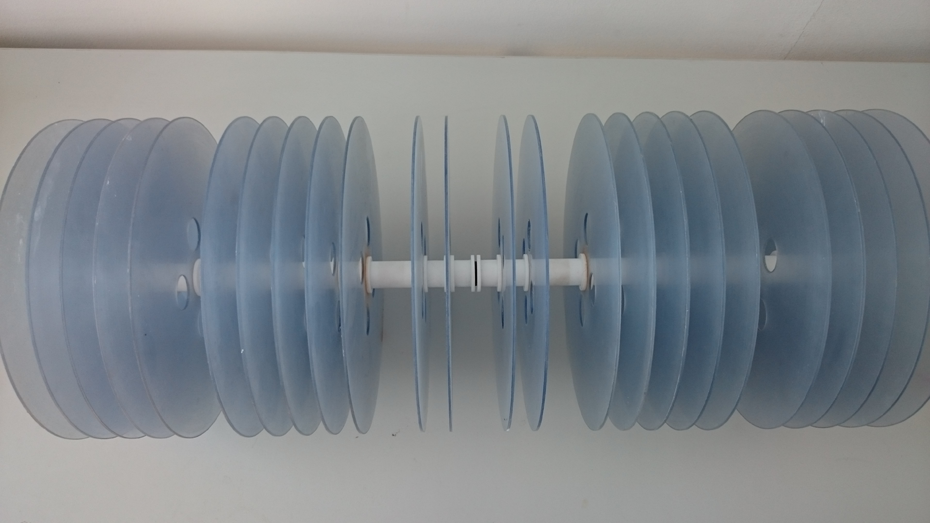
The axle with discs.
The reaction kinetics was controlled by discs’ revolution speed rate equal to 120 r min−1. The carbonation process was stopped when whole solution was neutralized (pH = 7). Then, precipitated solids were collected by filtering through membrane filter (0.1 µm), dried in 80°C for 24 h and stored in a desiccator. The liquid phase volume in the reactor was equal to 1 l or 2 l, so interface area was equal to 0.142 m2/l or 0.12 m2/l, respectively.
Characterization techniques
The pH changes during reaction were measured by the use of combined glass electrode (IJ-44 for sewage and ultra-pure water, IONODE, Australia). The pH meter was coupled with PC and the experimental data were collected every second for carbonation time adjustment. Electrode was calibrated before every experiment on three buffer solutions (from CHEMPUR, Poland; pH at 25°C was equal to 7.0, 9.0 and 12.0).
X-ray diffraction (XRD) patterns were collected on Bruker AXS D8 Advance powder diffractometer (Bruker, USA) with copper Kα radiation. The 2θ (range from 20° to 100°) with step 0.1° and time step 1 s were selected to analyse the crystals structure.
For crystals’ morphology, size and aggregation examination the scanning electron microscope (SEM) photographs of the probes were taken with SEM (Hitachi S 5500 SEM/STEM (Hitachi, Japan) with cold field emission gun). The size of obtained single crystals has been calculated based on the SEM photographs by the use of ImageJ Programme.
Results
Crystallites structure
The XRD testing shows that independently of the initial concentration of Ca(OH)2 the polymorphic modification of obtained CaCO3 powder is very pure and single calcite. The experimental reflexes suit very well to the standard calcite data (the green bars on the diagram in Figure 4).
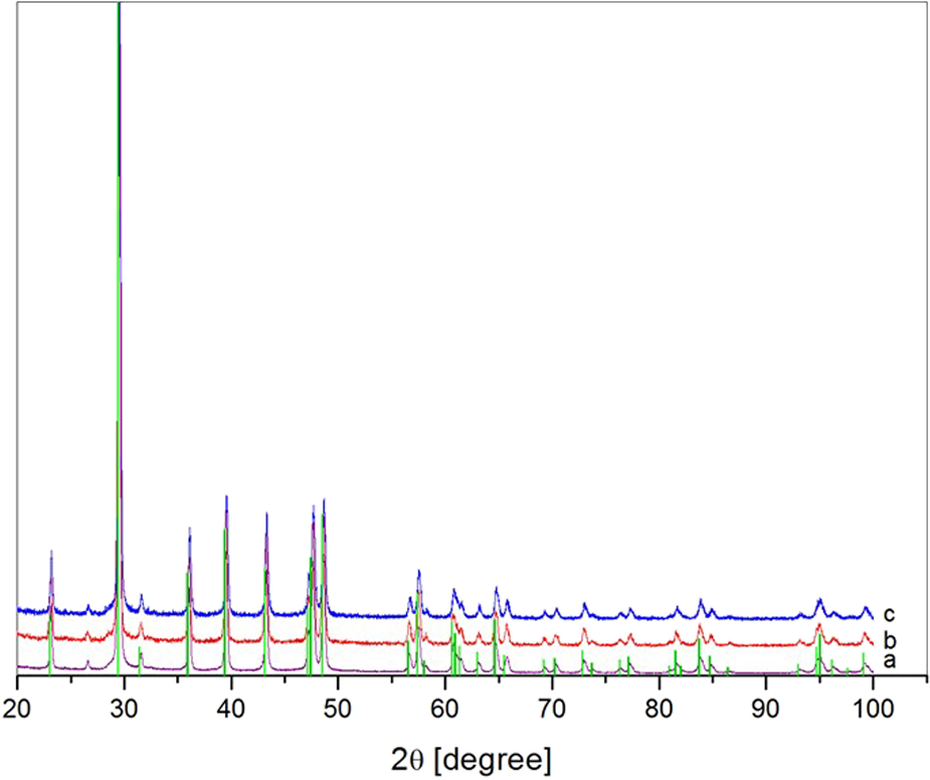
The XRD patterns of CaCO3 samples precipitated in RDR for which interface area was equal to 0.142 m2/l and initial Ca(OH)2 concentration equal to (a) 23 mM l−1, (b) 54 mM l−1 and for which interface area was equal to 0.12 m2/l and initial Ca(OH)2 concentration equal to (c) 23 mM l−1 together with standard calcite data. XRD: X-ray diffraction; CaCO3: calcium carbonate; RDR: rotating disc reactor; Ca(OH)2: calcium hydroxide.
In the investigated system only the most thermodynamically stable structure is formed. Although in many cases the precipitate is a mixture of two or three CaCO3 polymorphs, 23,24 the obtained polymorphic form of CaCO3 fully agrees with our previous results. 20,21
Figures 5 to 8 show the SEM micrographs of powders taken several minutes after the end of precipitation reaction, obtained for different mixing conditions (different interface area) and initial Ca(OH)2 concentrations (Table 1).
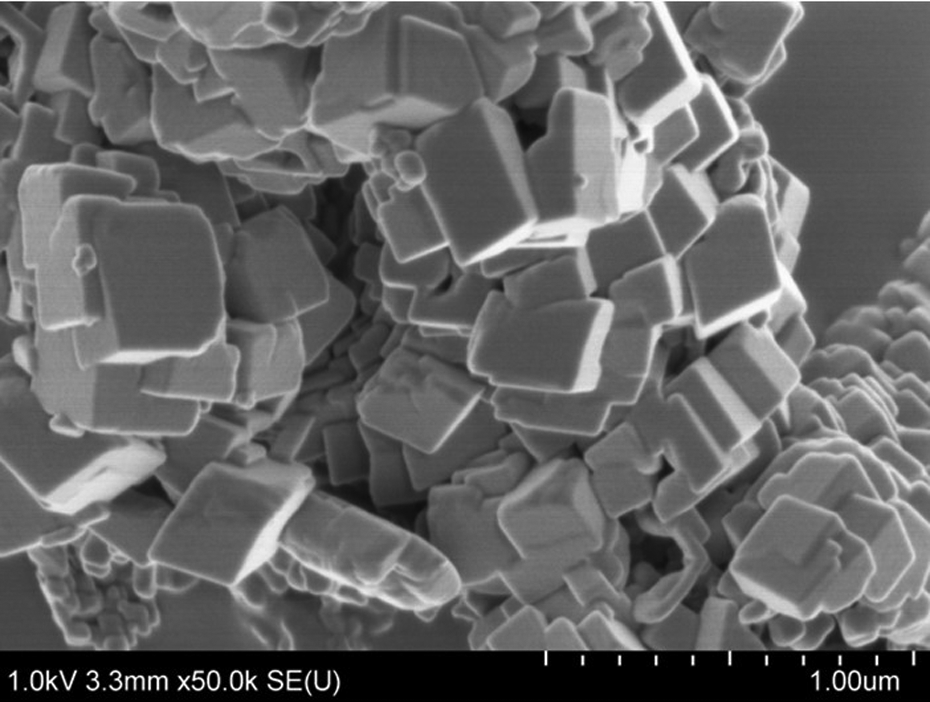
The SEM micrographs of powders obtained in the RDR for the interface area equal to 0.142 m2/l and the initial Ca(OH)2 concentration equal to 23 mM l−1. SEM: scanning electron microscope; Ca(OH)2: calcium hydroxide; RDR: rotating disc reactor.
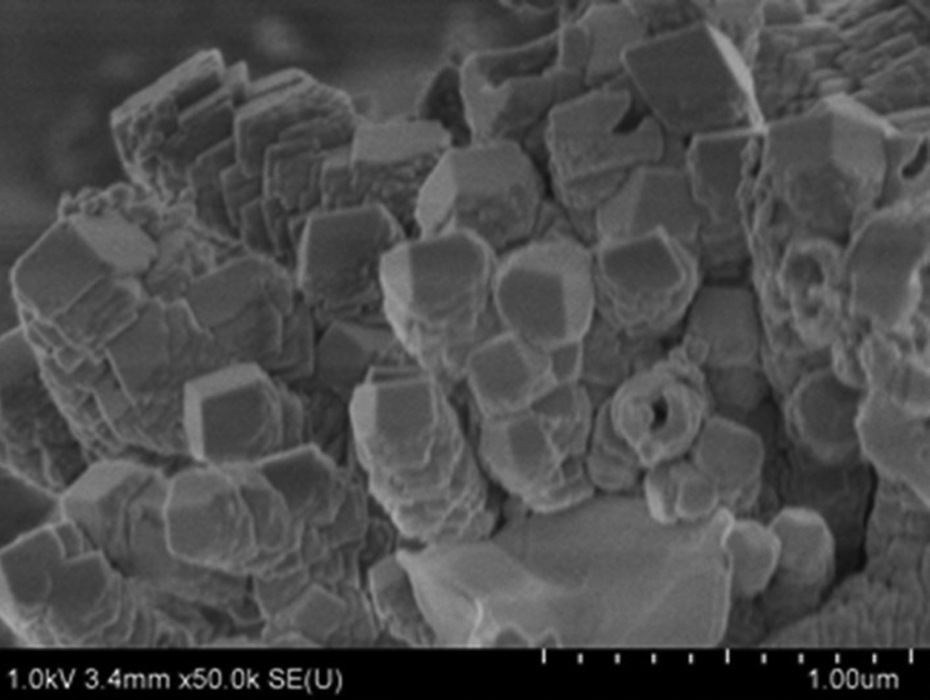
The SEM micrographs of powders obtained in the RDR for the interface area equal to 0.142 m2/l and the initial Ca(OH)2 concentration equal to 54 mM l−1. SEM: scanning electron microscope; Ca(OH)2: calcium hydroxide; RDR: rotating disc reactor.

The SEM micrographs of powders obtained in the RDR for the interface area equal to 0.12 m2/l and the initial Ca(OH)2 concentration equal to 23 mM l−1. SEM: scanning electron microscope; Ca(OH)2: calcium hydroxide; RDR: rotating disc reactor.

The SEM micrographs of powders obtained in the RDR for the interface area equal to 0.12 m2/l and the initial Ca(OH)2 concentration equal to 54 mM l−1. SEM: scanning electron microscope; Ca(OH)2: calcium hydroxide; RDR: rotating disc reactor.
The Ca(OH)2 initial concentrations and process conditions.

Ca(OH)2: calcium hydroxide.
CaCO3 crystals form aggregates of crystallites, which differ in size and shape. The average size of single crystals, monodispersed for the particular process conditions (Figures 5 to 8), strongly depends both on the initial Ca(OH)2 concentrations and different interface areas. Particles from the lower initial Ca(OH)2 concentrations (Figures 5 and 6) are characterized by almost perfect rhombohedral morphology. When the concentration increases (Figures 7 and 8), the edges and corners start to be rounded up and all particles are much smaller than previously.
However, independently of both initial Ca(OH)2 concentrations and different interface areas in all case the monodispersed crystals have been obtained. The average size of the monodispersed crystals has been calculated based on the SEM photographs by the use of ImageJ Programme for different process conditions. The obtained results are summarized in Table 2.
The particle size distributions and diameters of obtained nanoparticles for each sample (blue colour – incidence, red colour – total amount (%)).

Because of large excess of Ca(OH)2, the mechanism of heterogeneous nucleation on the surface of undiluted particles proceeds. Its structural orientation is stable and is not changed until the end of the reaction.
For given initial volume of the suspension the higher the initial concentration of slurry, the smaller obtained crystals. The particles obtained from 1 l solution of 1.7 gl−1 concentration are much bigger than those from the same volume slurry, but of 4.0 gl−1 concentration (Table 2), but in both cases the nanocrystals are monodispersed. For twofold volume the situation is identical and the particle size distribution remains monomodal (Table 2). What is more, for both concentrations the particle sizes are getting smaller with the increase of volume.
Simulation
We assumed that the reaction goes in the thin liquid film formed on the surface of the rotating disc, 21 which creates a constant surface area of gas–liquid interface and the carbonation reaction of lime water involves gas, liquid and solid phase. So, the process can be described by the four following reactions:


For the calculation of the mass balance of these reactions, we applied the film theory 25,26


where
t – time (s),
c
CO2, c
OH, c
CaCO3 – the concentrations of gas reactant [CO2], liquid reactant [OH−] and the product
G′, B′ – rate of crystal growth and nucleation (kg/(m3 *s)), respectively;
k – second-order chemical reaction constant (m3/(kg *s)),
D
CO2
, D
OH
, D
CaCO3 – diffusivity of (CO2(g)), (OH−) and (
The population balance of the precipitated particles (CaCO3) was described under assumption that the concentration of

where
N – population density of particles m(−1) m(−3),
G – linear growth rate (m/s),
L – coordinate of particle dimension (m),
DP
– diffusivity of particles (m2/s).
After substituting
we get that

where
P(x, L) – number of density (m(−3)) discretized in L – particle size coordinate (m),
L0 – effective nucleic size, for newly nucleated particles.
Solving the mass balance equations and population equation with the proper boundary conditions 21 we could calculate the discretized density number of particles (P(t, x, L)) and discretized diameter L.
To perform simulation calculations we need some expressions concerning diffusivity of particles, rate of nucleation and crystal growth as well as boundary conditions. For the above variables in the extended model we assume the same expressions as in the previous one. 21
The diffusivity of the crystals within the liquid film was described by the Stokes–Einstein equation: 28

where
kB
– the Boltzmann constant, kB
= 1.38 10−23 kg m2 s−2 K−1,
T – temperature (K),
μ – viscosity (Pa*s),
r – radius of particle (m).
The number rate of nucleation (Jn ) and linear crystal growth (G) was expressed by the Nielsen equations 29 :


where:
n, g – the orders of nucleation and growth, respectively (-);
C, C* – the concentration and equilibrium saturation concentration, respectively (kg/m3),
kn, kg
– nucleation (m6/(kg*s)) and growth rate (m4/(kg*s)) constants, respectively.
The equations can be expressed by the following forms:


It is necessary to take into account that because of a large excess of Ca(OH)2 we will deal with formation of larger crystals ‘by aggregation’ (coalescence of initially stabilized nanocrystals that grow together and form one bigger particle)15,19 in the reactor. That is why we have to introduce a new parameter λ which defines the number of new nuclei growing together and form one bigger crystal. Therefore, this parameter has to be a small whole number. The λ parameter will be dependent on the film thickness (δF) and Ca(OH)2 initial concentration. According to the fact that the bigger thickness, the lower number of new nuclei growing together 19 the change of λ should be inversely proportional to the interface area (δA) and proportional to the change of Ca(OH)2 initial concentration. So, its change from λ1 to λ2 caused by the change of the interface area from δA 1 to δA2 and the change of Ca(OH)2 initial concentration from c OH1 to c OH2 can be expressed by the following equation

Thus, the rate of liner crystal will have the following form

The corresponding mass-based rate equations of nucleation and growth are respectively:


where:
L
0 – effective nucleic size, for newly nucleated particles (m),
α, β – volumetric and surface factor (−),
ρ – crystal density (kg/m3).
The boundary conditions for the gas–liquid interface, assuming that except for the gaseous reactant (CO2(g)), every component is non-volatile, are as follows:

and for the film formed on the disk surface (δF – film thickness), assuming that newly nucleated particles have an effective nucleic size equal to L0, as follows:


Simulation of the aggregation of CaCO3 nanoparticles obtained in the RDR, according to the above model, has been performed under the following assumptions: the concentration of Ca(OH)2 in the aqueous solution is defined by its solubility in water and kept at constant level until the excess of solid Ca(OH)2 is not exhausted. Then, the dissolved Ca(OH)2 level decays exponentially; the gaseous CO2 concentration is kept at constant level and its concentration in water is defined by its solubility in water; the dissolved form of CaCO3 precipitates according to kinetic laws described in the model when its concentration exceeds the saturation level; the increase of obtained crystal mass is proportional to the entire area of the nucleus; the time interval for calculation of the nucleus formation, crystal growing and aggregation was equal to the time of CO2 disappearing; the change of the disc rotation is simulated by the change of entire process time.
The nucleus formation is much faster than growth of the crystals. To account this, two following loops have been created in the simulation program: the outer loop which updates the size of precipitated grains and the inner loop which updates the grain number of density.
All the physico-chemical parameters needed for the calculations are given in Table 3. The nuclei effective size L 0 was taken as equal to 32 nm – according to our previous simulations 21 (values of L 0 according to S Wachi and AG Jones estimation 25 vary from 10−8 m to 5 × 10⁻⁸ m).
Parameters values used for the simulation.

CO2: carbon dioxide; CaCO3: calcium carbonate.
We have performed simulations changing concentration of Ca(OH)2 (23 mM l−1 and 54 mM l−1) and the interface area (0.142 m2/l and 0.12 m2/l) for constant disc rotation rate equal to 120 r min−1.
Obtained simulation results clearly show that independently of the process parameters and initial Ca(OH)2 concentration crystals size changed only slightly during the process time which led to the formation of monomodal (similar average size) crystals at the end of the process. However, the size of the crystals was strongly dependent on the initial Ca(OH)2 concentration, the interface area and parameter λ. The results of simulation obtained for parameter λ equal to 3 are given in Table 4.
The results of simulation obtained for parameter λ = 3.

Ca(OH)2: calcium hydroxide.
Simulation results (Table 4) have been compared with the experimental values (Table 2, Figures 5 to 8). In all cases the obtained crystals were monomodal. For three investigated suspensions (Table 1 – numbers: 2–4) the simulation results (Table 4) are similar to those obtained experimentally (Table 2, Figures 6 to 8), the worse agreement (discrepancy about 20%) has been obtained for the highest interface area (0.142 m2/l) and lowest Ca(OH)2 initial concentrations (1.7 gl−1). It can be explained by the fact that in these case we could deal with non-homogenous mixing which affected the reaction kinetics, causing formation of crystals with different size than simulated.
Summarizing the results of crystallization process conducting in the RDR we can state that proposed (extended) model is internally consistent (proper work of the λ parameter) and very well describes formation of calcite particles as long as the equilibrium condition is reached. Therefore, the model can be used and recommended for accurate calculation of the particle size as well as their distribution obtained by gas–liquid precipitation in the reactor.
Conclusions
Obtained results show that in the used reactor the carbonation of dispersed Ca(OH)2 in water with coexistence of gaseous CO2 under ambient condition leads to the precipitation of nanometric, monodispersed crystals in the range of 90–320 nm. The size of the crystals strongly depends both on the precipitation condition and initial concentration of the slurry.
The obtained results allow for the general conclusion concerning formation of nanoparticles in the reactor with rotating discs depending on process conditions. At low interface area the high supersaturation degree occurs in the liquid film on discs surface and small crystallites can be formed. When discs rotate with high interface area the supersaturation degree is not always achieved, which results in a little bigger crystallites.
The new extended model for description of crystallization process conducting in the RDR has been proposed. The internally consistent model very well describes formation of the calcite nanoparticles and can be used and recommended for accurate calculation of the particles size as well as their distribution in the reactor.
The obtained results suggest that the carbonation of Ca(OH)2 in the presence of gaseous CO2 under ambient condition could be a powerful technique for producing fine submicrometric particles of calcite on an industrial scale.
Footnotes
Declaration of conflicting interests
The author(s) declared no potential conflicts of interest with respect to the research, authorship, and/or publication of this article.
Funding
The author(s) received no financial support for the research, authorship, and/or publication of this article.