
Abstract
In this article, a model-based genetic algorithm is used to determine the optical properties of nanostructured zinc oxide single-sided nano thin films that does not depend on the interference fringes of optical transmission spectrum. The functional form for refractive index n(λ) and absorption coefficient α(λ) as functions of wavelength instead of randomly organized genes corresponding to the optical parameters are used in the implementation of GA. Using the proposed model for the refractive index dispersion and absorption, the transmittance curves of zinc oxide thin films obtained from optimized parameters are fitted with the original spectrum. The calculated results give us R2 values higher than 0.950. Compared to traditional optimization methods, the fitting error of genetic algorithm is typically smaller. The interference fringes are not critical to perform the genetic algorithm in comparison to the classical methods such as the envelope method. One of the advantages for this technique is its considerable speed and there is no need for successive parabolic interpolation and extra calculations. This technique allows the use of available data corresponding to the optical responses such as transmission or reflection of single layered or multilayered structures simply by changing the cost function.
Keywords
Introduction
In the semiconductor device applications, it needs to the quicker and more accurate optical characterization. Some studies on the iterative techniques respond to these needs. The transmittance (T) and reflectance (R) of monochromatic plane waves for monolayer structure can be used for determination of optical constants of thin films. 1 –12 Considering the thin film structure, the optical T spectrum (T(λ)) can be analyzed in two categories. For the first category, the T(λ) is an oscillating function of wavelength (λ) in the visible (Vis) and near infrared regions (NIRs) for suitable product of refractive index n and thickness t. In this case, the direct methods which are assumption-free methods such as Swanepoel’s envelope method can be used for the determination of optical constants of thin films. 4,5 For this method, the envelopes of maxima of the transmission spectrum TM and the minima of the transmission spectrum Tm (influenced by interference effect) are assumed to be a continuous function of λ. The envelope curves can be obtained from a parabolic fit considering the adjacent extremum points. It should be noted that the determination of envelope curves obtained from parabolic fit often requires great elaboration 13 and small inhomogeneity on the film surface, which do not reflect the actual behavior of the thin film. Hence, all the optical constants can be determined using real and computed extremum transmission values via corresponding extremum wavelengths (λ ext). And also, the envelope curves can be considered as nonlinear function of refractive index (n) and extinction coefficient (k = αλ/4π) because the maximum and minimum transmission (or reflection) values correspond to the same λ. The problem becomes finding the roots of two nonlinear equations with two unknowns such as n and absorption coefficient α (x = exp(−αd)) as a function of λ ext. Roots can be find using classical method such as Newton–Raphson method 14 or alternative methods such as genetic algorithm (GA) method. The GA and envelope methods were applied together on the envelope of the transmission spectrum, 15 envelope of the reflection spectrum, 16 and the combination of maximum envelope of the reflection spectrum and minimum envelope of the transmission spectrum. 17 For these calculation, GA was used instead of imposing a functional form for n(λ) and x(λ), randomly organized genes corresponding to the optical parameters.
For the second category, the optical responses are non-oscillating functions of λ or the number of interference fringes or depth of these fringes are not sufficient to use the envelope method. In this case, the optical responses are modeled with some optical constants and parameters. The determination of these parameters, in accordance with model, is an optimization problem. In order to solve the problem, many traditional optimization techniques, including simplex, gradient, and damped least-squares method, pointwise unconstrained minimization algorithm (PUMA), and GA have been used in this field. The main step for these methods is the search for such a set of parameters, which minimizes the difference between the experimental and calculated optical response. But nonlinearity of the transmissivity (or reflectivity) equations leads to multiple solution for unconstrained optimization method, causing the optimization algorithm to fall into local minima. To overcome that problem, the model’s coefficients have to be constrained to intervals depending on the nature of the thin film that respect their physical meanings. Jurecka et al. 18 used experimental R for the zinc oxide (ZnO) thin film modeled by Forouhi–Bloomer equation with three unknowns such as refractive index, absorption coefficient, and film thickness. Finally, the optical parameters can be computed using this model-based GA.
In this study, we used GA to simulate the experimental transmission spectrum using functional form of refractive index, absorption, and thickness. The refractive index dispersion was modeled by two parameters and the absorption was modeled by three parameters. In addition, the film thickness was considered as the sixth parameter. Then, the problem become finding the possible values of these parameters that minimize the difference between optical transmission spectrum and computed transmission spectrum. This minimization procedure was implemented as the computer program written in MATLAB [The Mathworks Inc. R2016a] using GA. For a better understanding of GAs, detailed information is given in later section. The optical constants and film thickness evaluated by GA for five samples were reported. The first sample (RS1) was computer made a-Si: H sample. 4 The second was another reference sample (RS2) whose optical constants were determined by the multiparameters curve fitting method. 19 The behavior of the optical transmission spectrum changed with the thin film thickness that was effect of the number of interference fringes and depth of these fringes. In order to see the thickness effect on the transmission spectrum, the other three ZnO thin films (S3, S4, and S5) having different thicknesses were prepared using the ultrasonic spray pyrolysis (USP) system. The optical transmission spectra of these films were used for test of model-based GA technique. This technique was successful in retrieving optical constants from optical transmission spectra of computer made and real-world films in any cases such as the film with or without the interference fringes.
Materials and method
Experimental details
ZnO thin films were deposited onto ultrasonically cleaned microscope glass substrates using the USP system whose details were given in previous study. 20 Substrate temperature was kept constant at 400°C. The precursor solution used was 0.1 M zinc acetate (Zn(CH3COO)2.2H2O, 99.9%; Merck, Kenilworth, New Jersey, USA) diluted in methanol and deionized water. The nozzle, 100 kHz oscillator frequency, was at a distance of 12 cm from the substrate during deposition. Nozzle used in this study was in a downward vertical configuration. Compressed air was used as the carrier gas. While the precursor solution flow rate was changing, deposition time was kept constant as 10 min. The deposited ZnO films were labeled as S3, S4, and S5. The optical T measurements of the ZnO thin films were carried out at room temperature using a PG Instruments T70 (UV/Vis/NIR spectrophotometer; UK) in the range of 300–900 (or 1100) nm and optical T was normalized.
The optical T theory for thin films
The optical behavior of a thin film is characterized by the reflectivity, transmission, and absorption spectra. We focused on the optical T measurement that is much easier than the optical R measurements. The practical situation for a single-sided thin film on a finite transparent substrate is shown in Figure 1. The index of refraction of the surrounding air n 0 = 1. The film has thickness t and refractive index n, and k is the extinction coefficient which can be expressed in terms of the absorption coefficient α using the equation k = αλ/4π. The transparent substrate has a thickness several orders of magnitude larger than t and has index of refraction ns . For the homogeneous thin film, the exact expression for the T can be found in the references. 4,21 In the case of week absorption, the λ-dependent T T(λ) can be in the form of oscillating functions of the λ in the ultraviolet–visible (UV-Vis) λ region and empirical expression is as follows 4,19,21 :

Reflection and transmission of incident light from an absorbing thin homogeneous film on one side of thick transparent substrate system.
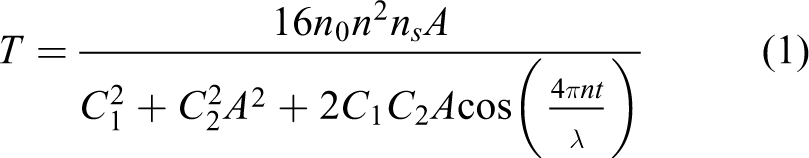
where,


Using the normal dispersion theory for an isotropic film, refractive index can be presented by three constants x, a, and b in the region of k 2 << n2 using the following equation:

When x is taken as “2”, mathematical expression for the dispersion n(λ) is called as Cauchy’s equation. Depending on the deposited materials especially metal oxide, the refractive index dispersion equation can also be taken as the following equation 22 :

The analytical expressions for the optical absorption α is an exponential law:

Curve fitting using modified GA
In the implementation of model-based GA, we have defined each chromosome or individual with an array of six genes, which represent unknown constants a, b, t, d, e, and f of transmission spectrum T(λ). a and b are the constants of Cauchy’s equation of refractive index n(λ) given in equation (5), while t is the thickness of the thin film. d, e, and f shown in equation (7) are the constants of the absorption.
The implemented GA steps with computational details are briefly described as follows. The M individuals and therefore genes are randomly generated at the beginning of the algorithm. The genes are encoded by N bits. The minimum and maximum possible values for each parameter are set to limit the solution space. These limits are determined by the help of a priori knowledge on similar examples in the earlier studies. 16,18 Detailed information can be seen in the studies by Haupt and Oktem and Saka. 23,24 The values of the six unknown parameters are calculated from corresponding genes. For example, for the parameter a, the real value of the mth individual of a is calculated by:

where a min and a max are minimum and maximum limits of real valued parameter a, respectively. a′mn is nth binary number of N bits gene of mth individual.
The following cost or fitness function is calculated using the real valued parameters for each individual:

where T(λ, t, n(λ), α(λ)) and T measurement(λ) are the calculated T coefficient given in equation (1) and measured values, respectively. The calculated cost functions are sorted from the best to the worst. The best genes (correspond to the top half of the list) are kept and the individuals at the bottom half of the list are discarded. The best genes at the top of the list are separately preserved as the obtained solution of the performed iteration. Then, the GA proceeds by iteratively generating new individuals derived from the previous individuals through the application of selection, crossover, and mutation operations. In the algorithm, crossover points are randomly selected. Six percentage of the individuals are mutated with randomly selected “1” bit in the each gene of individuals per iteration to prevent the increase of the number of similar individuals in the population. During the mutation, the individuals to mutate are randomly selected as well. Throughout the calculations, the number of individuals is chosen to be “100”. The each gene is encoded by N = 14 bits in order to obtain a high enough resolution.
Results and discussion
The first step in the computation is determination of range of related parameters that mainly affect on the optical transmission. One of the most important parameters that shape the optical transmission spectrum is the refractive index. The effects of the other parameters on the T can be summarized as follows. When the parameter d is decreased, the inflexion λ 22,25 determined from the second derivative of the transmission curve shifts toward the short λ region and T and depth of the interference fringes increase. However, when the parameter e is decreased, the inflexion λ shift toward the long λ region and T and depth of the interference fringes decrease. When the film thickness t is increased, the number of interference fringes increases and the inflexion λ moves toward to the long λ region. When the f parameter is increased, whole spectrum moves down. This information is very useful to obtain a best fit. Meanwhile, the best fit can be graphical or numerical. Besides graphical fitting, numerical fitting is also important. For the graphical approach, optical transmission spectra and fitted spectra should be overlapped for most of the points. When the graphical results cannot examine fully the quality of the fit, the numerical approach should be considered. In this case, the range of some the optical parameters can be narrowed or fixed. For the numerical approach, the sum of squares due to error (SSE) and adjusted R 2 statistics are useful to assess the best fit. In other words, if the SSE value is closer to zero and the adjusted R 2 value is closer to unity, the best fit will be obtained.
To assess the performance of our algorithm, we first test the algorithm using two sets of synthetically generated optical transmission spectrum. One of the synthetic optical transmission spectrum simulating a-Si: H sample (RS1) is calculated with the parameters of t = 1000 nm; n(λ) = (3 × 10⁻¹³/λ2) + 2.6; α(λ) = 2.511 × 10¹⁵exp(−3.895 × 10⁷ λ) − 4.303 × 10⁴ and the substrate refractive index ns = 1.51. 4 The obtained values from GA algorithm using calculated synthetic data RS1 are given in the first row of Table 1. The film thickness has been perfectly retrieved. In particular, the optical constants such as refractive index and absorption coefficient have been correctly obtained. A perfect fit (R 2 = 0.999) is observed graphically between the generated optical transmission spectrum and calculated optical transmission spectrum using GA is shown in Figure 2. The second synthetic data of transmission spectrum named as RS2 is generated using the values a = 2.364, b = 3.262 × 10⁻¹⁴, t = 2.962 × 10⁻⁷, d = 9.988 × 10⁸, e = 9.721 × 10⁶, and f = 1.000 × 10³ as in the study by Devadason et al.19 The parameters a, b, t, d, e, and f are found using the generated RS2 spectrum by our GA algorithm with R 2 = 0.999 error and the calculated values are also given in the second row of Table 1. Perfect fit was observed between the generated optical transmission spectrum of RS2 and the calculated optical transmission spectrum using GA (Figure 3).
The model-based optical parameters determined with custom equation using GA.
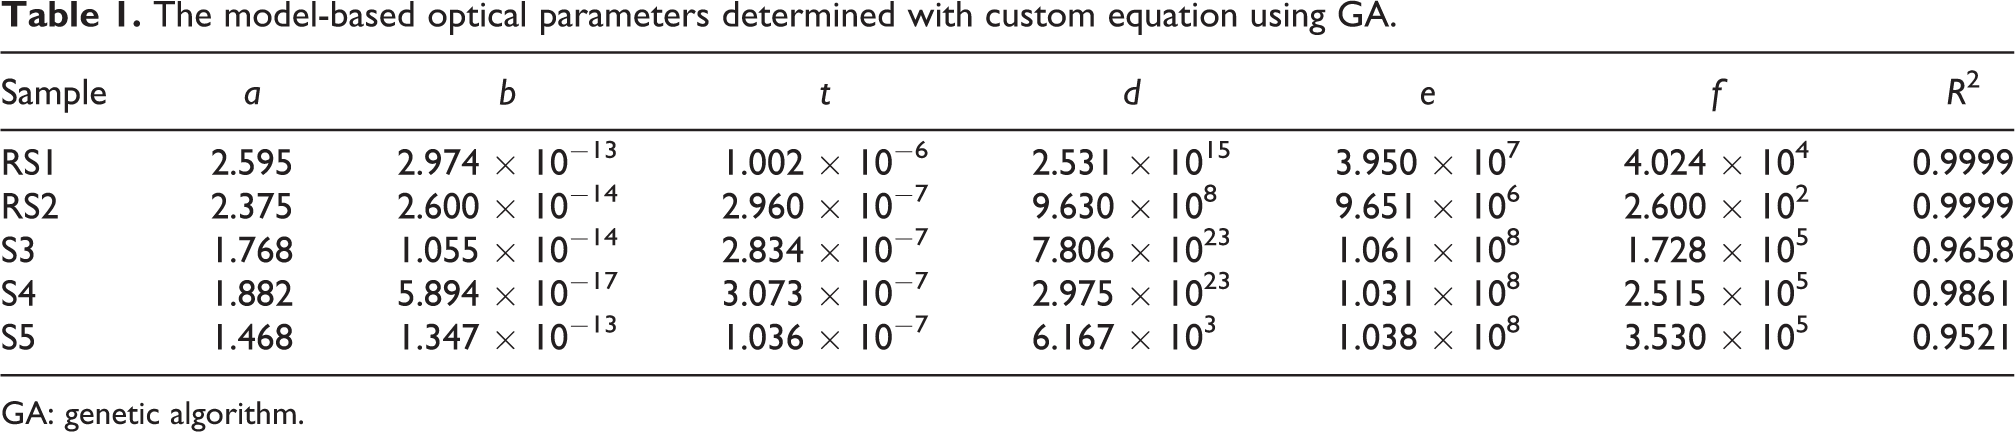
GA: genetic algorithm.

Generated optical transmission spectrum of the model specimen (RS1, t = 100 nm4) with symbol “o” and the calculated optical transmission spectrum using GA with solid line. GA: genetic algorithm.

Generated optical transmission spectrum of reference sample (RS2) with symbol “o” and the calculated optical transmission spectrum using GA with solid line. GA: genetic algorithm.
The film thickness affects the optical T. The number of interference fringes and the depth of these fringes depend on the film thickness. Therefore, the computer code is also used to simulate three samples of ZnO thin films having different thicknesses. When the thin film thickness increases, interference fringes can be seen in the UV-Vis λ region. Transmission curves of ZnO thin films are shown in Figures 4 to 6. A very good agreement between the experimental optical transmission spectra and calculated optical transmission spectra using GA is observed. Calculated parameters of the samples are given in Table 1. For the film made of a given material (ZnO) with different thicknesses, the GA yields correctly the optical constants.
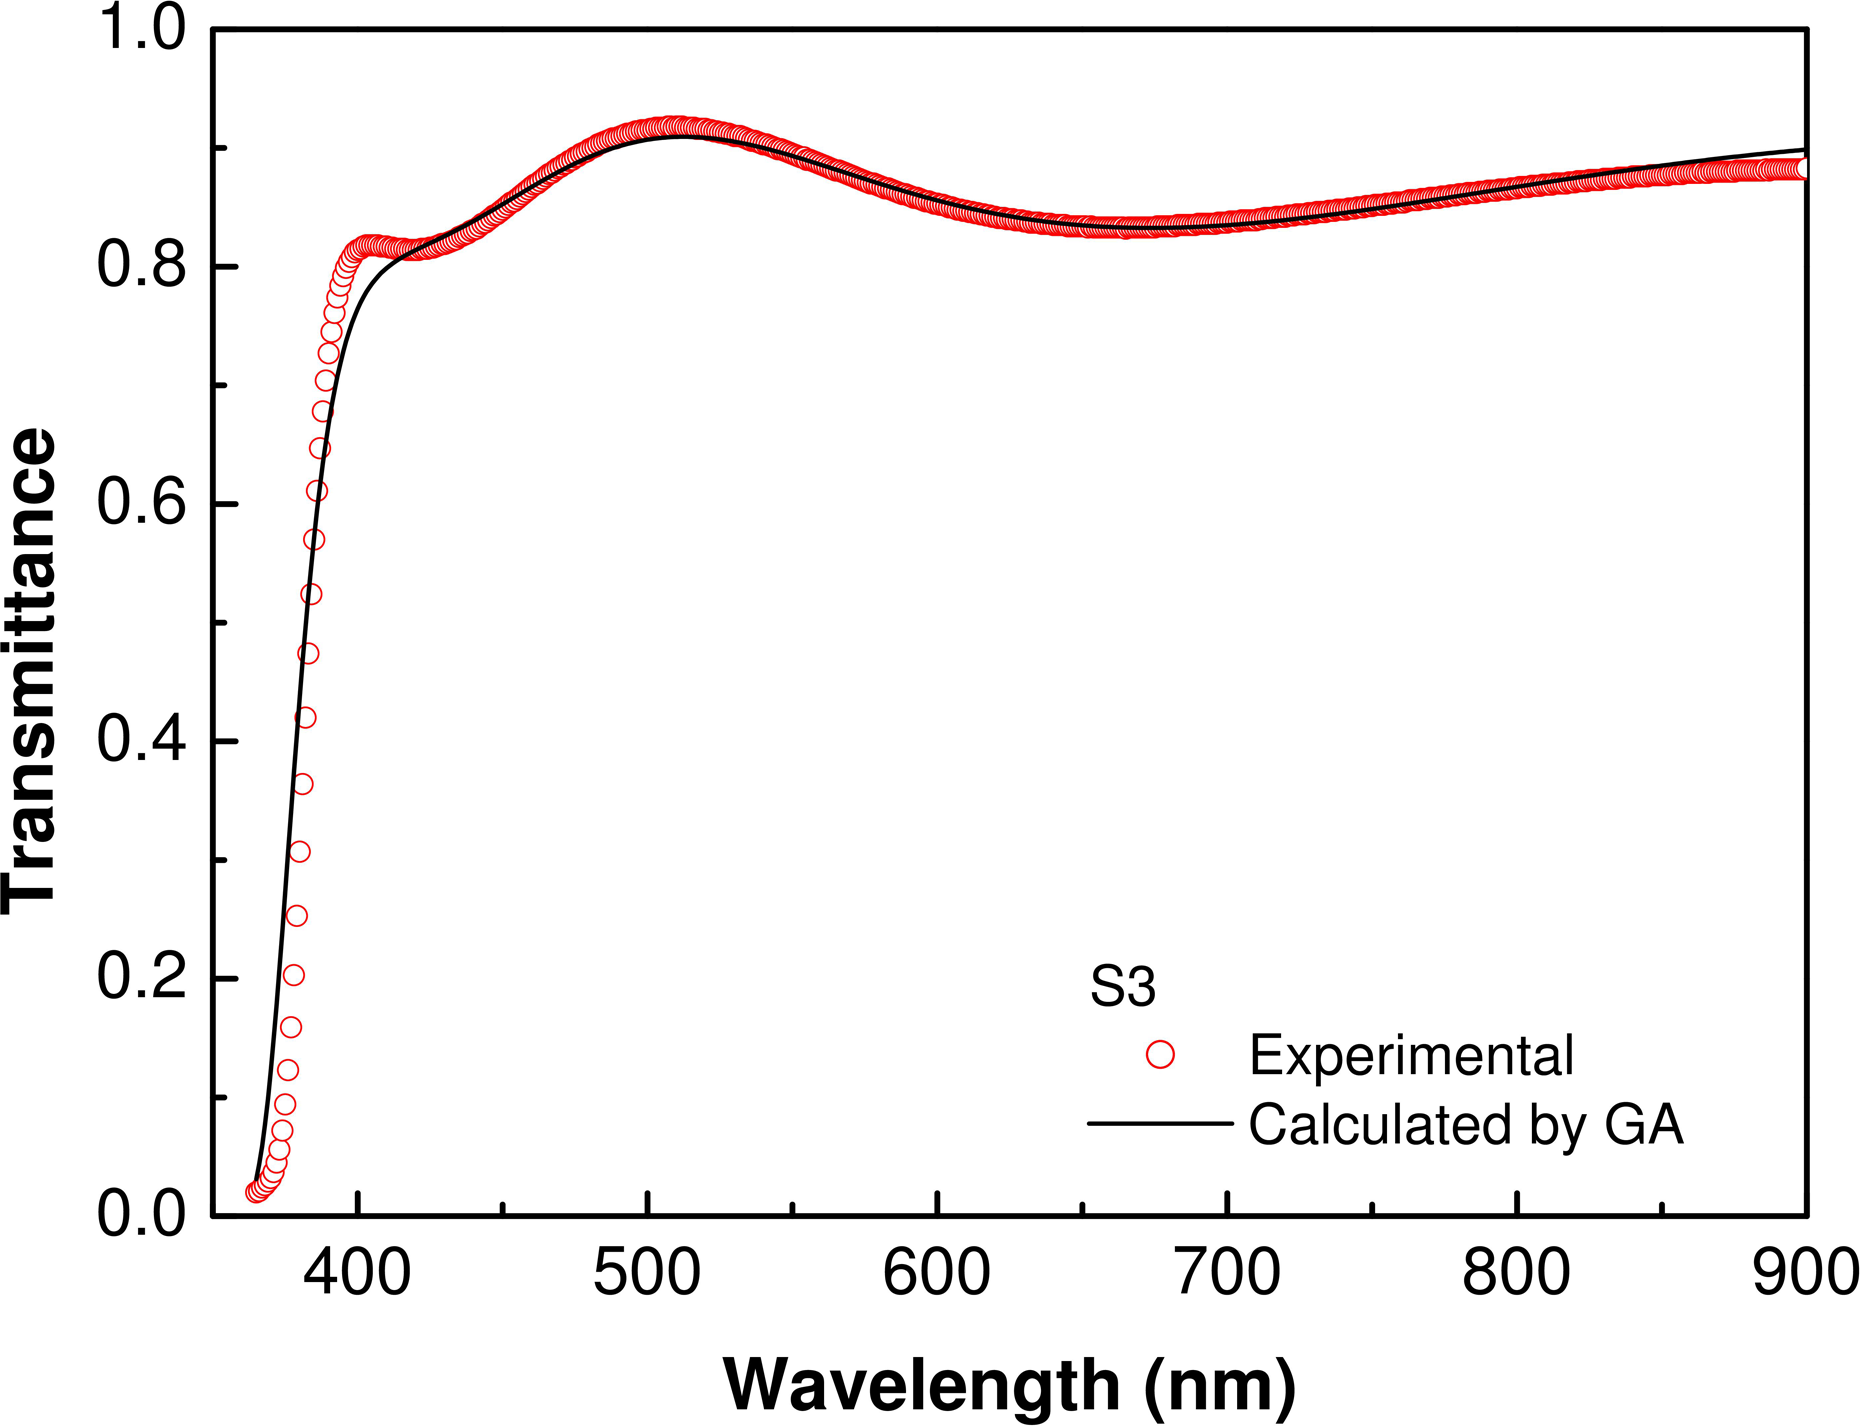
Experimental optical transmission spectrum with symbol “o” and calculated optical transmission spectrum by GA with solid line of ZnO film (S3). GA: genetic algorithm; ZnO: zinc oxide.

Experimental optical transmission spectrum with symbol “o” and calculated optical transmission spectrum by GA with solid line of ZnO film (S4). GA: genetic algorithm; ZnO: zinc oxide.

Experimental optical transmission spectrum with symbol “o” and calculated optical transmission spectrum by GA with solid line of ZnO film (S5). GA: genetic algorithm; ZnO: zinc oxide.
In order to compare the ZnO thin film thickness, optical transmission spectra are also used with the PUMA. 22 The computed film thicknesses are 278, 305, and 104 nm for S3, S4, and S5 samples, respectively. These are in agreement with the results obtained with the GA. The refractive index n as a function of λ, calculated using the model-based parameters and equation (5), is shown in Figure 7. A parabolic behavior for the refractive index as a function of λ was observed for the samples S3, S4, and S5 as expected.
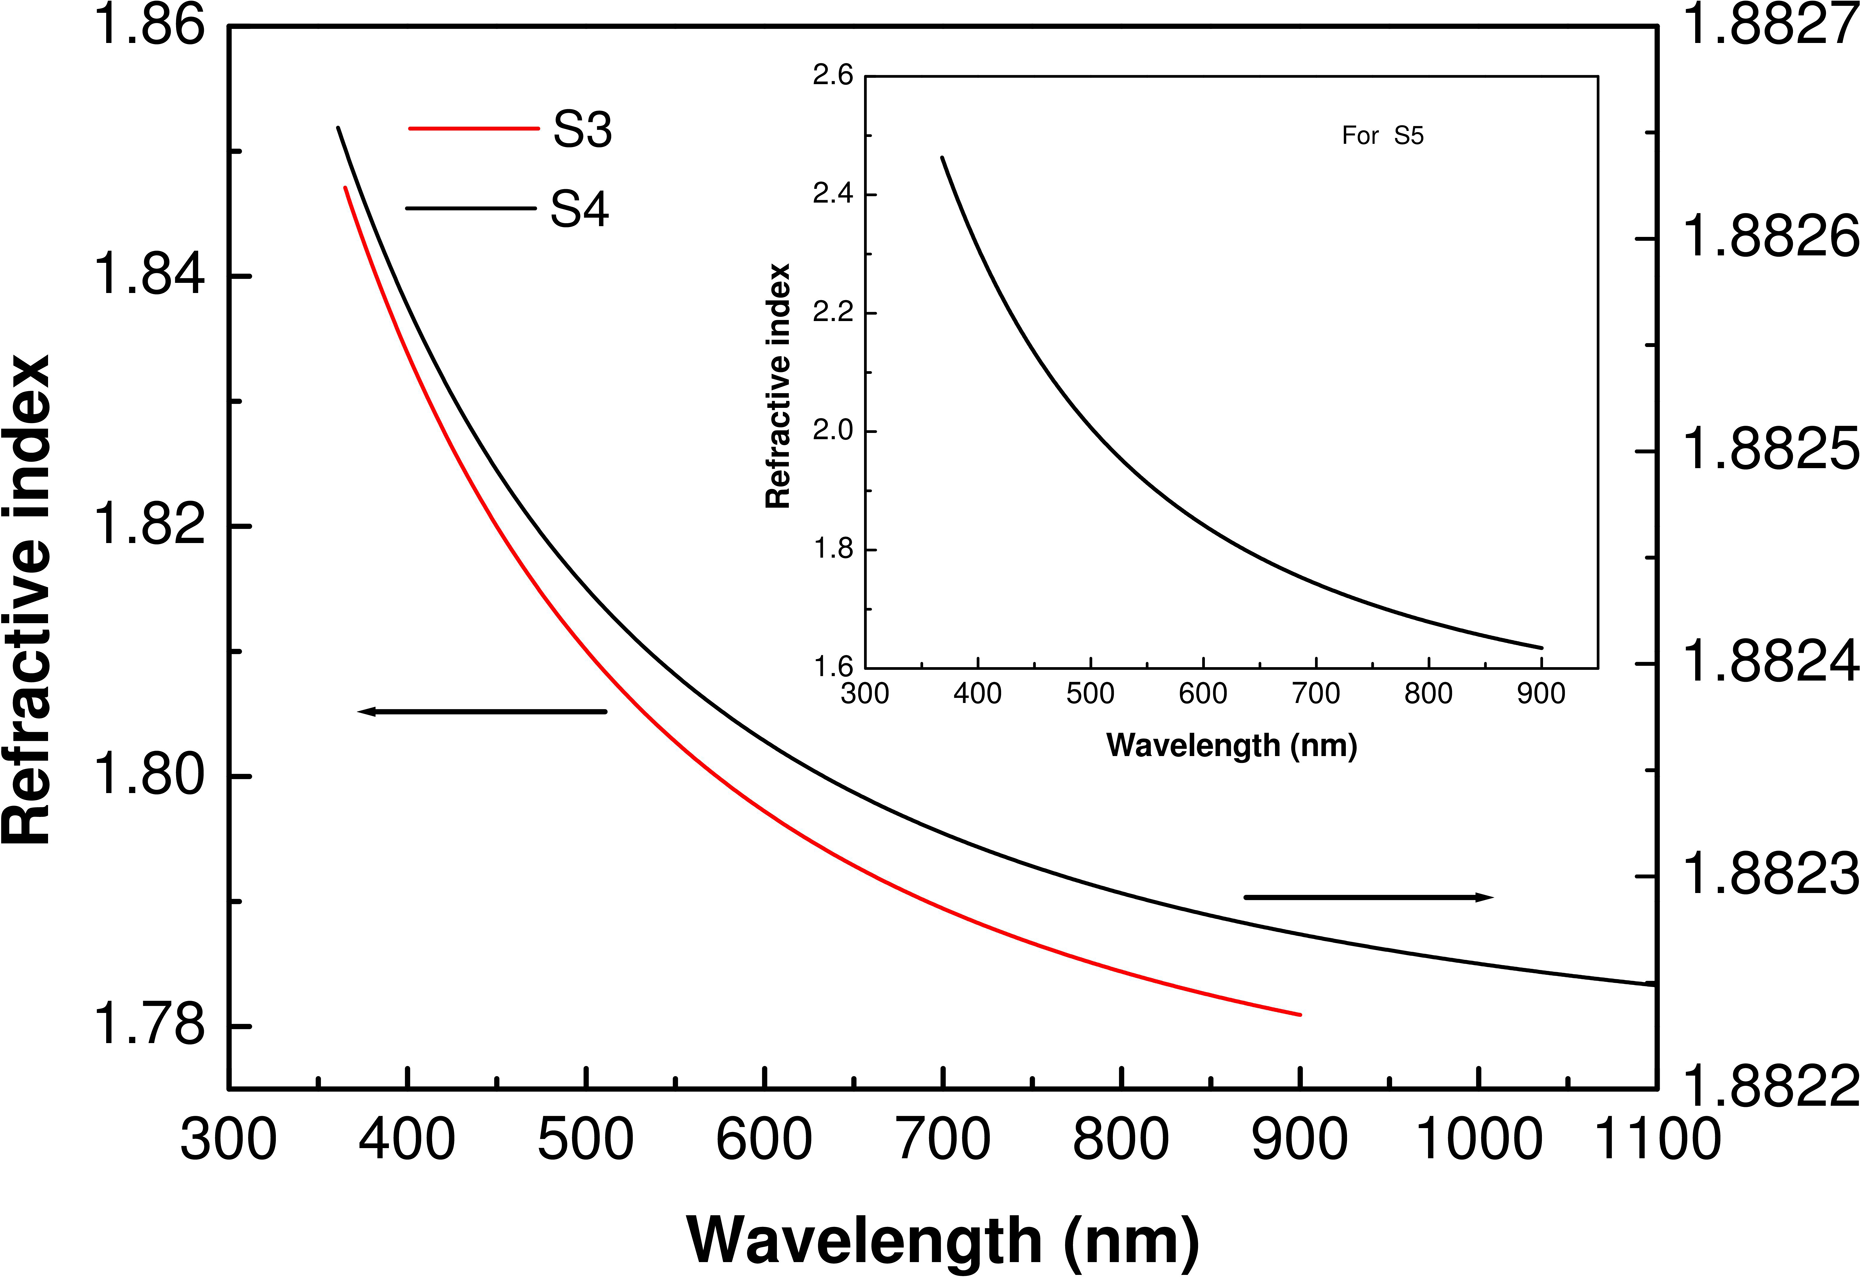
Parabolic model-based refractive index variation of the S3, S4, and S5 samples, and S4 sample is more clearly shown in the inset.
Calculations are performed mainly to provide information on the optical absorption. The variation of absorption coefficient with photon energy is given in Figure 8 for the samples S3, S4, and S5. This information can be used in calculation of dielectric constants such as ∊ 1 and ∊ 2 (∊ 1 = n2 − k2 , ∊ 2 = 2nk and the relation extinction coefficient k and the absorption coefficient α). In addition, optical band gap of thin film can be calculated using the following equation 26 :

Variation of absorption coefficient for ZnO samples. ZnO: zinc oxide.

where A is the probability parameter for the transition, Eg is the band gap of the material, hν is the incident photon energy, and n is the transition coefficient. The value of n is known from measurements to be “2” for an indirect band gap and “1/2” for a direct band gap.
Conclusions
In summary, the optical properties of nanostructured ZnO samples were successfully characterized by the proposed model-based GA technique. The advantages of this technique are that it is fast and does not depend on the interference fringes of optical transmission spectrum. Especially, in the study, the number of interference fringes is not as critical for the ability to perform the GA process and there is no need for successive parabolic interpolation and extra calculation as in the envelope method. One of the advantages of this method in comparison with the classical methods such as envelope method for the calculation of optical constants is considerably quicker. The GA method is successful in retrieving optical transmission spectra with optical constants such as t, n(λ), and α(λ) for model and experimental single-sided films. For films made of the same material such as ZnO but having a different thickness, the algorithm retrieves properly the properties and the thickness of the films. Using the proposed model for the refractive index dispersion and absorption, the T curves of thin ZnO films have been fitted and most of the data fitted well into the customized equation giving the R 2 value is higher than 0.950. This method will be used for the multilayered structures by changing the cost function in our future work.
Footnotes
Declaration of conflicting interests
The author(s) declared no potential conflicts of interest with respect to the research, authorship, and/or publication of this article.
Funding
The author(s) disclosed receipt of the following financial support for the research, authorship, and/or publication of this article: This study was supported by The Scientific Research Unit of Mehmet Akif Ersoy University with project numbers 0172-NAP-13, 0173-NAP-13, 156-YL-12, 0324-NAP-16, and 0356-NAP-16.