
Abstract
Indoor thermal comfort is a crucial factor for occupant productivity and energy-related behavior in workspaces. Recent studies have shown that non-thermal factors, such as interior design elements, can also affect human thermal perception. A novel experimental methodology is introduced to identify these factors, consisting of two steps: (i) representing an office environment using Building Information Modelling (BIM) and Virtual Reality (VR) tools and (ii) evaluating users’ perceptions in the reproduced virtual environment. Indeed, VR enables the creation of fully customizable and immersive scenarios, allowing individuals to experience lifelike sensations and provide real-time feedback on their comfort level. One hundred subjects were interviewed about their comfort and productivity perception in 12 different VR scenes with specific design parameters. Results show that natural lighting and windows with tall and narrow proportions improve occupants’ thermal comfort and perceived productivity. Multilevel regression analysis shows that these predictors have a bigger impact on productivity than on thermal sensation. Implementing this methodology in the early-stage design of workspaces may lead to effective strategies for increasing employee satisfaction and productivity. Additionally, retrofitting buildings based on occupants’ thermal perceptions can optimize energy use by reducing the demand on heating, ventilation, and air conditioning systems. This approach allows for reduced runtimes without compromising occupant comfort.
Keywords
Introduction
Nowadays, people spend about 90% of their lifetime indoors, where almost all human activities within professional and personal daily life occur. 1 For this reason, a proper building design that considers a human-centered perspective is needed, not only from an occupants’ well-being standpoint but also from an energy-related concern. 2 Indeed, building operations account for a significant percentage of the total primary energy consumption in many countries: heating, ventilation, and air conditioning (HVAC) systems need to satisfy the increasing demand for high-quality indoor environmental conditions, consuming even more than 50% of the total energy required by a building. 3 Despite this, common practice still lacks in combining buildings and energy systems design with occupants’ needs, environmental perception, and consequent behavior prediction. As a result, neither adequate indoor environmental quality (IEQ) nor the required robustness in terms of modeling prediction is achieved. 4
By definition, IEQ is a perception of the building’s indoor environment influenced by the combination of factors belonging to four main domains: thermal, visual, acoustic, and indoor air quality (IAQ).5,6 Among them, thermal discomfort and poor air quality are key influential factors on the final interior spaces’ livability, which may also lead to health problems, learning difficulties, and low productivity levels for occupants.7,8 According to the ASHRAE 55 Standard, thermal comfort is “the condition of the mind in which satisfaction is expressed with the thermal environment and is assessed by subjective evaluation”. 9 This definition recalls the influence of physical, physiological, and psychological spheres of the thermal sensation alongside personal, social, and cultural differences between individuals.10,11 Sintov et al. 12 investigate the role of gender in thermal comfort perception. Despite such a human-related interpretation, recently consolidated by Schweiker et al., 13 many acknowledged scientific models are strongly tailored to indoor parameters, only referring to the thermal domain.14,15 In fact, since 1972, parameters affecting thermal sensations have been identified with air temperature, air velocity, mean radiant temperature, and relative humidity, as physical quantities, and clothing insulation plus metabolic rate, as personal factors. 16 Only the late introduction of adaptive models highlights the influence of social and personal time adaptability.14,17,18
Moving from thermal comfort to the overall IEQ, parameters influencing people’s perception involve both (i) physical environmental quantities, linked to four domains, and (ii) personal individual factors, not always directly measurable, related to physiological, biological, psychological, and sociological variables. 19 Many studies focus on the effects of a single environmental factor through campaigns where occupants are exposed to one or two “stressors” at a time while keeping the other environmental factors constant. 20 Starting from these researches, technical standards and design guidelines are generally elaborated in order to set specific requirements about acoustic, 21 thermal,9,22 visual environment, 23 and indoor air quality. 24 However, compliance with these standards does not always ensure high IEQ for all occupants at all times of the day. 25 Individual perceptions, preferences, and comfort thresholds are shaped by personal characteristics and backgrounds, 26 yet the interaction of these factors is often underexplored in relation to how humans realistically experience indoor environments. 27 For this reason, several research studies investigate the relationship between IEQ and human well-being, highlighting how the first can have both short and long-term impacts on the second.28,29 At the same time, given the significant role that occupants play in buildings’ final operational costs, researchers agree on the economic benefit that a good IEQ can bring, especially in terms of occupancy performance in working environments, overall satisfaction with living spaces, and potential energy consumption reduction.30–32 In this context, also external building design and interior arrangement can improve indoor perception: according to Al Horr et al., 28 design choices like indoor layout, views, and location impact the overall IEQ perception and, consequently, on the occupants’ satisfaction. In general, people’s well-being is usually higher in a “green” natural environment: the combination of greenery, natural materials, and open spaces with proper spatial proportions can improve the overall users’ satisfaction. 33
All this considered, also reflections on the economic aspects in workplaces must be taken into account34,35: several studies demonstrate that a small change in occupants’ performance can produce a huge impact on their company operational cost. 36 For instance, a survey-based investigation conducted among professionals in the UK reports that a good office environment, i.e., a workplace whose settings satisfy at least 80% of its users, 9 can lead up to a 20% increase in productivity, equal to £ 135bn per year on a national basis. 37 In parallel, the possibility of choosing a smart and personalized control system has proven to enhance user comfort and energy management. 38 For this reason, researchers are taking advantage of technological and data analytics innovations to develop increasingly affordable facilities and monitoring systems, looking for occupants’ feedback on environmental stimuli that may lead to the design of high-performance buildings in the future.39–42 Up to now, the number of occupants is estimated through different predictive models, 43 while user behavior is generally derived from the analyses of post-occupancy surveys aimed at the evaluation of people's satisfaction according to different physical and non-physical aspects. 44 If results coming from such investigations were available since the early stage of building design, companies working in the construction sector would have an advantage in achieving energy savings and occupants’ well-being.45,46
For this reason, during the last decades, many applications of Immersive Virtual Environments (IVE) 47 have been explored to record people’s responses to different simulated design settings before their actual construction.48,49 Despite IVEs can influence people’s judgment, affecting their perception and behavior, 50 different researches demonstrate that IVE is a reliable tool for assessing human comfort perception in modeled indoors51,52 and, consequently, enhances occupants’ energy-related behavioral models. 53 Other studies further demonstrated the IVE tool’s efficacy in supporting design communication and promoting stakeholder coordination in the interior design sector, with the main view of enhancing both design-team productivity and end-user satisfaction.54,55
Integrating IVEs with Building Information Modeling (BIM) paves the way for a dynamic approach capable of facilitating decision-making during the design phase, offering an immersive way to evaluate multiple scenarios and optimize aspects like energy efficiency, thermal comfort, etc. Azhar et al. 56 define BIM as the process of development and use of a computer-generated model to simulate the planning, design, construction, and operation of a facility. Scenes in Virtual Reality (VR) derived from a BIM model are data-rich, object-oriented, intelligent, and parametric digital representations of the facility, i.e., a digital space where various parameters can be easily adjusted and controlled in real-time. 57 These highly detailed and interactive 3D models allow users to engage with and explore the virtual space, enabling the extraction and analysis of user-related data. This data provides valuable insights into user needs, which can be leveraged to inform decision-making and enhance the facility’s design, delivery, and overall performance. BIM is considered to be a disruptive paradigm shift in construction projects: it is successfully implemented within the framework of a digital-twin-assisted building energy design. In detail, it consists in creating a realistic and informed virtual twin of products, machines, processes, and environments to support building design, operation, and construction. 58 The twin includes the information needed for decision-making and building operation by occupants, being able to simulate improved behaviors in real and forced conditions. Stemming from the data generated, machine learning and artificial intelligence can be used to provide statistical analysis and direct the development of digital twins. 59
In this context, the current work presents a novel methodology that integrates physical and personal assessments of indoor working environment preferences. By leveraging VR technology and advanced data analysis techniques, this approach offers a deeper understanding of occupant comfort and productivity within the built environment. Traditional approaches to building design often rely on generalized guidelines and standards, which may not adequately address the nuanced interplay of various design parameters. This work recognizes the complexity of these interactions and employs rigorous statistical analysis to uncover hidden relationships between indoor variables and occupant responses. For instance, Guan et al. 60 provide an example of the effectiveness achieved thanks to the use of a t-test and ANOVA analysis to analyze subjective and physiological responses due to thermal-acoustic triggers, overcoming the classic approach given by building design guidelines. In this case, the ANOVA analysis revealed that thermal comfort was significantly affected by temperature (as expected) and sound pressure level, but no significant correlation was found between sound pressure level and temperature.
Our methodology champions a human-centered design approach by incorporating occupant feedback early in the building design process. The research questions we want to address are: (i) What is the impact of specific design elements on occupant thermal and productivity perception in office buildings? (ii) How can BIM and VR technologies be leveraged to understand such impacts in a human-centered design approach?
Through immersive VR experiences, occupants can actively participate in shaping their future workspaces, providing valuable insights into their preferences and needs. This iterative co-design process aims to optimize IEQ and create work environments that foster both comfort and productivity. By bridging the gap between physical and personal assessments, this research offers a powerful tool for architects, designers, and building professionals to create spaces that prioritize occupant well-being and enhance the overall workplace experience.
Method
The proposed experimental methodology aims to identify key factors that could drive the development of energy efficiency solutions while considering a human-centric perspective and the specific occupants’ or stakeholders’ needs.
61
The BIM-implemented Autodesk Revit 2019 platform
62
was used to model dynamic environments that can be easily and promptly adjusted in terms of geometries and surface properties. Furthermore, the same platform allows elaborating stereo-panorama images to be used within a VR headset, thanks to the Autodesk Cloud Service. As shown in Figure 1 - Experimental workflow scheme, the overall experimental workflow can be summarized in four main steps. After the modeling of a simple office room (stage 1), 50 people were asked to evaluate their sense of presence with respect to the virtual environment they were exposed to (stage 2): such a 10-min procedure was propaedeutic for both the assessment of subjects’ feelings of immersion in VR and for the validation of the virtual environment itself. Experimental workflow scheme.
At a later stage, the core experiment was performed on 102 participants (stage 3) who were exposed to a series of 12 scenes of almost the same office space, virtually reproduced. Participants were asked about their thermal sensation and perceived productivity rating for each scene. Finally, data were analytically and statistically analyzed (stage 4) in order to identify the predictors that affect most people’s perceptions within VR. The experimental procedures did not include any intervention on the participants, and experiments were designed and performed following the relevant guidelines and regulations. All the subjects involved, both at stages 1 and 2 of the methodology, voluntarily joined the activity and were informed about potential risks related to their participation. They were also informed that they would be free to leave the test at any moment. Therefore, written informed consent was obtained from all before starting the tests. Finally, they were informed that all the provided data would be treated anonymously according to the EU General Data Protection Regulation.
VR validation tests
The preliminary tests of the experimental campaign took place in an office at the CIRIAF Research Centre of Perugia’s University in central Italy. The virtual reproduction of the office was compared to a spherical photo taken using a fisheye GoPro Fusion camera set at 1.2 m from the pavement, the sight height of a sitting person. Both outputs were alternatively shown in the VR headset in order to verify and potentially trigger a personal sense of immersion inside the different scenes. During each session, environmental conditions in the office did not change, and participants were sitting on a swivel chair, able to freely explore the surrounding virtual environment in any direction. A total of 50 people took part in the VR validation tests series described in detail by Vittori et al. 61
The core experiment
The core experiment consisted of exposing each participant to a series of 12 different VR scenes generated from almost the same office model and consecutively presented. Each scene differed from the previous one because of the variation of a single design parameter. Parameters were chosen based on key characteristics of the office environment used in the validation tests, focusing on aspects that could be adjusted to influence non-thermal domains, such as the visual domain, within a Virtual Reality setting. To inform optimal building envelope design, the study emphasized both direct and indirect variables, particularly those related to glazing and lighting elements.
Participants (102 subjects in total) were immersed in each VR scene for 1.5 minutes. The whole experiment duration was 18 minutes. At the end of each scene, the subjects evaluated, on a 5-point scale, their thermal sensation (from −2, very cold, to +2, very warm) and self-perceived productivity (from 1, very low, to 5, very high). The VR-based tests took place in a conditioned room (providing stationary thermal conditions for the whole experiment duration, i.e., 26 ± 1°C) where people entered 30 minutes before starting the experiment, getting instructed on the procedure and fulfilling the requested demographic information.
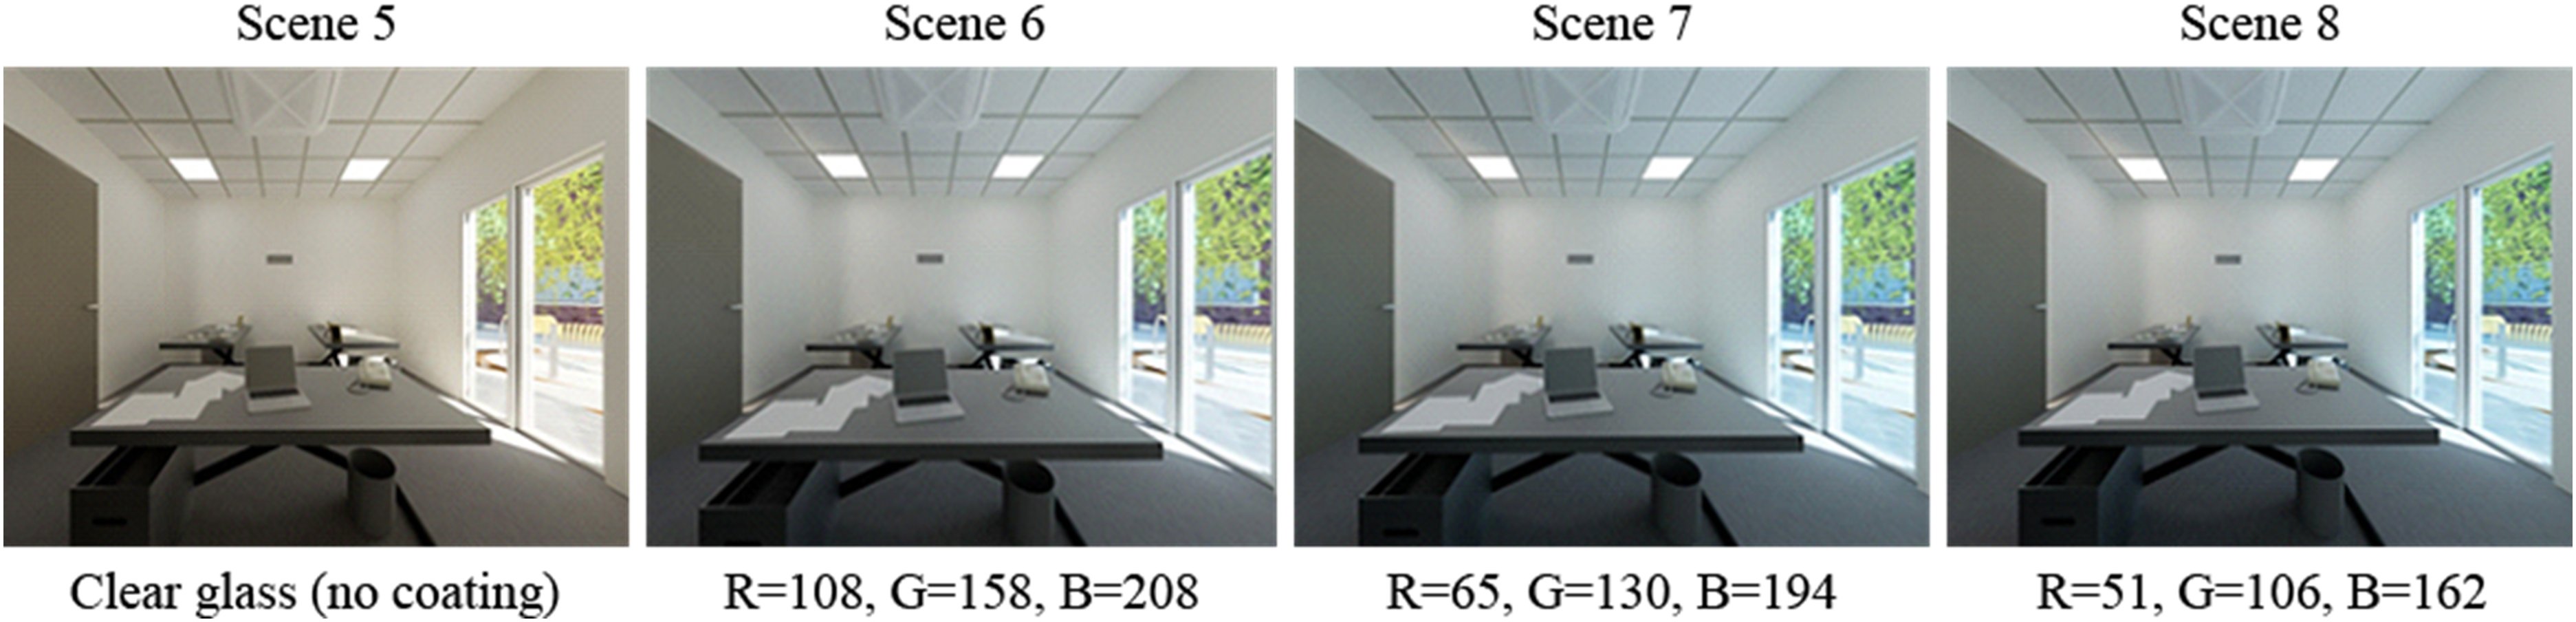
Figures 2–4 provide an overview of the 12 modeled scenes, grouped by the same dynamic design parameter selected as a potential factor influencing both subjects’ thermal and productivity perception, as specified in the following: • Figure 2 (S1–S4) Scenes with variable window size (WS): the office window size (WS) changes, moving from a horizontal ribbon configuration to a vertical door window. However, the total glass surface stays the same, being equal to 2.64 m2. • Figure 3 (S5–S8) Scenes with variable window glass coating, identified by means of RGB color coordinates: the blue pigments amount in the window coating is progressively incremented while keeping the same door-window configuration of scene 4 (S4 and S5 are exactly the same). The blue filter is progressively added to the window glass transparency, whose RGB code is reported for each scene. Applying a bluish coating to the window’s glass is a common solution for energy savings that leads to the reduction of both internal heat loss in winter and solar heat gains in summer. • Figure 4 (S9–S12) Scenes with variable lighting color temperature (CCT): the corresponding color temperature (CCT) of the artificial light in the room changes, decreasing through the four scenes. To avoid the influence of external virtual sunlight, the office room is rendered at night. Scenes with variable window size (WS). Scenes with variable window glass coating, identified by means of RGB color coordinates. Scenes with variable lighting color temperature (CCT).


Results
In this Section, results from each part of the experimental procedure are reported and discussed. It should be specified that the response given by people who felt completely uncomfortable using the VR headset was excluded from the results analysis. Indeed, before each test, participants were asked if they felt comfortable using the visor. Over 76% of them judged their sense of presence in the virtual environment positively and felt comfortable using the headset; another 20% declared the virtual environment was anyhow suitable, but they would have preferred a real one. Only two subjects, out of the 102 total interviewed people, felt uncomfortable using the headset: their perception could be biased by such feelings, and, therefore, their tests were not considered. After such considerations, participants’ feedback on the 12 office scenes was used as an indicator of both thermal sensation and perceived productivity.
Thermal sensation and perceived productivity ANOVA. Pair comparisons were carried out by using the Tukey HSD test.

Thermal sensation ANOVA.

Note. *p < .05; **p < .01; ***p < .001.
Perceived productivity ANOVA.

Note. *p < .05; **p < .01; ***p < .001.
Among S1–S4 scenes, there are no significant differences with respect to the average of thermal perception, even if the feeling of warmth increases when the window shape changes from horizontal to vertical (as observed in mean variation, Table 2). Comparing the most horizontal window (S1) with the most vertical one (S4), an 18% increase in the average of perceived thermal sensation is observed. This suggests that changes to the window shape alone have minimal impact on occupants’ overall thermal sensation, even though a door-shaped window might evoke a feeling of increased warmth compared to a fully horizontal window configuration.
On the other hand, differences among scenes S5–S8 suggest that applying or non-applying the window coating is what makes the real difference in the perception. In fact, expressed thermal sensation votes in scene 5 are statistically different from all the others related to the window coating series (S6–S8), while no statistically significant differences are perceived among the different coated scenes. Lastly, considering the influence of lighting color temperature (scenes S9–S12) on thermal perception, it seems that the change from 4000 K (S10), typical of a quartz light, to 2800 K (S11), proper of an incandescent light, has the greatest impact.
Focusing on perceived productivity (Table 3), a first big difference can be observed while switching from daylight (scenes S1–S8) to artificial light (scenes S9–S12): almost all the office rooms lighted by artificial sources are perceived as lower-productive environments. Moreover, the evaluation of possible biases in the methodology is carried out by comparing votes collected for the two consecutive scenes, S4 and S5, which are exactly the same (vertical door window and no glass coating). This last statement is confirmed by the mean values of S4 and S5 for both parameters.
In order to investigate the connection between perceived thermal comfort and productivity further, a t-test was performed, to compare the mean scores of the latter related to optimal and non-optimal comfort situations. The optimal comfort condition includes all the thermal votes equal to zero, i.e., thermal neutrality, while all the others belong to the non-optimal comfort class. As shown in Figure 5, the t-test is significant (ρ = .000), with a mean difference between the two results of 0.249. Average value of perceived productivity according to different comfort conditions.
Multilevel regression for thermal sensation.

Note. *p < .05; **p < .01; ***p < .001.
Multilevel regression for perceived productivity.

Note. *p < .05; **p < .01; ***p < .001.
Analyzing the empty model for thermal perception (Model 1, Table 4), the intra-class correlation coefficient is equal to 0.1402, which means that about 14% of the variance is attributable to differences among the interviewed subjects. With respect to the empty model, the residual variance is reduced up to 15.64% by the predictors. The control variables are never significant. In Model 2, their combined effect is tested, and a level-2 variance reduction of 7.46% is achieved, with no reduction at level 1. More interestingly, a significant impact of window shape, coating, and lighting on the thermal feeling of individuals is observed. While the window shape seems to introduce a minor change in the expressed thermal sensation, coating, and lighting are responsible for a non-negligible variation of thermal perceived comfort, even if no variations in the physical conditions of the real environment occurred during the experiment. 61 Consistently with the results from the ANOVA, the application of window coating and a warmer light, i.e., a lower CCT, are found to reduce the expressed thermal sensation significantly. This is also true when comparing the scene of artificial light at 1800K (S12) with those simulating daylight (S1–S8, with the light source at 5780 K), even if the thermal sensation reduction is less evident with respect to the observed decrease in the scene with artificial light at 5000 K (S9). In general, when the CCT of artificial lighting increases, the subjects’ responses indicate a lower perceived temperature. This is only partially confirmed in the case of the highest CCT value (5780 K), resembling daylight (as the coefficient is lower than the one of 5000 K), showing that subjects respond better to natural light than to artificial light. Moreover, even if the effect of window glass coating is significant, the L1 variance reduction produced by such a variable is small if compared to the one caused by lighting.
From the perceived productivity empty model (Model 1, Table 5), it can be noticed that the intra-class correlation coefficient is 0.2521, meaning that about 25% of the variance is attributable to differences between experiment subjects. Considering the full model (Model 5), the residual variance of Model 1 is reduced by 19.60%. This is a better result if compared to the one obtained for thermal perception (reduction of 15.64%): indeed, predictors have a bigger impact on perceived productivity than on thermal feeling. Also in this case, all the control variables are never significant. If the window shape is further included as a predictor, the residual variance is reduced by 16.24%. Model 5 indicates that the more the window shape is close to a door-window (vertically oriented with potential options to go through it), the higher is the feeling of being productive. On the other hand, the impact of the window coating is minimal, and all its dummy variables are non-significant. Considering the full model (Model 5), only window size number 4 (door-window, S4) remains significant if compared to window number 1 (ribbon window, S1), suggesting that the possibility of walking through the window and having a full vertical view of the panorama are beneficial to perceived productivity. The effects of the other window shapes are probably covered by artificial lighting color temperature, which is a predictor that can additionally reduce the residual variance by about 3%. In particular, interviewees felt more productive with a light at 2800 K than with the warmest light at 1800 K. However, the larger coefficient is for the case of natural light (daylight, at 5780 K), which showed the strongest positive impact on perceived productivity. No significant differences are found for the other values of 4000 K and 5000 K. In other words, people felt more productive in working scenarios with natural light and a door-window shape.
Discussion
This study emphasizes the importance of considering building occupants’ comfort and productivity perceptions as key drivers for creating high energy-efficient and sustainable indoor workplaces. The findings suggest that understanding the role of design features in influencing occupants’ perceptions is crucial in the early building design phase. The study introduced a novel methodology that uses Immersive Virtual Environments (IVEs) and detailed statistical means to detect occupants’ environmental satisfaction and productivity perception within their working environment. To this aim, the adoption of IVE (Immersive Virtual Environment) proved to be a useful tool, as already demonstrated by Arsalan Heydarian et al. 66 by focusing on the occupants’ lighting-use behavior in an office environment. Generally, the lighting-visual field is one of the best investigated through the IVEs.
This approach allows for potential energy savings and economic benefits to be assessed in a user-centered building design phase. The study identifies several design elements that significantly impact occupants’ well-being and productivity perception, such as natural lighting, correlated color temperature, and window orientation. The implementation of these findings in building design can lead to energy optimization and productivity increase. 67 The present study follows the same line of research, implementing a novel method that exploits IVEs and detailed statistical means while considering a much wider range of stimuli. In particular, the originality of the work consists of detecting occupants’ environmental satisfaction and productivity perception within their working environment reproduced as IVE, paving the way to future developments where potential energy-saving and economic benefits could be assessed in a user-centered building design phase. More in detail, Virtual Reality (VR) and integrated modeling platforms were first used to lead participants through an immersive test aiming to evaluate the procedure’s reliability in terms of perceived realism while wearing the VR visor. Given the positive response from such a preliminary step, the core experiment was implemented: a series of 12 scenes representing the same office room was shown to each participant at regular intervals of time and without varying any physical parameters of the real environment in which the test took place. For each scene, only a design feature changed: environments S1–S4 differed with respect to the window size, environments S5-S8 differed for the window glass coating, while environments S9–S12 differed for the CCT of the artificial light in the room. The exposure to each scenario was followed by the rating of the thermal sensation and productivity perception by the subjects.
In the second stage, the analysis of the collected data highlighted the presence of statistically significant differences between the scenes and identified design elements that may impact occupants’ well-being and productivity perception in their working environment. In particular, (i) natural light was found to be preferable to an artificial lighting system, consistent with the literature in the field 68 ; (ii) a higher lighting correlated color temperature translated into a lower perceived air temperature; (iii) a vertical window orientation led to a higher sense of being productive; (iv) changes in the window’s glass coating, instead, did not significantly affect neither the thermal nor the productivity perception. While the last finding supports, for example, the use of glasses with low-emission properties, the previous ones suggest useful strategies for energy saving in heating-dominated climates or winter conditions, as well as design tips for a highly productive environment. To translate these findings into economic benefits, the following key aspects should be highlighted: (i) maximizing daylighting and using appropriate CCT, buildings can significantly reduce artificial lighting needs, leading to lower energy consumption and operating costs; (ii) understanding the influence of window orientation on thermal perception can inform design decisions that minimize reliance on heating and cooling systems; (iii) a comfortable and stimulating work environment positively influences occupant well-being, which in turn increases output and improves business performance. More in general, the IVE-based method allows for the evaluation of design alternatives before construction. This can prevent costly design changes later in the project and optimize material selection.
Conclusion
The implementation of the here-presented methodology in a building design process can help define specific guidelines, the implementation of which may improve the performance of both new and retrofitted buildings. The main advantages would be energy optimization and productivity increase, which could be achieved through requalification strategies that could ultimately lead to more general economic benefits. However, possible limitations of such a procedure may hide behind (i) the relatively young age of the participants if compared to the average working population and (ii) the reliability of VR as a key tool for investigating environmental perception. In this view, recent literature confirmed that IVE represents a valid pre-design tool with significant potential for economic benefits, allowing for flexible co-design procedures and, in general, a less invasive construction management asset. 69 However, limitations such as the young age of the participants and the reliability of VR as a key tool for investigating environmental perception should be considered. Nonetheless, the methodology presented in this study could be considered as a baseline to evaluate the impact of different design choices on occupants’ perceived productivity and comfort, also considering their behavioral implications on energy efficiency and economic aspects. Future developments may include testing more IVE configurations and a larger sample size of participants. Overall, the originality of this study lies in its novel methodology, which offers a more comprehensive approach to understanding the impact of non-thermal factors on occupants’ thermal and productivity perception.
Therefore, in the future development of the work, a larger sample will be interviewed while being physiologically monitored through non-invasive and wearable devices, and further IVE configurations will be tested as preliminary immersion for different experiments. In conclusion, the innovative methodology presented in this research could be considered as a baseline to evaluate the impact that different design choices may have on the occupants’ perceived productivity and comfort, also considering their behavioral implications on energy efficiency and economic aspects.
Footnotes
Author contributions
F.V.: Methodology, Software, Formal analysis, Investigation, Data curation, Writing – original draft, Writing – review & editing; A.F.C.: Methodology, Formal analysis, Writing – original draft, Writing – review & editing; C.C.: Methodology, Formal analysis, Writing – original draft, Writing – review & editing; I.P.: Conceptualization, Methodology, Writing – original draft, Writing – review & editing; A.L.P.: Conceptualization, Resources, Writing – review & editing, Supervision, Funding acquisition.
Declaration of conflicting interests
The authors declared no potential conflicts of interest with respect to the research, authorship, and/or publication of this article.
Funding
The authors disclosed receipt of the following financial support for the research, authorship, and/or publication of this article. Acknowledgements are due to the National Ministry of Research for supporting NEXT.COM project “The NEXT generation of multiphysics and multidomain environmental COMfort models: theory elaboration and validation experiment under” under the framework of PRIN 2017 (cod. 20172FSCH4_002), and project WePOP “WEarable Platform for OptImised Personal comfort” (cod. 2022RKLB3J), and the European Project MuSIC (“Multi-sensory Solutions for Increasing Human-Building Resilience in face of Climate Change”) which has received funding from the European Union’s Horizon Europe research and innovation program under the Marie Sklodowska-Curie (G.A. n. 101073357). All these funded projects are coordinated by A.L. Pisello (corresponding author) on behalf of CIRIAF (UNIPG) and Department of Engineering (UNIPG). Funders have no role in the entire research process, from study design to submission.