
Abstract
Flight demand forecasting is a particularly critical component for airline revenue management because of the direct influence on the booking limits that determine airline profits. The traditional flight demand forecasting models generally only take day of the week (DOW) and the current data collection point (DCP) adds up bookings as the model input and uses linear regression, exponential smoothing, pick-up as well as other models to predict the final bookings of flights. These models can be regarded as time series flight demand forecasting models based on the interval between the current date and departure date. They fail to consider the early bookings change features in the specific flight pre-sale period, and have weak generalization ability, at last, they will lead to poor adaptability to the random changes of flight bookings. The support vector regression (SVR) model, which is derived from machine learning, has strong adaptability to nonlinear random changes of data and can adaptively learn the random disturbances of flight bookings. In this paper, flight bookings are automatically divided into peak, medium, and off (PMO) according to the season attribute. The SVR model is trained by using the vector composed of historical flight bookings and adding up bookings of DCP in the early stage of the flight pre-sale period. Compared with the traditional models, the priori information of flight is increased. We collect 2 years of domestic route bookings data of an airline in China before COVID-19 as the training and testing datasets, and divide these data into three categories: tourism, business, and general, the numerical results show that the SVR model significantly improves the forecasting accuracy and reduces RMSE compared with the traditional models. Therefore, this study provides a better choice for flight demand forecasting.
Keywords
Introduction
Flight demand forecasting is a particularly critical component for airline revenue management because of the direct influence on the booking limits that determine airline profits. And it is a critical factor for airlines to create value from the past to the future. 1 For example, flight demand forecasting could be used for airline economic estimate, airline operating cost and measures of productivity, airline planning progress, and airline schedule optimization, especially for airport resource planning, air traffic control, etc. 2 Thus, flight demand forecasting become one of the basic technologies of aviation industry innovation. The earliest research about this problem is accompanied by overbooking applications, Beckmann and Bobkoski 3 focus on no-shows and cancellations. Taylor 4 focuses on booking behaviors that determined show-ups, and the distribution models for passengers’ arrival processes are the main goal of researchers in these early years. Lyle 5 modeled demand as composed of a Gamma distribution with Poisson random errors, which gives a negative binomial distribution for total demand, similar studies also include Martinez and Sanchenz. 6 Belobaba 7 regards that the normal probability distribution gives a good continuous on booking data to aggregate flight demand distributions. This conclusion is widely accepted and applied to the revenue management practice of many airlines. On the other hand, data contained in historical booking records are censored by the presence of booking and capacity limits on past demand. So detruncation is the element before demand forecasting, the theoretical area of detruncation started with the Expectation-Maximization (EM) algorithm (Dempster et al.). 8 Swan 9 earlier addressed the downward bias of censoring on late data and suggested simple statistical remedial measures. Other detruncation algorithms include booking curve (BC) and projection detruncation (PD) Skwarek, 10 nearest research by Zeni. 11 Weatherford 12 shows that EM is the method of mean absolution deviation minimization. In this paper, we use the widely accepted EM method to detruncate the booking data before demand forecasting.
In addition to the study of passenger arrival distribution models and detruncation, the specific models of flight demand forecasting are another focus of the study, which is also the goal of our paper. In the airline application sense, the research on the flight demand forecasting of setting seat limits began with Littlewood, 13 who used the exponential smoothing model for the first time to predict two-class booking results. Since then, some traditional mathematical prediction models have been applied to flight demand forecasting, such as linear regression, time series, moving average, and two kinds of pick-up models. Wickham 14 summarized the traditional models before 1995. Later studies paid more attention to the improvement of flight prediction accuracy and the analysis of the impact on flight revenue, such as Zeni 10 and Fig.15,16 Many follow-up studies are still based on the improvement of traditional models, such as Boyd 17 and Zaki. 18
Around the turn of the century, many researchers turned to original & destination (O&D) demand forecasting, 19 or studied the passenger choice model from the perspective of passenger behavior for customized dynamic pricing, 20 but these are not the focus of this paper. Larry 21 review paper is the best summary of flight forecasting at present.
Flight demand forecasting is difficult and costly and the results are sometimes unsatisfactory because the flight booking data has the characteristics of large demand variety, strong seasonal fluctuation, largely impacted by holidays and special events, non-linear, and so on. So some forecasting algorithms aiming at the problem of relatively stable seasons, such as ARIMA, 22 are difficult to achieve good results on the flight forecasting problem. The forecasting accuracy has an important influence on flight seat limits set, and further significantly affects flight revenue. Therefore, despite decades of development, flight demand forecasting has been a continuous concern of researchers and practitioners. So, it is necessary to explore and develop high accuracy flight demand forecasting models and innovative methods. The support vector regression (SVR) proposed by Vapnik 23 is a machine learning method based on statistical learning theory. Compared with traditional methods, SVR model is more suitable for the airline context, because SVR model can add the demand of the sales period before the same departure date and sales time into the forecasting model in the form of vector; so that more information up to now can be used in demand forecasting. Based on SVR, Anurag 24 presents a meteorological drought prediction. Quan 25 presents a water temperature prediction, which provides useful insights into the application of SVR in predication areas. In addition, this paper compares SVR model with linear regression, the pick-up model, and the exponential smoothing method, and finds that SVR model can improve the forecasting accuracy, which provides a better choice for the algorithm used by airlines in demand forecasting.
Flight booking data analysis
Statistical analysis table of flight booking data.

Without losing the generality, Figure 1 compares the aggregated data for each month from 2018 to 2019 about a business route. Although the overall bookings fluctuate widely, but different years still show similar seasonal fluctuations. For example, the bookings from March to August are significantly higher than bookings in other months, which can be considered the peak season (P). January and November-December are lower and can be considered the off season (O). February and September are media, which can be considered the medium season (M). Affected by the short-term impact of the Chinese National Day, October was higher than September, but it still did not reach the peak of the peak season. Since February includes the Chinese Spring Festival, it has similar characteristics. Trend chart of the total monthly bookings for a business route.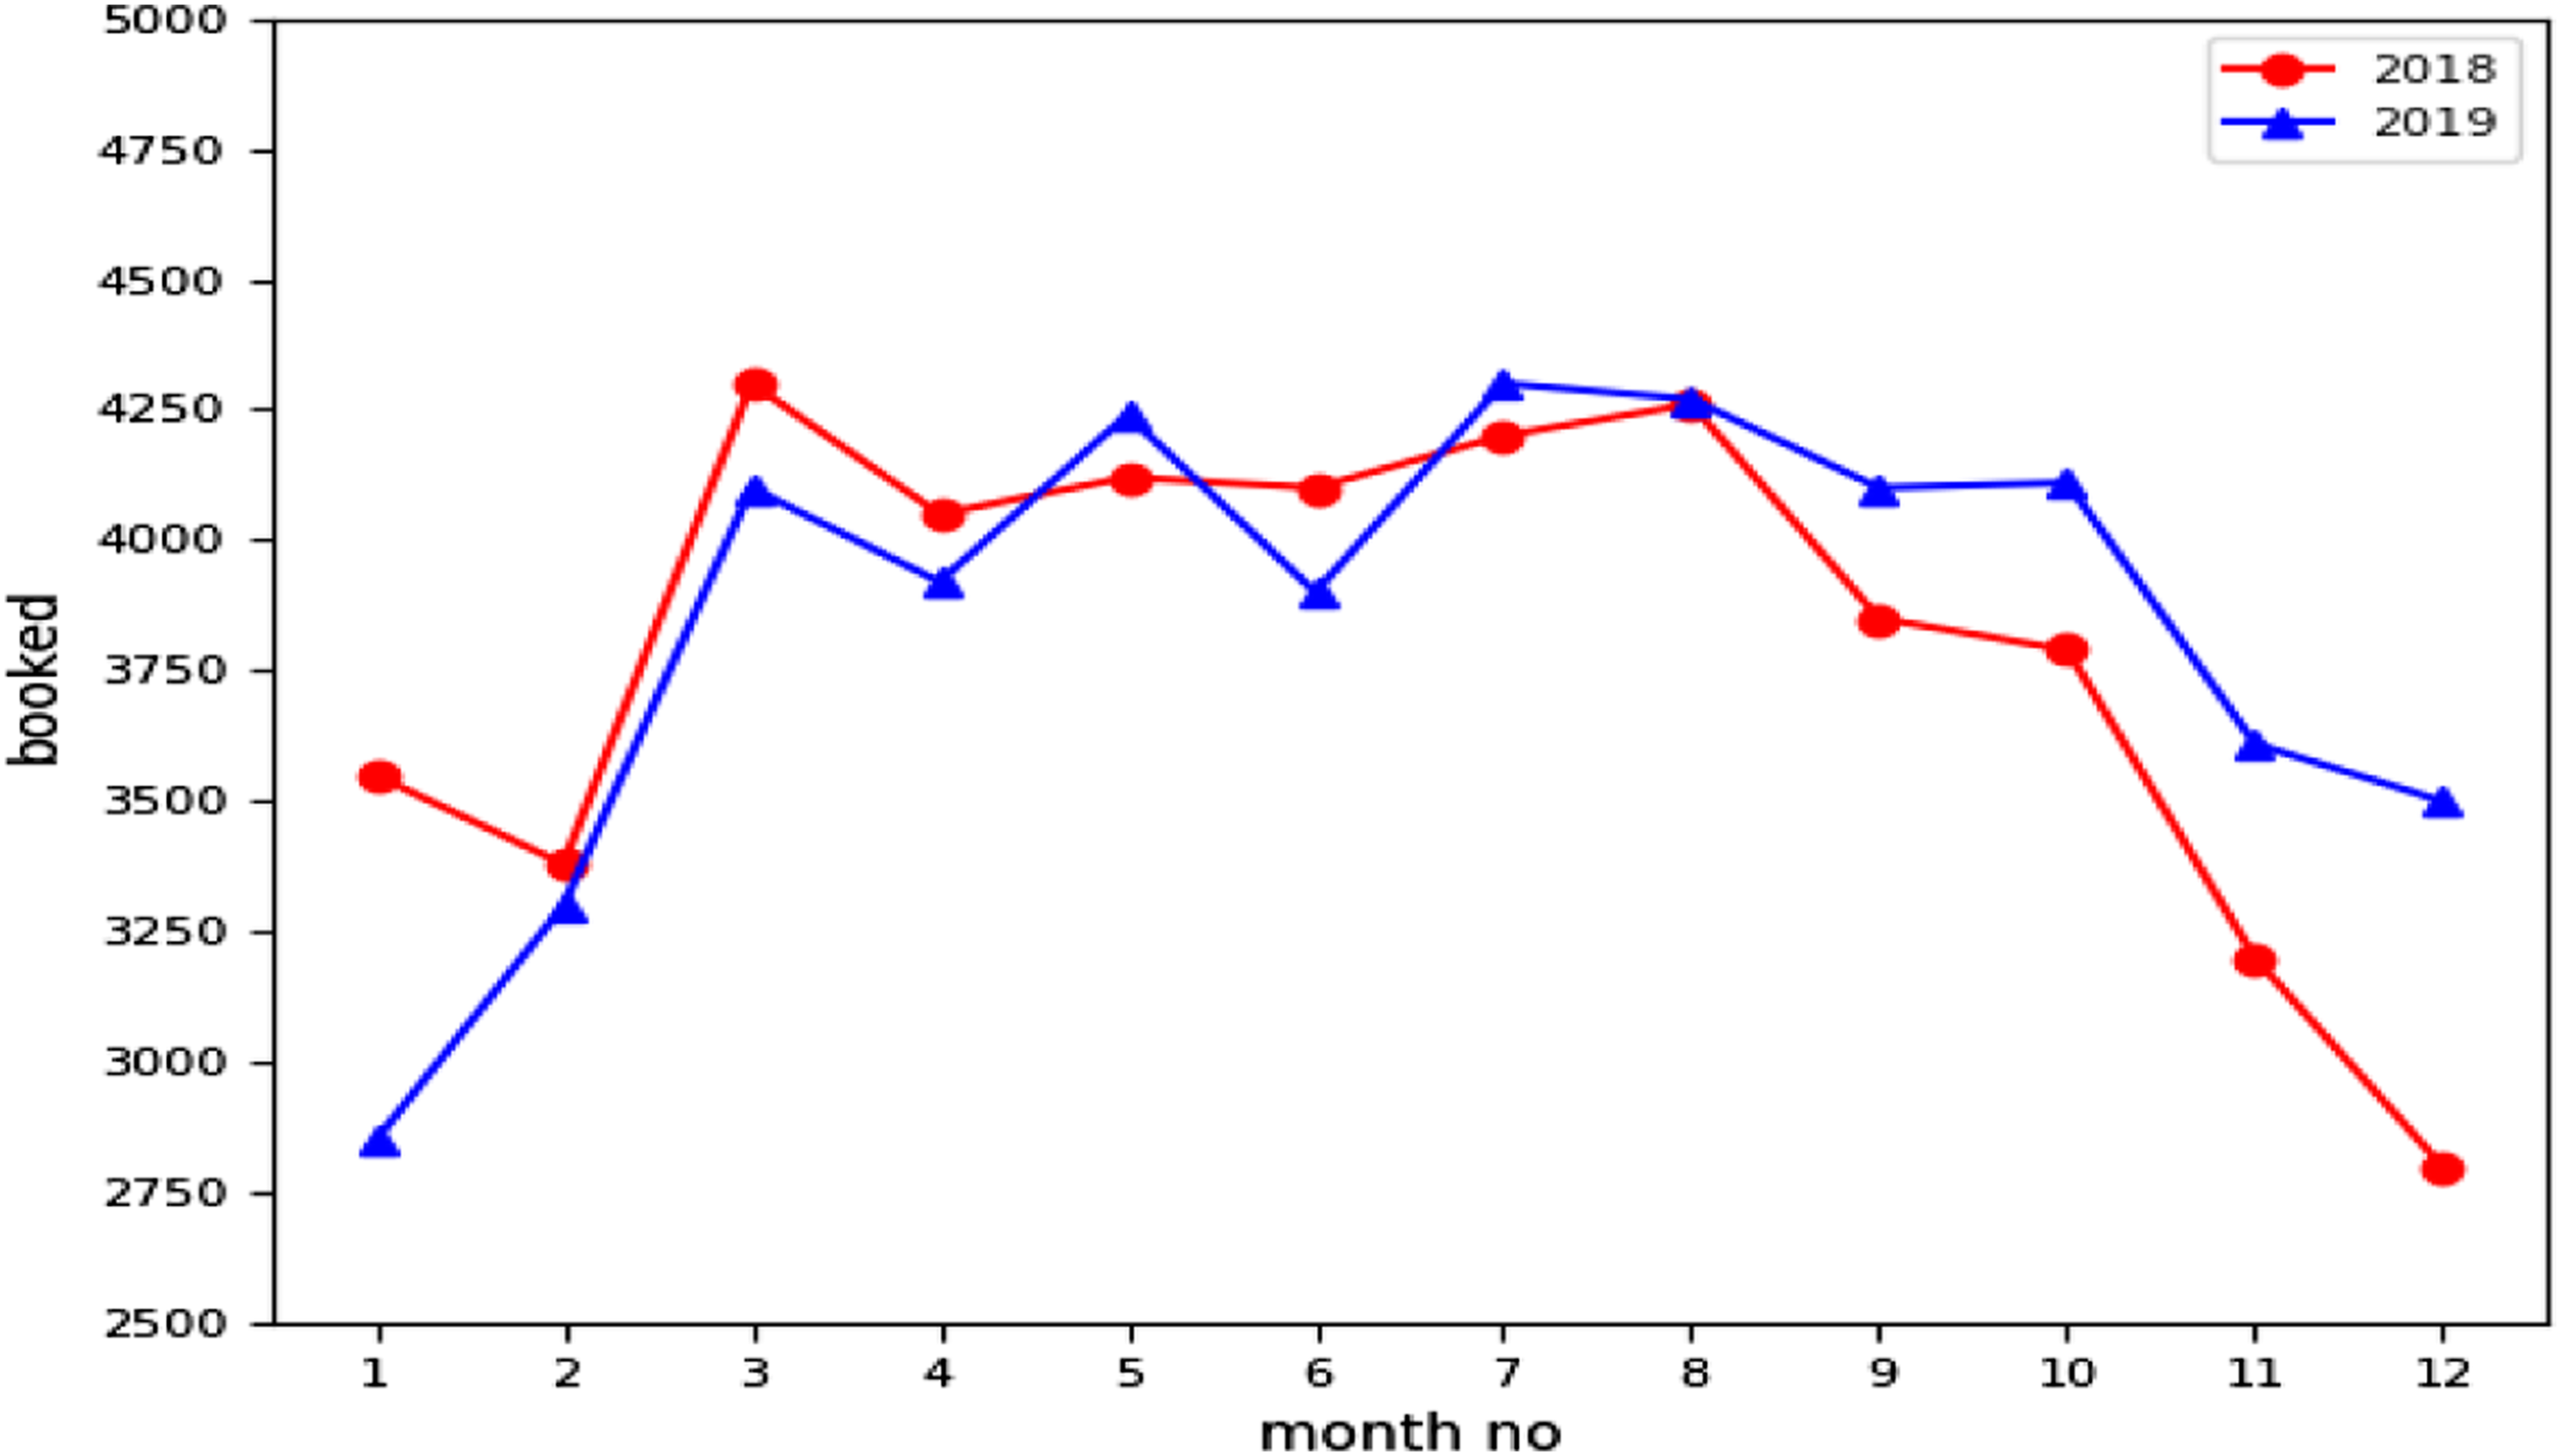
For the same business route as Figures 1 and 2 shows the average bookings changing trend by DOW (day of the week) in the same data set. We can find that the bookings and DOWs have a strong correlation. The average bookings on the first 3 days of the week are significantly higher than that on other days, and the lowest on Sunday. Through the above analysis, it is clear that although the flight bookings are relatively discrete, it is subject to seasonal characteristics, on the whole, showing the characteristics of peak season (P), medium season (M), and off season (O), and the DOW characteristic is obvious. A similar analysis was conducted on the bookings of tourist routes and ordinary routes. The results show the same seasonal characteristics and strong DOW correlation. These characteristics indicate that we need to establish different types of demand forecasting models on different classifications, and use classified data sets for model parameter training. Trend chart of the average value of DOW bookings for a business route.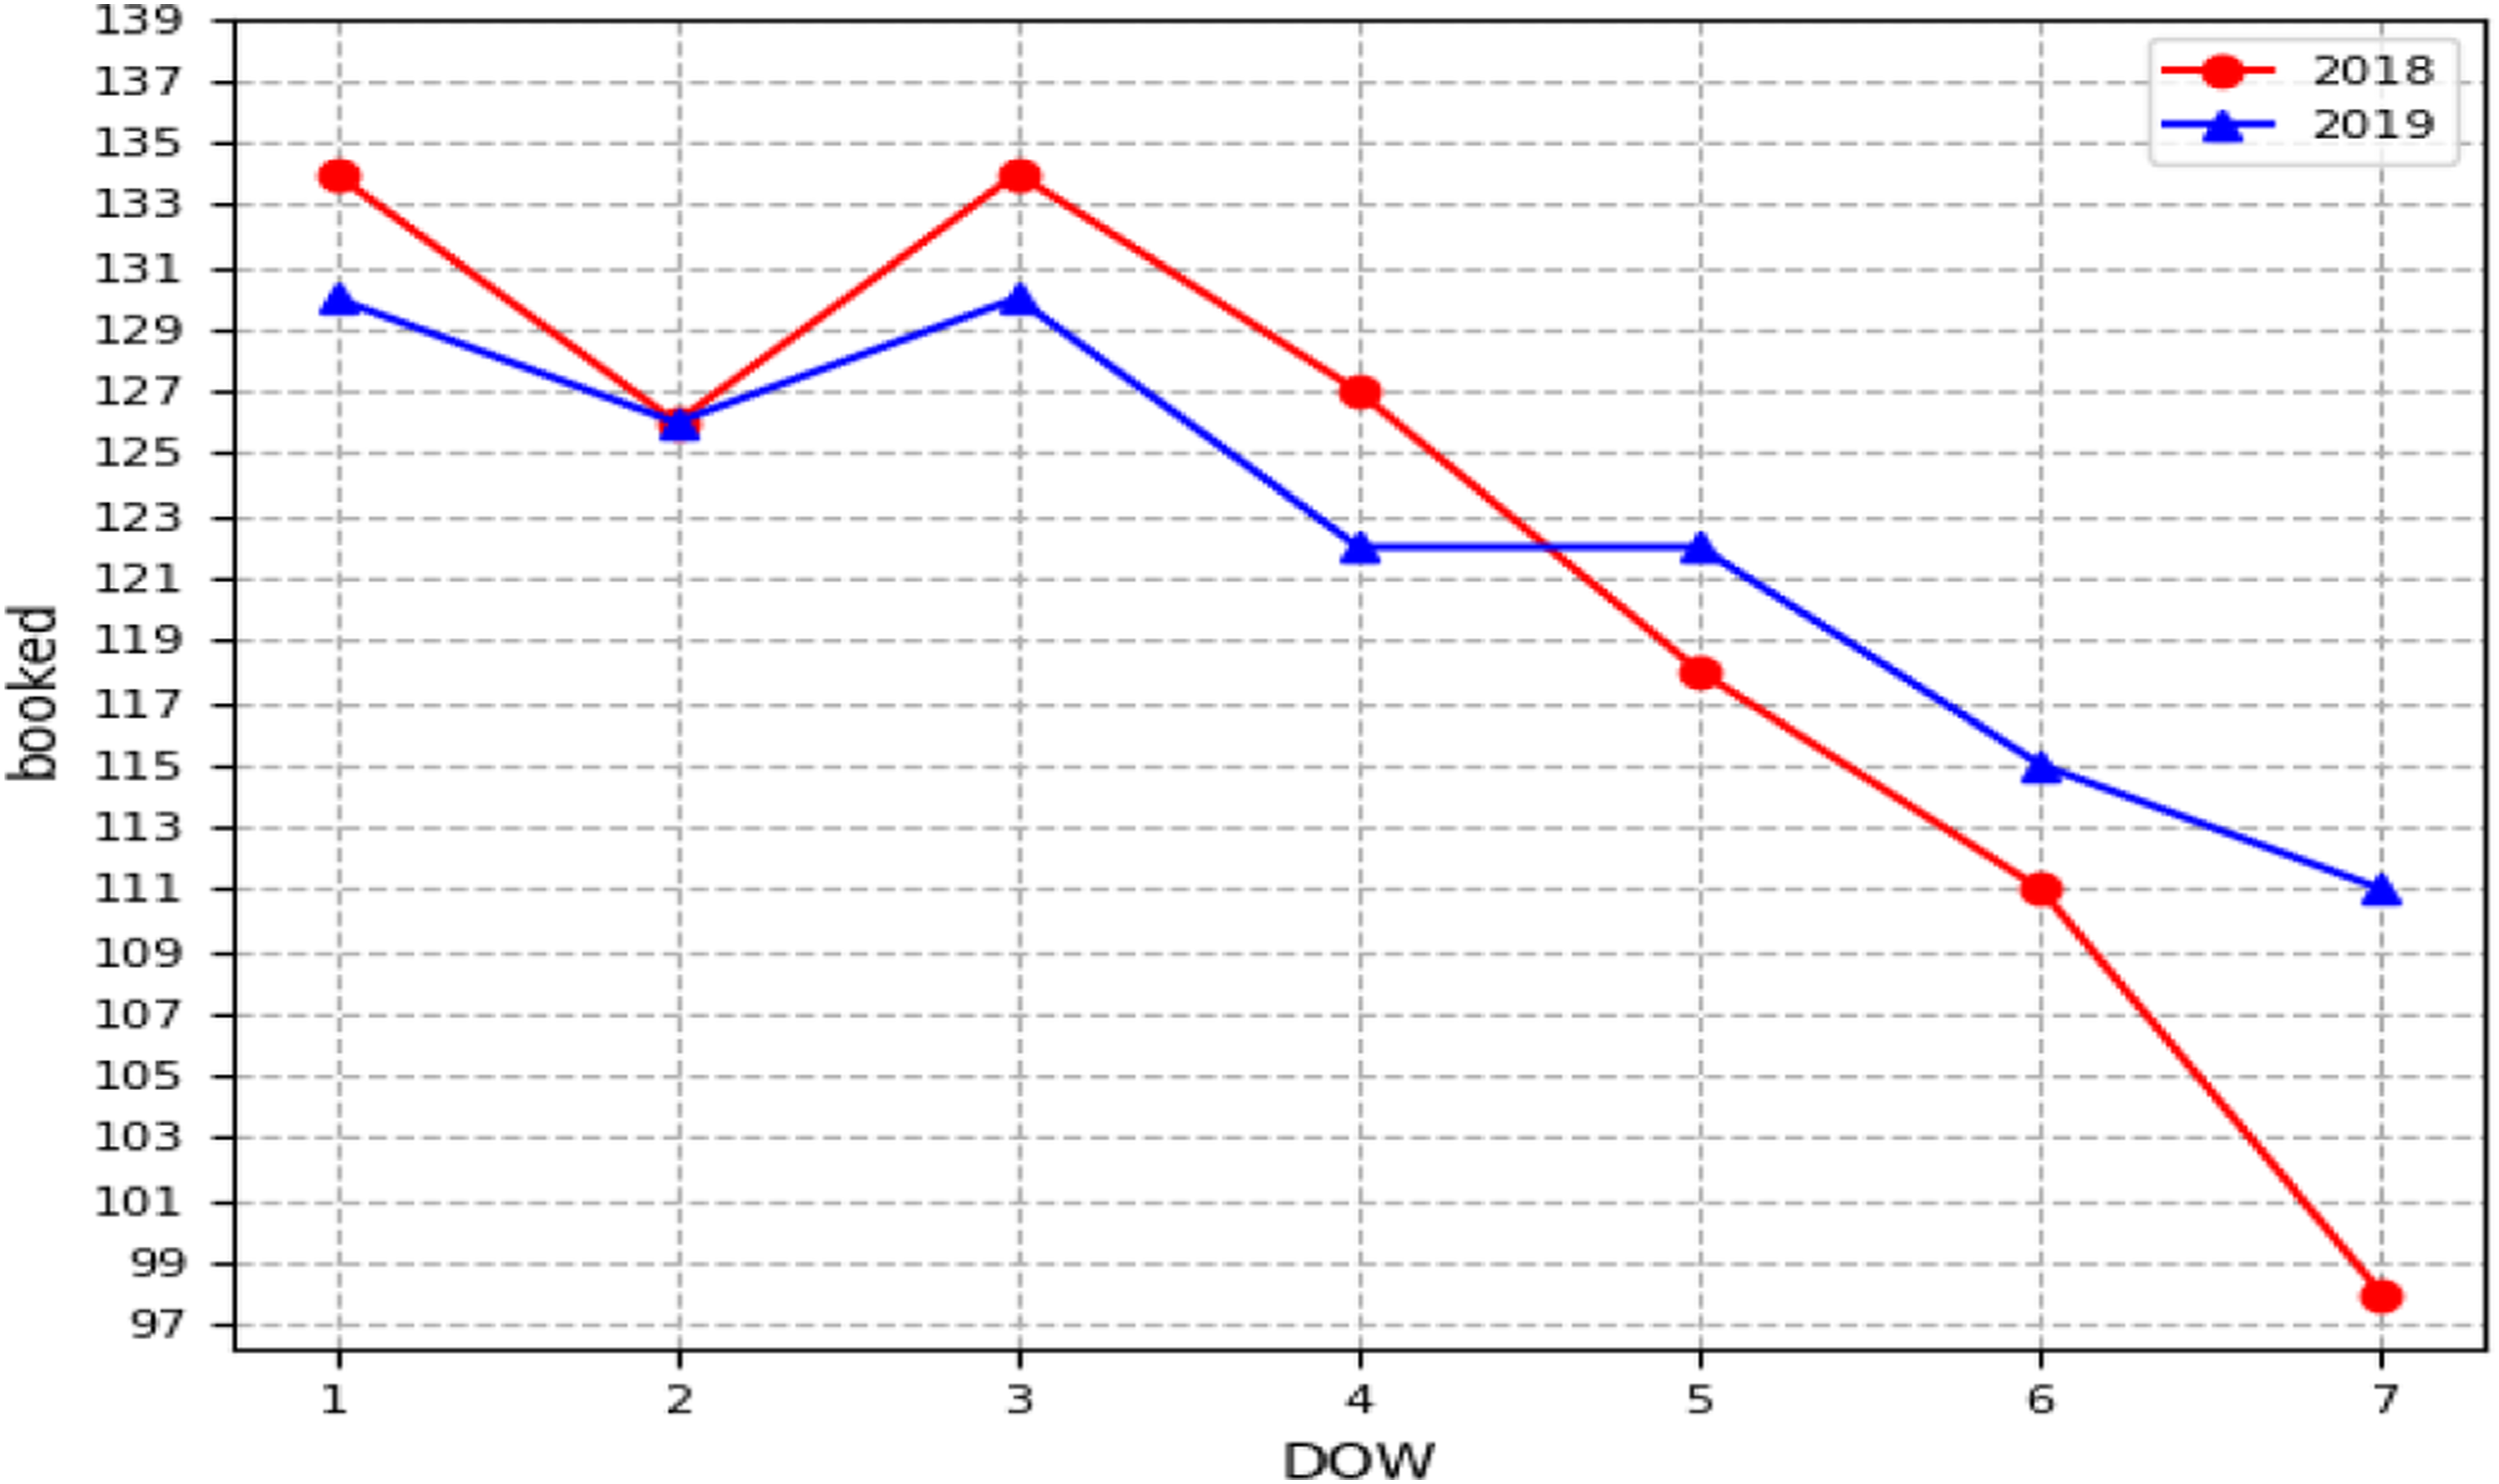
Organization of data and detruncation
Organization of data
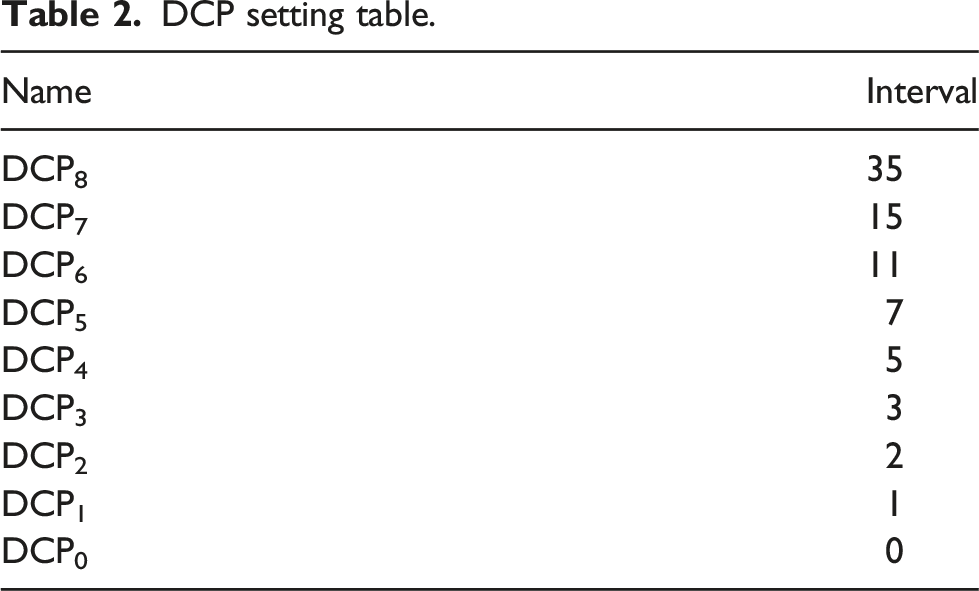
DCP setting table.
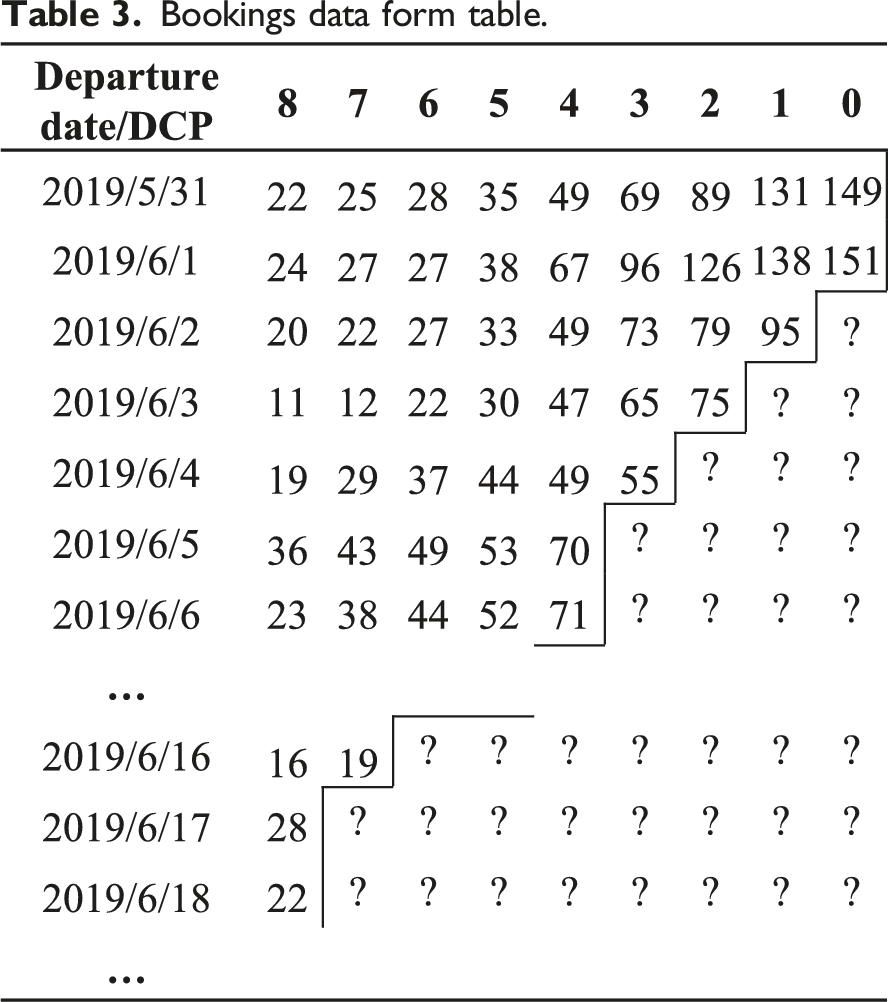
Bookings data form table.
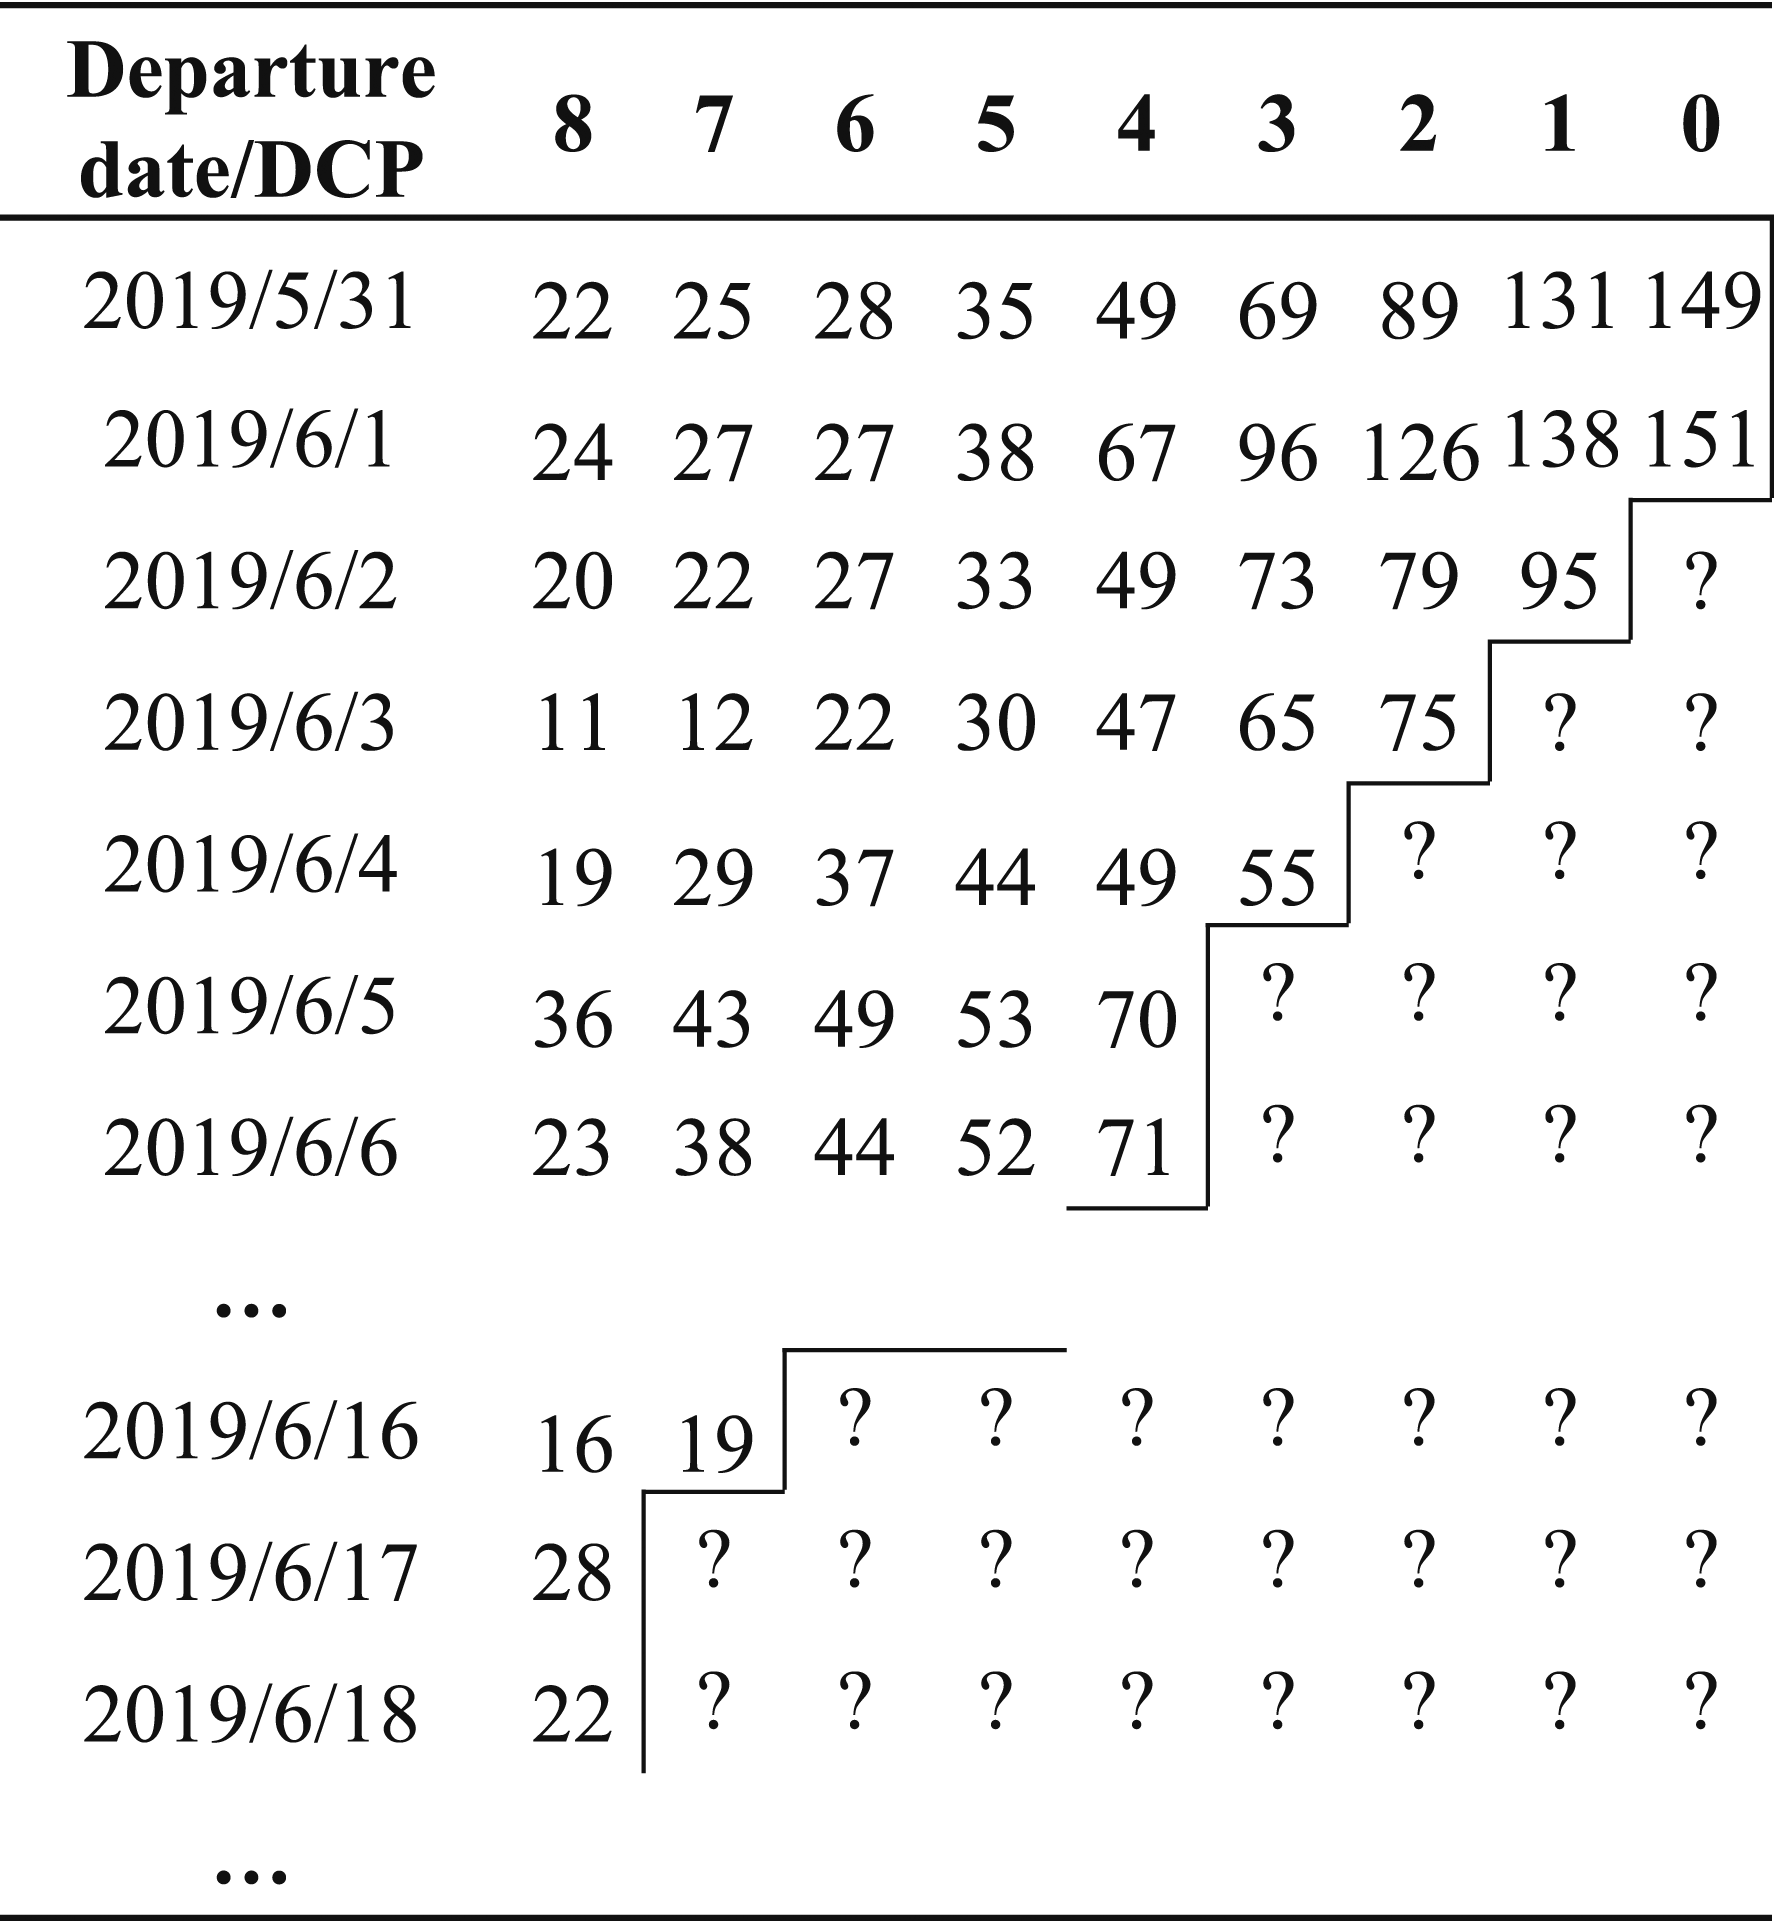
Symbol definition
In order to introduce the traditional flight demand forecasting models, 21 we first define the relevant symbols as follows.
Note that there are
The booking data set can be divided into two parts: training set and testing set according to the current date. As shown in Table 3, flights before June 1 are the training set and flights after June 2 are the testing set. There are
Detruncation
Because detruncation is the element before demand forecasting, so we use EM algorithm to correct constrained data before prediction. Suppose we have
(Initialize): Initialize 
(E-Step): For each censored observations 

(M-Step): Re-calculate 

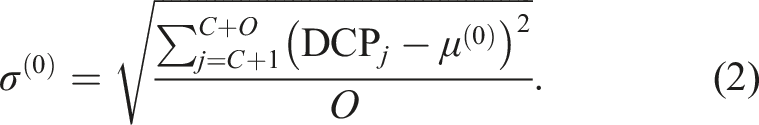
(Convergence test): IF For each DCP of each flight, after detruncation for each potentially restricted class, we summarized all classes bookings detruncated as the flight aggregation bookings on every DCPs. This paper will predict the final bookings of each flight in testing set by using the adding up bookings of every DCPs and combined it with the characteristics of flight DOW and PMO. In this paper, all the following formulas assume that the flight to be predicted is in
Traditional models for flight demand forecasting
Pick-up model
The traditional model selects historical flight data with the same characteristics in the training set to estimate the model parameters based on the DOW and PMO characteristics of the target flight to be predicted. The pick-up model calculates the average value of the booking increment from 
Linear regression model
The linear regression model defines 


Exponential smoothing model
The exponential smoothing model can be abbreviated as equation (11), and the N rows of observations should be strictly sorted according to the date from small to large, 
SVR model for flight demand forecasting
Support vector machines (SVM) introduce the idea that mapping nonlinear low-dimensional data to high-dimensional space so that we could build a linear model to classify the data. In this way, a linear model can be built on nonlinear data, and this is the main idea of SVR. But different from linear regression model, SVR allows a deviation of no more than
Given a training sample 
Not only make most of the data be represented by this linear formula, but also makes the least amount of data not fall into the gap. Where 

The objective function
Equation (13) is convex quadratic programming problem, its dual problem can be obtained by using Lagrangian relaxation as equation (15).
After solving equation (15)

Substituting Equations (16) and (17) into equation (12), the SVR can be expressed as
Since the SVR model has good modeling ability for nonlinear data, DOW, PMO and all DCPs before the current 
It is difficult to calculate 
Numerical examples
Data set
This paper uses the complete bookings data of 24 round-trip flights in 2018 and 2019 on three representative routes provided by an airline company in China. These routes covered business routes, tourism routes and common routes. Take the flight data from January 2018 to 31 October 2019 as the training set, including 29,363 flights, and the flight data from 1 November 2019 to 31 December 2019 as the testing set, including 2192 flights. The data set contains approximately 10% of incomplete or dirty data. It should be noted that we have selected the data before the COVID-19 epidemic for simulation to test the accuracy of the model under normal conditions.
Performance evaluation index
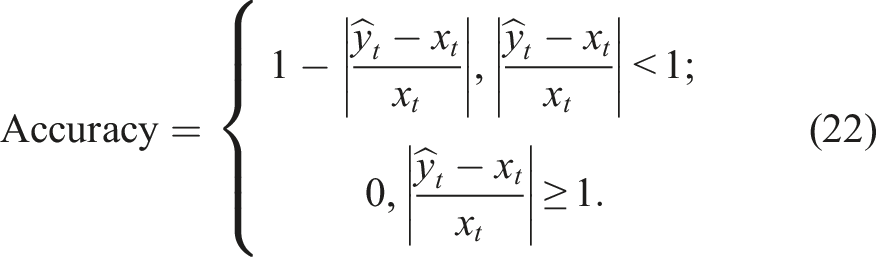
In this paper, RMSE (Root Mean Square Error) and Accuracy are selected to evaluate the prediction effect, as shown in equations (21) and (22). Since the prediction of each DCP is independent, without loss of generality, the formula does not mark the difference of DCP.
Results and discussion
Impact of PMO characteristics
Traditional models accuracy (%) on DOW or DOW + PMO forms.

Advantages of SVR
In this subsection, we test the advantages of SVR over traditional forecasting methods. We use Laplacian kernel in SVR. The research of traditional methods is just like the actual use of airlines, i.e., each prediction is the result with minimum RMSE in parameter learning of selecting pick-up, regression, and smoothing methods. The traditional forecasting method uses DOW + PMO for training subset selection, while SVR does not add any selection on the complete observation set, and does not distinguish between DOW and seasonal characteristics PMO. All characteristics are learned by SVR model itself. The input form of SVR is shown in equation (19). There are eight flights per day for each type of route, and the simulation prediction operation is performed for each DCP of eight flights. The predicted flight date range is 60 days in total.
Comparison table of SVR and traditional methods.

Conclusions
The flight demand forecasting problem has particularly important applications in airline route network planning, flight scheduling, human resource scheduling, and especially revenue management. This paper analyzes the seasonal and DOW characteristics of airline flight bookings and divides flight bookings into peak, medium, and off according to season attributes, combined with DOW attribute, flight demand forecasting is carried out. Different from the traditional models, only the current DCP add up bookings of historical flights and the characteristics of DOW and PMO are used for model parameter learning, we regard the flight demand forecasting problem as a two-dimensional sequence prediction problem, and use the vector composed of historical flight booking data and the add up bookings of each DCP in the early stage of the flight pre-sale period to train the SVR model. Due to the strong adaptive learning ability of SVR model for nonlinear data with large fluctuations, the flight demand forecasting model based on SVR increases the priori information of flight compared with traditional models, to achieve great improvement in both forecasting Accuracy and RMSE. In this paper, the testing data set selects the 2-year data of three types of routes: tourism, business, and general routes of an airline in China that are not affected by COVID-19. This study provides a better choice for flight demand forecasting.
Footnotes
Acknowledgements
We gratefully acknowledge the fund of the Key Laboratory of Artificial Intelligence for Airlines of Civil Aviation Administration of China.
Author contributions
Fan Wei wrote the paper; WU XIANG and Zen Li Shun provided the flight business logic and data support; Shi Xin Yang and Zhang Chong completed the experimental part of the paper; Ip WH and Yung KL reviewed the paper and gave comments on the revisions.
Declaration of conflicting interests
The author(s) declared no potential conflicts of interest with respect to the research, authorship, and/or publication of this article.
Funding
This work was supported by the Key Laboratory of Artificial Intelligence for Airlines of Civil Aviation Administration of China.
Data availability
The data in this paper is derived from real data from a medium-sized airport in China and the data will not be shared and made public.