
Abstract
Online reviews have been found very useful in decision-making. It is important to design and implement accurate systems to analyze the reviews and, based on textual information, predict their ratings. Given the different sources, languages and evaluating systems, intelligent systems are needed to use textual and numerical reviews to better understand the evaluation of the tourist experience and derive useful information to improve the offer. This paper aims to present an eXplainable Artificial Intelligence framework that contributes to the discussion on numerical and textual evaluations of the hospitality experience. It combines sentiment analysis and machine learning to accurately model and explain the evaluation of the tourist experience. The main findings are that review ratings should be used with caution and accompanied by a sentiment evaluation and explainability plays a central role in identifying which are the key concepts of positive or negative ratings, providing invaluable intelligence about the tourist experience.
Introduction
The importance of reviews in consumer decision-making has been widely confirmed by both academic research and practice.1,2,3,4,5 Different aspects have been considered such as valence, volume, variation, perceived usefulness6,7,8 as well as their outcomes such as review-based product rankings, trust in online reviews and management responses to consumer reviews.9,10,11
Research in tourism has highlighted online reviews as a major driver of brand choice and sales, 12 hotel performance, 13 hotel bookings 14 and destination choice. 15 In particular, their effect on guests’ satisfaction 16 has opened the discussion on numerical and textual evaluations of the hospitality experience. 17
Numeric characteristics like the number of stars and the number of words included in a text, have been studied in both decision-making18,19,20 and customer satisfaction research.21,22 However, the scalar ratings do not provide any information on those characteristics that customers like or do not like, while textual reviews display consumers’ preferences and all the nuances of satisfaction, which can be extracted with specific techniques such as opinion mining and sentiment analysis. 23
Previous research24,25,26 used a mixed-method approach to analyze the numeric (ratings) and textual (reviews’ text) information of online reviews to provide a deeper understanding of such a complex phenomenon. Recent studies23,27 have investigated the possibility to design and implement accurate systems to analyze the reviews and, based on textual information, predict their ratings. The variety of sources, the nuances of languages and the different evaluating systems (ratings vs verbalization) call for intelligent systems to use textual and numerical reviews to better understand the evaluation of the tourist experience and derive useful information to improve the offer. The volume, subjectivity, and heterogeneity of social web-data require the adoption of specific methods combining Natural Language Processing (NLP) techniques to tokenize customers’ reviews and carry out a subsequent sentiment analysis.28,29 However, the reliability of these approaches is strongly affected by the reliability of the ratings; in fact, misleading data, i.e. reviews with positive evaluations and negative ratings or vice versa, are common due to psychological meachanisms such as social pressure. 30
Previous research 31 has highlighted the need for a simplification of learning models and an improvement in the speed of analysis of big data. This paper aims to provide a unified framework to analyze the evaluation of the tourist experience and outline its key factors based on both ratings and textual reviews. Specifically, we used a multidisciplinary approach, combining computer science to collect data from an online platform, sentiment analysis to detect the anomalous reviews whose score does not match with the measured sentiment, machine learning to train the classifier and the Shapley paradigm32,33 to explain the decisions taken by the model.
The theoretical contribution of the study is twofold, first, it contributes to the literature on online reviews by clarifying the impact of the combination of numbers and texts to help understanding and predicting tourist preferences. Second, to the best of our knowledge, it is one of the first studies using a cross-validation framework of the forecast model 33 to avoid biased results based on the particular train-test subdivision of the dataset. Moreover, from a methodological point of view, this paper uses sentiment analysis and classical machine learning methods in a fairly simple combination, obtaining results comparable to those achieved with deep learning models, 34 , even though in a binarized-class problem.
The results also offer insights for practitioners and policy makers on how reviews should be analyzed to understand better their customers in order to improve their experiences and what they look for to characterize them.
The remainder of the paper is organized as follows. In the next section the theoretical background is presented analyzing also the different methods, then the proposed framework is discussed outlining the research methodology. Finally, the results of our empirical analysis are presented followed by discussion, future research and limitations.
Theoretical background
Literature has widely investigated the effects of online reviews on tourist experience,35,36,37,38 analyzing both antecedents (i.e., review extremity, length, readability, and sentiment) and consequences (i.e., bookings, product evaluation, higher prices and room sales).
Since the dual rating system (i.e., a star-numeric value and a textual description) is based on travellers’ expectation-experience congruence, 39 the level of matching between experience and expectations, should resonate in the ratings. On the other hand, the textual content describes the individual experience and evaluation in details, which cannot be represented with a single numeric measure like review rating.40,41
The online information overload and the decision-making costs push tourists to rely more on review ratings than textual reviews. 13 While the numeric rating has been studied in terms of valence or absence versus presence on websites,1,42,43 the textual part has been studied with simple definitions and semantic, sentiment and linguistic measures.44,45
The evaluation of the experience, the rating
Rating is the reviewer’s overall, numeric evaluation of the product and actual experience, which reflects the level of satisfaction with the product. 12 It consists often of a scale of 5, ranging from terrible experience to excellent experience (5 stars). As an indicator of travelers’ experience and satisfaction, it represents an important information source to evaluate a hospitality or tourism product in a purchasing decision. 46 Ratings may induce positive judgements about the utility of online reviews, 7 being reviews with extreme ratings (either positive or negative) perceived as more useful and enjoyable than those with moderate ratings.12,47 showed that moderate reviews (3 stars) were considered as uninformative because they contain ambiguous information, while clearly positive (4–5 stars) or negative (1–2 stars) reviews have clear implications for the purchase decision.
Indeed, numerical ratings are popular among consumers because they can easily be processed and can lessen information asimmetry. 48 Recent literature has demonstrated that customers’ ratings influence the information adoption of travelers 49 and their purchase intent; 50 besides, they can improve the performance of restaurants, 51 the sales and prices of hotel rooms. 52 In particular, 8 showed how specific factors like cleanliness have positive impact while others like price a negative one.
The interactive effect among valence, volume and variance has been also widely documented;8,53 however, the level of explicability remains questionable. Therefore, our first research question is,
RQ1 – Does the numerical rating fully explain the experience evaluation?
The verbalization of the experience, the textual review
Feelings play a relevant role in people’s experiences.54,55,56 According to recent studies the way people communicate and how words are used reveal how they perceive reality.57,58 Hence, these communications, the words they use and the way they are used, can unveil deep psychological insights.55,59 The existence of a strong bond between the way we communicate and our feelings is now acknowledged.60,61 Besides, it is also known that our communicating style is usually based on unconscious processes; thus, it can accurately unveil how the message content is related to subjective feelings and perceptions of reality. 62 For example, it has been observed that online consumers tend to adopt an abstract language during the first stages of shopping, the contrary is true for the last stages. 58
Therefore, the varied characteristics of the review text, namely the semantic, sentiment and linguistic characteristics, the review concreteness 63 as well as the length of text have been widely investigated. 2 While semantic features (i.e., words, topics and semantic relationships between linguistic entities) are used to assess information quality, 53 sentiment has been used to to capture consumers’ emotions 64 and their positive or negative orientation. 65
Various frameworks of opinion mining have been used to summarize visitors’ opinions and experiences from reviews according to categories and lexicon-based sentiment.66,67,68 In-depth qualitative analysis and the big data approach have provided additional insights that address a variety of research topics such as popular keywords used, 69 guest satisfaction in restaurants and hotels,22,26 tourist experience of a specific destination or an event ,70,71 and attributes that trigger revisit and referral intentions. 72 However, the combination between verbalization and numbers still needs to be better investigated. Therefore, our second research question is,
RQ 2 – Does the combination of wording and rating represent the real sentiment of the tourist?
The explainability of the travel experience, the Shapley value
The different prediction models used to combine the analysis of textual and numerical reviews7,73,74 have called for different methods to reach the explanability. 75 Explainability assumes a primary importance when examining data characterized by high dimensionality such as the tourists’ online reviews. 76 Among others, the Shapley value has become the basis for several methods that attribute the prediction of a machine-learning model on an input to its base features. 77 Shapley values provide a mathematically fair and unique method to attribute the payoff of a cooperative game to the players of the game. The basic idea is to consider the features as collaborative agents whose goal is to reach a decision about the examined classification task. 78
Previous studies in tourism79,80 have used the TF-IDF model (Term Frequency – Inverse Document Frequency) in association with Shapley values to extract the important features from reviews. However, these studies have found the importance of elements such as room and service quality 80 or being part of a renowned international hotel chain, 79 mostly influenced by the context of investigation. However, in such a dynamic industry with very individual preferences it would be more helpful to directly examine tourist reviews to determine the key aspects explaining tourists’ decisions and ratings without any assumptions on their expectations. Therefore, our third research question is, RQ 3 – What factors are evaluated in the reviews and predict future choices?
Methodology
The main objective of the paper is to provide a unified framework to evaluate the tourist experience and outline the key elements driving it. In September 2020, a web scraper was used to collect the reviews posted on TripAdvisor regarding the hospitality infrastructures in Puglia, a very popular tourist destination in the South of Italy. Specifically, we drew a total of 13,399 reviews concerning 974 facilities, posted between May 2004 and June 2020 and related to the summer season.
We draw data from TripAdvisor for three main reasons, (i) among the various tourism-dedicated platforms, it is one of the most accessed with more than 860 millions reviews and 8.7 millions opinions, more than five million registered users who visit the platform 30 million times per month on average; (ii) it deals with heterogeneous facilities and tourism services including accommodations, restaurants, experiences, airlines and cruises; (iii) it includes a numerically-based rating system that allows to develop a supervised model. Given its use and content available, TripAdvisor implies not only high practical significance of the findings but also strong theoretical contributions.
For each entry a text review and six data fields were included, • • • • • •
We considered only reviews in English since they reduce the potential bias of language and NLP tools for the pre-processing (removing stop-words, lemmatisation, stemming) of English texts are well consolidated with respect to other languages. 81
In terms of rating the data are highly unbalanced; more than half of reviews represents an excellent experience (numerical score equal to 5), 27% are given a score equal to 4, 10% are related to a score equal to 3, while less than 10% reviews have a numerical rating of 2 or less. In other terms, considering as positive those reviews having a score greater or equal to 3,7,12,47 the number of positive reviews is much greater than the negative one. Since this rating imbalance is commonly observed in studies dealing with services’ reviews, 1 to obtain reliable results we designed an integrated approach that combined NLP techniques to pre-process the data and perform sentiment analysis, a learning framework to assess to which extent online reviews provide a robust base for an accurate prediction and an explainability analysis of the classification model to highlight the key factors driving the tourist experience.
Data have undergone a thorough cleansing process, given that real-world data contain up to 40% of inconsistent data.
82
To meaningfully tokenize the reviews, the case was changed to lower-case, punctuation and stop words were removed, and data were stemmed.
83
Consistently with previous studies7,12,47 we binarized the ratings so that reviews with rating lower than 3 were considered negative and labeled
We then performed a sentiment analysis of the reviews and compared the users’ ratings with the measured sentiment. Since it is possible to have a mismatch between the rating and the sentiment of a review,84,85 we defined contradictory reviews as those reviews belonging to class 0 (negative-rated) but with a positive sentiment and vice-versa. Therefore, we filtered out 1460 reviews, about 9% of the sample.
The cleaning step is important for our framework’s reliability despite the fact that these reviews represent 9% of the whole dataset. Since our dataset is highly imbalanced (less than 10% of reviews are negative), we undersampled positive reviews to obtain unbiased classification models, that is, we randomly chose a number of positive reviews equal to that of negative ones. Accordingly, we obtained a perfectly balanced dataset containing all the negative reviews and a subsample of positive reviews. Then, we fed this balanced dataset into machine learning algorithms. This approach was repeated 100 times.
After the textual processing analysis, we were able to create the TF-IDF matrix,86,87 in which each element is the product of two factors,
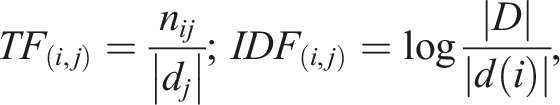
On the one hand, the first factor emphasizes the high frequency of a word within a review; the more cited a word, the more its importance. On the other, the second term penalizes the high frequency in the whole set of reviews since a word used in all reviews would yield poor discrimination and emphasize the role of the rarely occurring terms.
Then, the data fed the Random Forest (RF) algorithm to measure their informative content. 88 We also compared its results with other state-of-the-art classifiers such as the Gaussian Naive Bayes (GNB), the Support Vector Machine (SVM) and the XGBoost (XGB) classifiers89,90,91 to check that the informative content evaluated by the machine learning model was independent from the model used. Appendix A contains a concise but complete description of the functioning of all these algorithms.
Their performance was then evaluated with five distinct metrics: 92
1. Accuracy (acc), defined as the ratio between correctly classified samples and the total number of samples.

2. Sensitivity (sens), also called Recall or True Positive Rate, is the ratio of the positive correctly classified samples.

3. Specificity (spec), also called True Negative Rate, is the ratio of the negative correctly classified samples.

4. Area Under the Curve (AUC) refers to the area under the Receiver Operating Characteristic, a curve whose points are represented in terms of Sensitivity and Specificity. It is a measure of how far a model is from being a random guess.
5. F1-score is defined as the harmonic mean of correctly classified samples.

In order to ensure statistical robustness to our findings, all analyses were carried out 100 times in a 10-fold cross-validation framework.
To explain how the considered models reached a decision with a specific classification score and, therefore, to understand which factors were driving the tourist experience, we adopted the explainability framework based on Shapley values. 93 Accordingly, for each observation we could evaluate how and why the model reached a specific decision. As a consequence, the same feature has a particular Shapley value for all available observations, whose distribution highlighted the level of importance given by the mean absolute Shapley value. We deliberately decided not to perform any feature selection to keep our learning framework as simple as possible. This helped in obtaining an ex post feature importance evaluation that further clarified the key aspects of tourist choices.
Results
First, we found that the reviews were asymmetrically distributed in terms of ratings. The positive ratings (i.e., higher than or equal to 3) outnumbered the negative ones (i.e., less than 3) - the positive accounted for the 91% of the entire dataset. Also, the number of reviews showed a steepen continuous growth, which is commonly observed in studies dealing with services’ reviews. 94 Since the rating distribution is highly skewed in favor of positive reviews and a different threshold for binarization would have not yielded any significant differences, we adopted undersampling to balance the data to avoid any bias of the learning model.95,96
Then, we obtained a 11,848 × 16,898 matrix, with reviewers’ evaluation of their experience as target variable. To set up an effective rating forecast model, we studied emotions expressed in the reviews so that we found not only contradictory reviews, but also the emotions that mostly affected our model’s performances. In fact, the sentiment analysis highlighted four emotions, Happiness, Sadness, Anger and Surprise. The intensity of the emotions showed that the reviews express happiness more than other emotions, thus confirming a positive experience (Figure 1). Indeed, higher-rating reviews are determined by the happiness of the experience they report. Score density distribution of the emotions. Each review was enriched with four continuous scores (one for every emotion) and the scores were normalized.
These results suggest a general correspondence between the numerical rating and the verbalization of the rating (experience). Also, the number of reviews whose ratings did not match with the expressed sentiment confirmed the effect on the classification performance. We evaluated with a RF model that about 80% of the correctly classified positive reviews (TP) have Happiness as the predominant emotion, while the correctly classified negative reviews (TN) have Sadness as the predominant emotion. On the other hand, FP and FN reviews are more balanced in the presence of Happiness and Sadness (Figure 2), suggesting the mismatch between ratings and verbalization. Percentage of emotions in TP, TN, FP, FN reviews determined by the Random Forest model.
Indeed, since TP and TN reviews are more polarized in terms of emotions, the model is able to correctly recognize them in relation to the emotions they express. On the contrary, we found reviews with a predominant happy sentiment in the FN ones as well as reviews with a predominant sad sentiment in the FP ones. These reviews do not express a clear feeling, making the model classify them in a wrong way. Therefore, we decided to exclude them from the analysis. Besides, to ensure that the informative content evaluated by the machine learning model was independent from the model used, we compared the results of RF with other machine learning algorithms. The cross-validation comparison of the models (Figure 3) shows that the RF model resulted the most accurate, although all models reached satisfactory levels of accuracy (Table 1). Performance measures for the machine learning models. Models' performance measures obtained by filtering out contradictory reviews.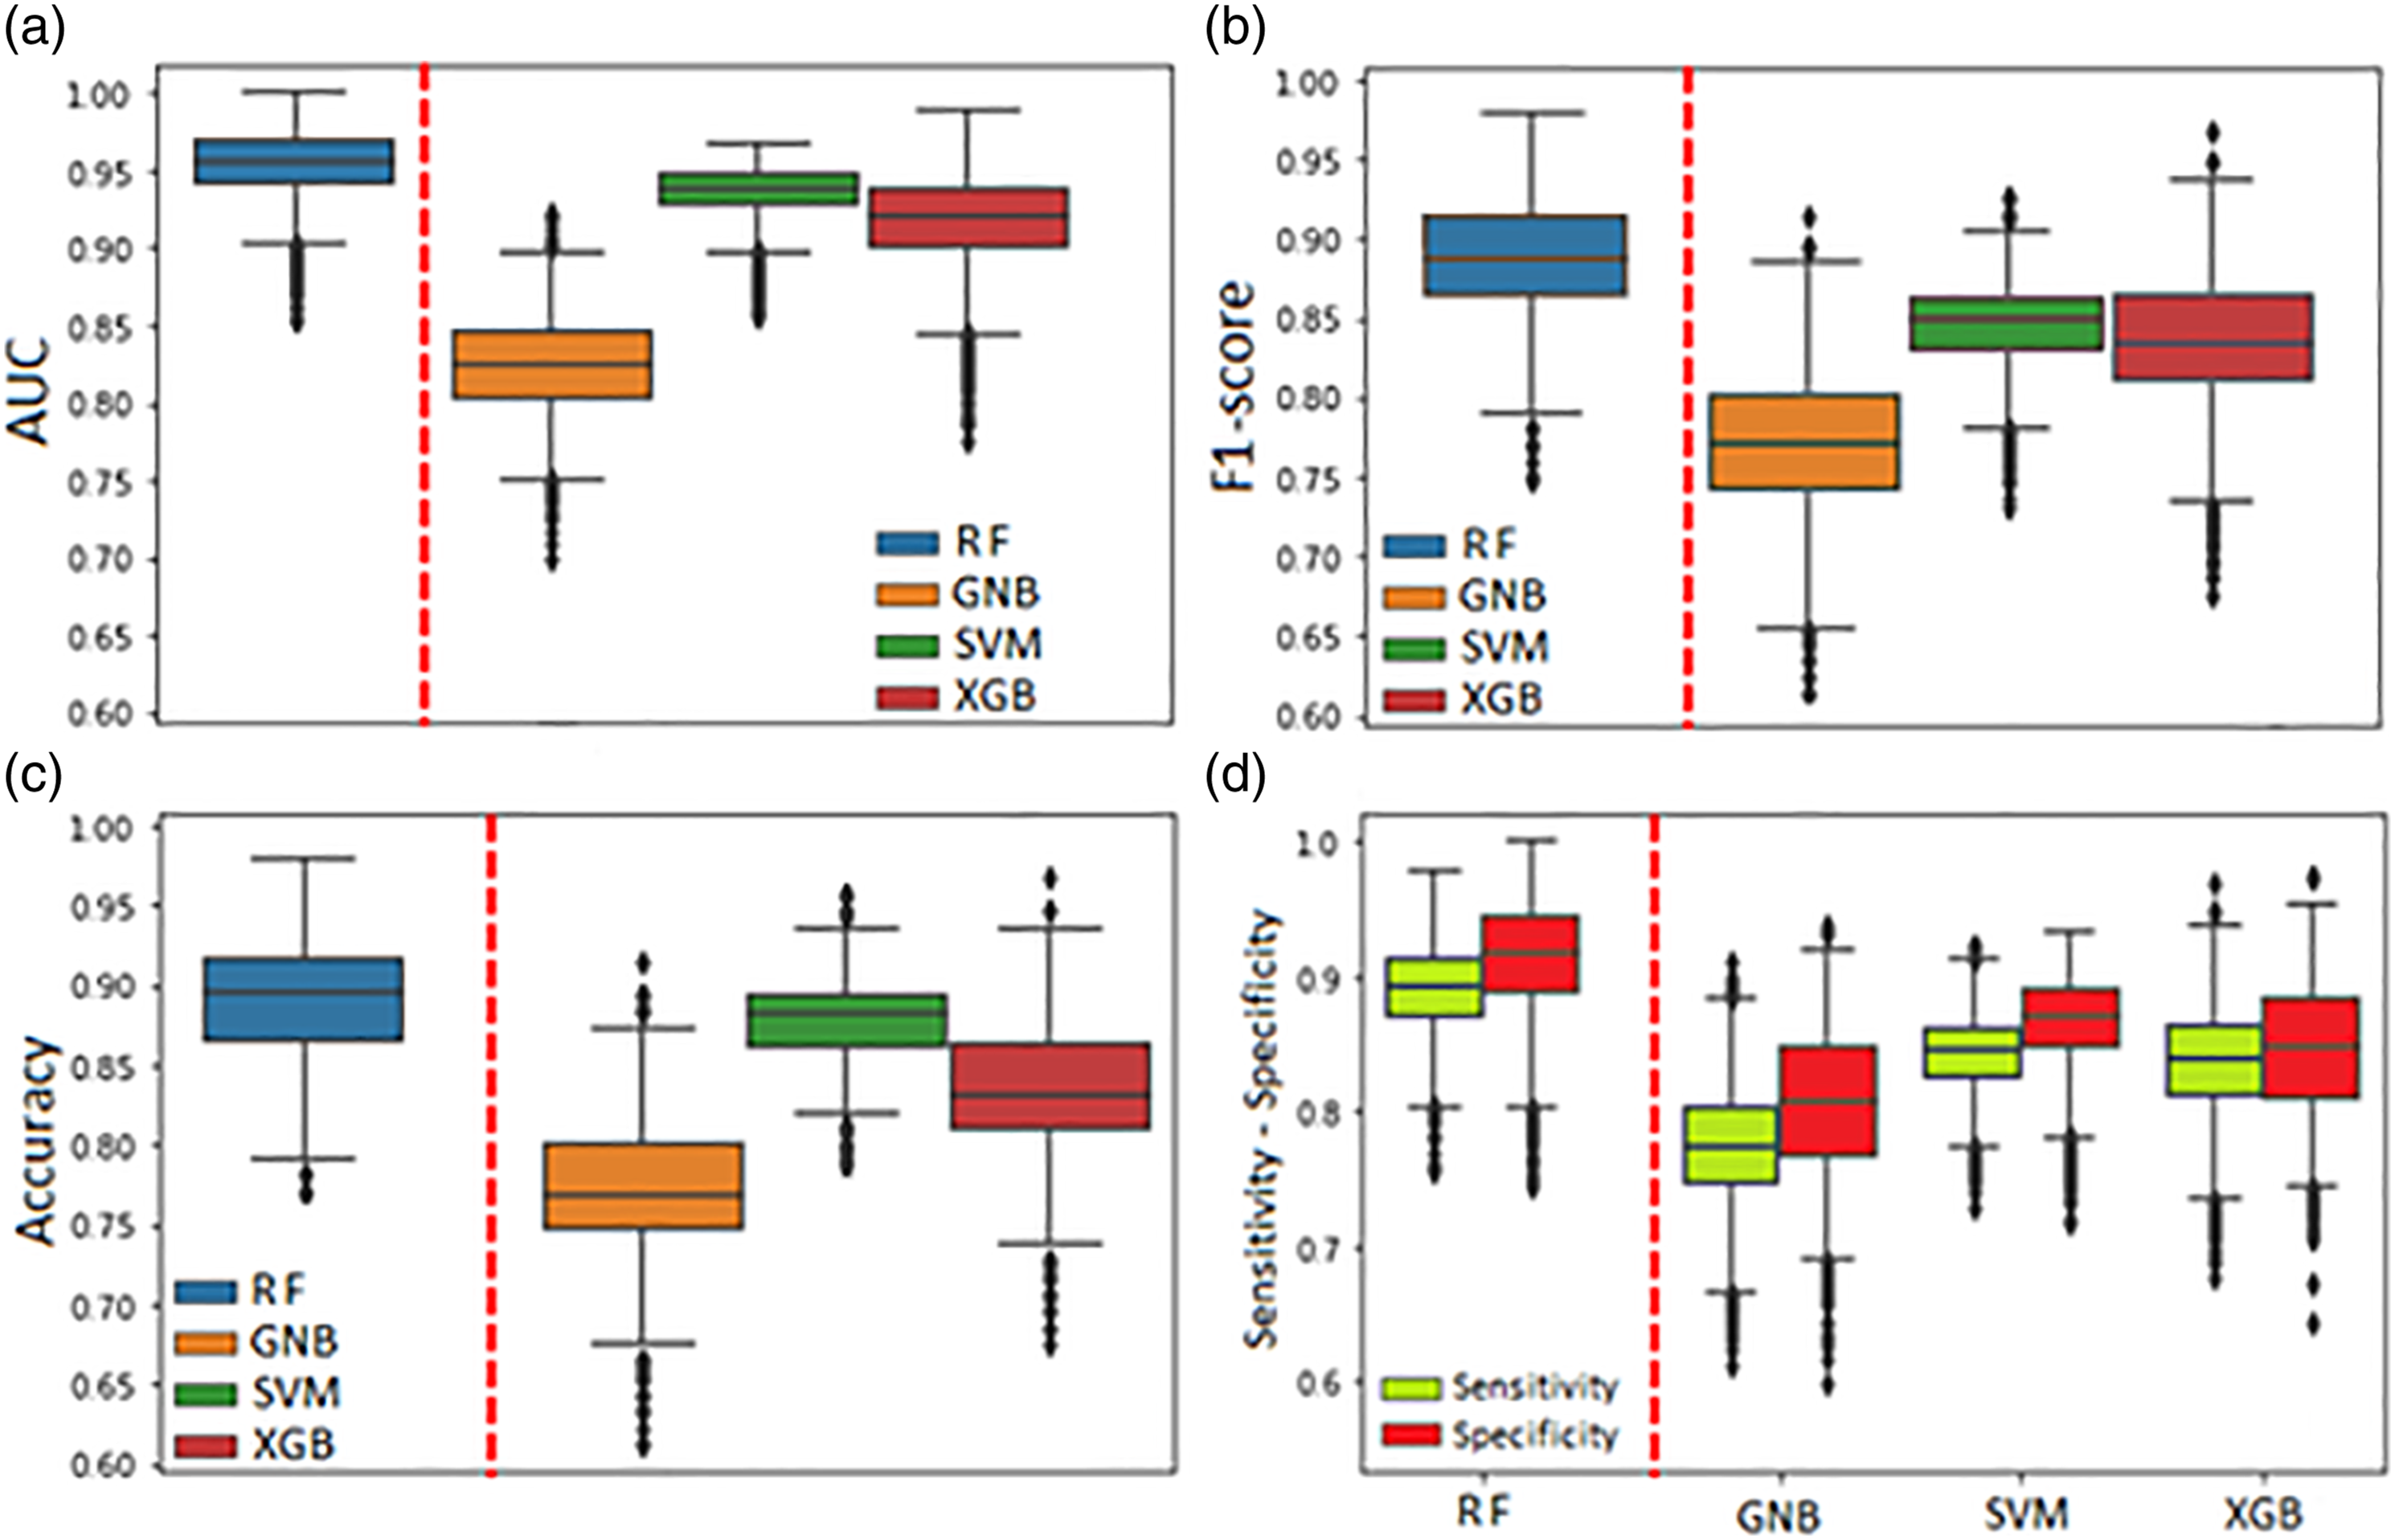
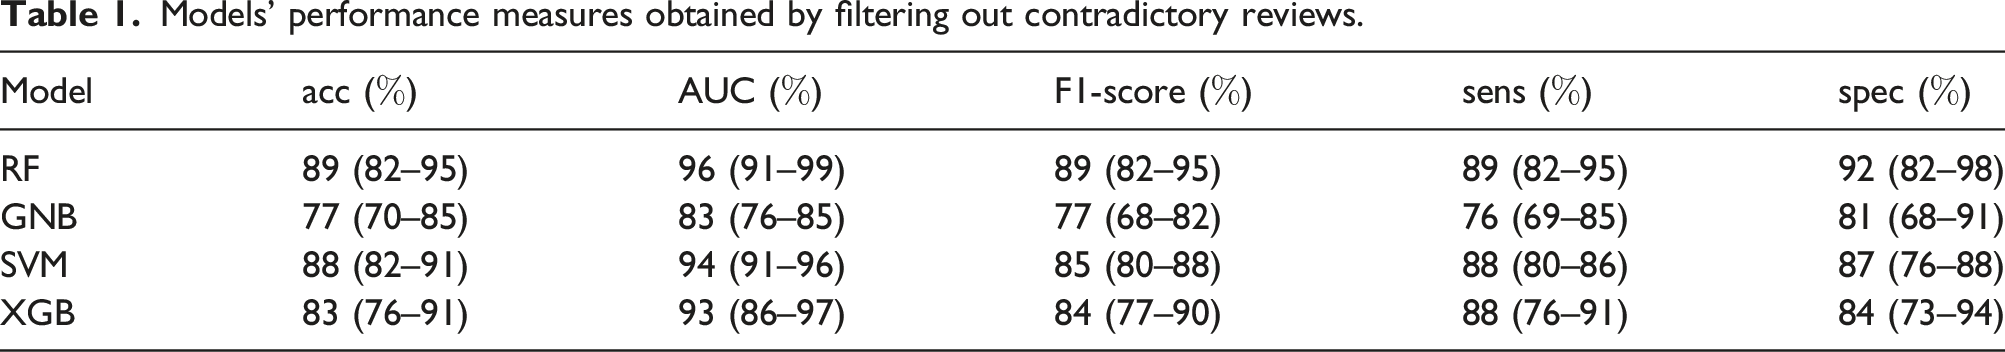
Despite this, RF model scored significantly better than the other models in all the measured metrics, as established using a Mann-Whitney statistical test (p < 0.01) (Table 1).
Models' performance measures obtained by including contradictory reviews.

Therefore, we were able to ensure that this measurement depended only on the informative content provided by the reviews and not from the specific machine learning algorithm adopted.
Finally, to highlight the key factors driving the classification we identified the most important features and their contribution to the classification score based on their intrinsic value through the Shapley values (Figure 4). The Shapley values of the first twenty important words. The contributions towards a positive or a negative review are distinguished according to the frequency a word appears within the text (high/low).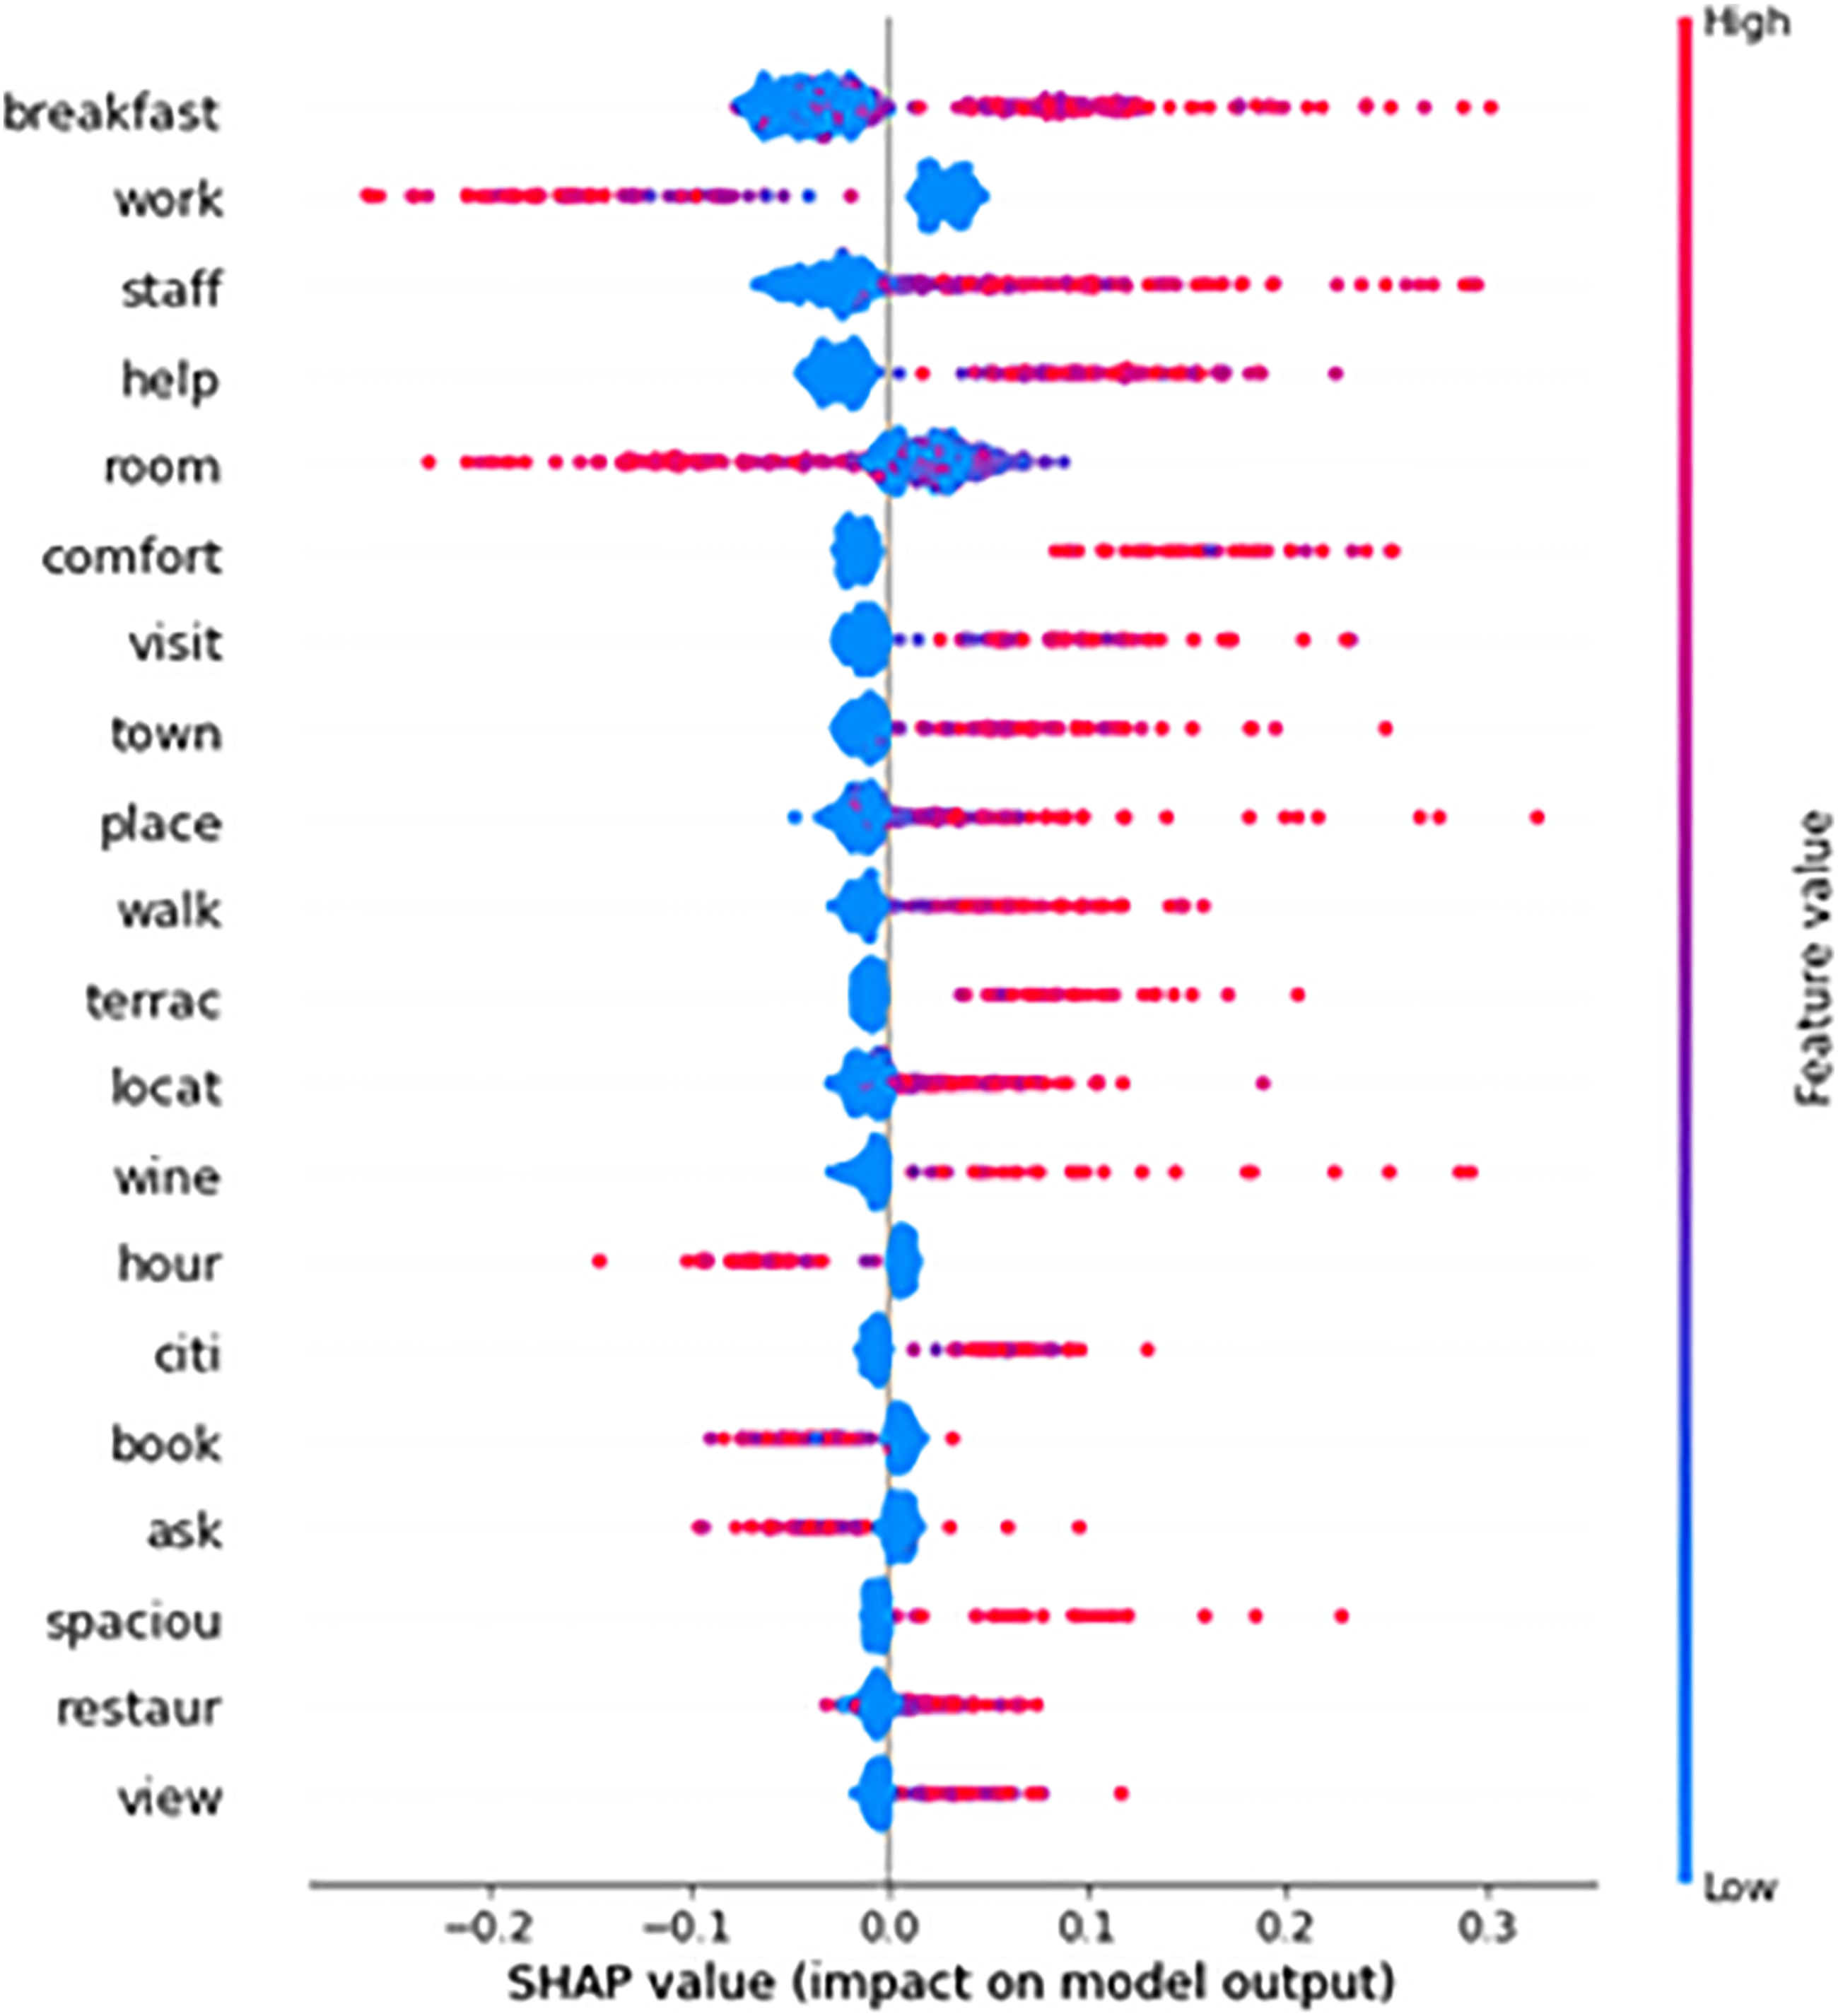
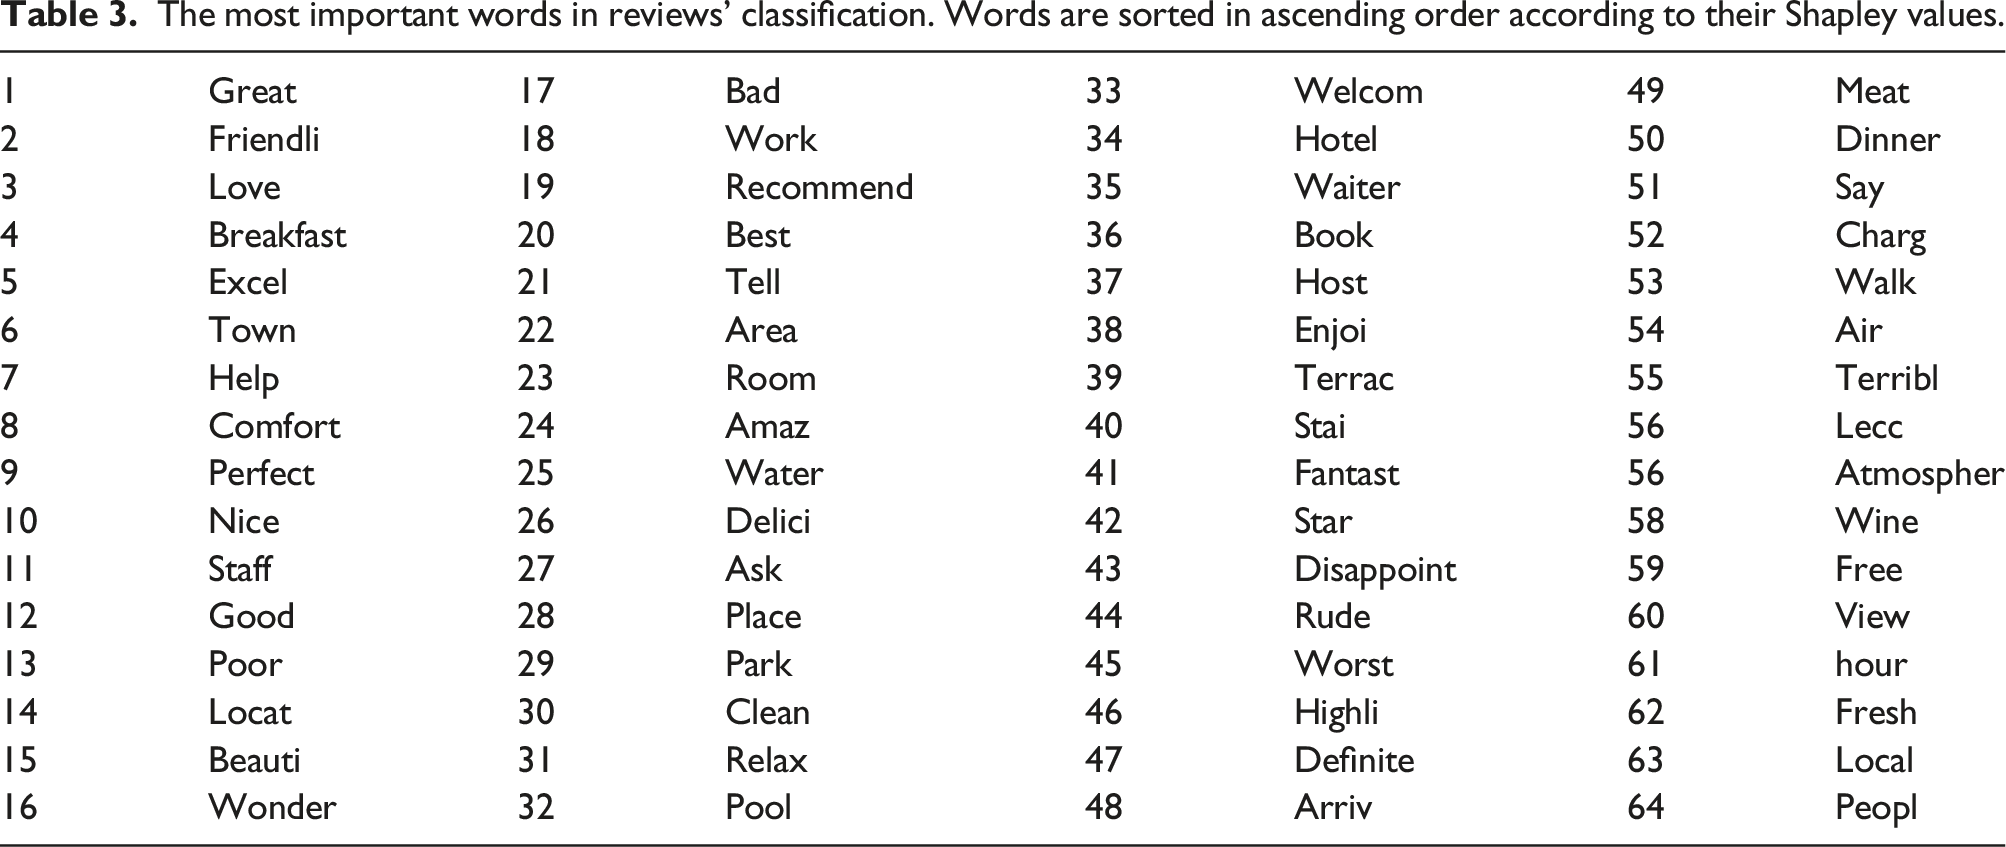
The most important words in reviews' classification. Words are sorted in ascending order according to their Shapley values.
As in the example in Figure 5, the positive review is mainly explained by the words visit, breakfast and quiet, while the negative review show a general unsatisfactory situation, mostly affected by specific factors like breakfast, staff and help. The Shapley values for two correctly classified reviews. Note, On the left a positive-rated review and on the right a negative-rated one.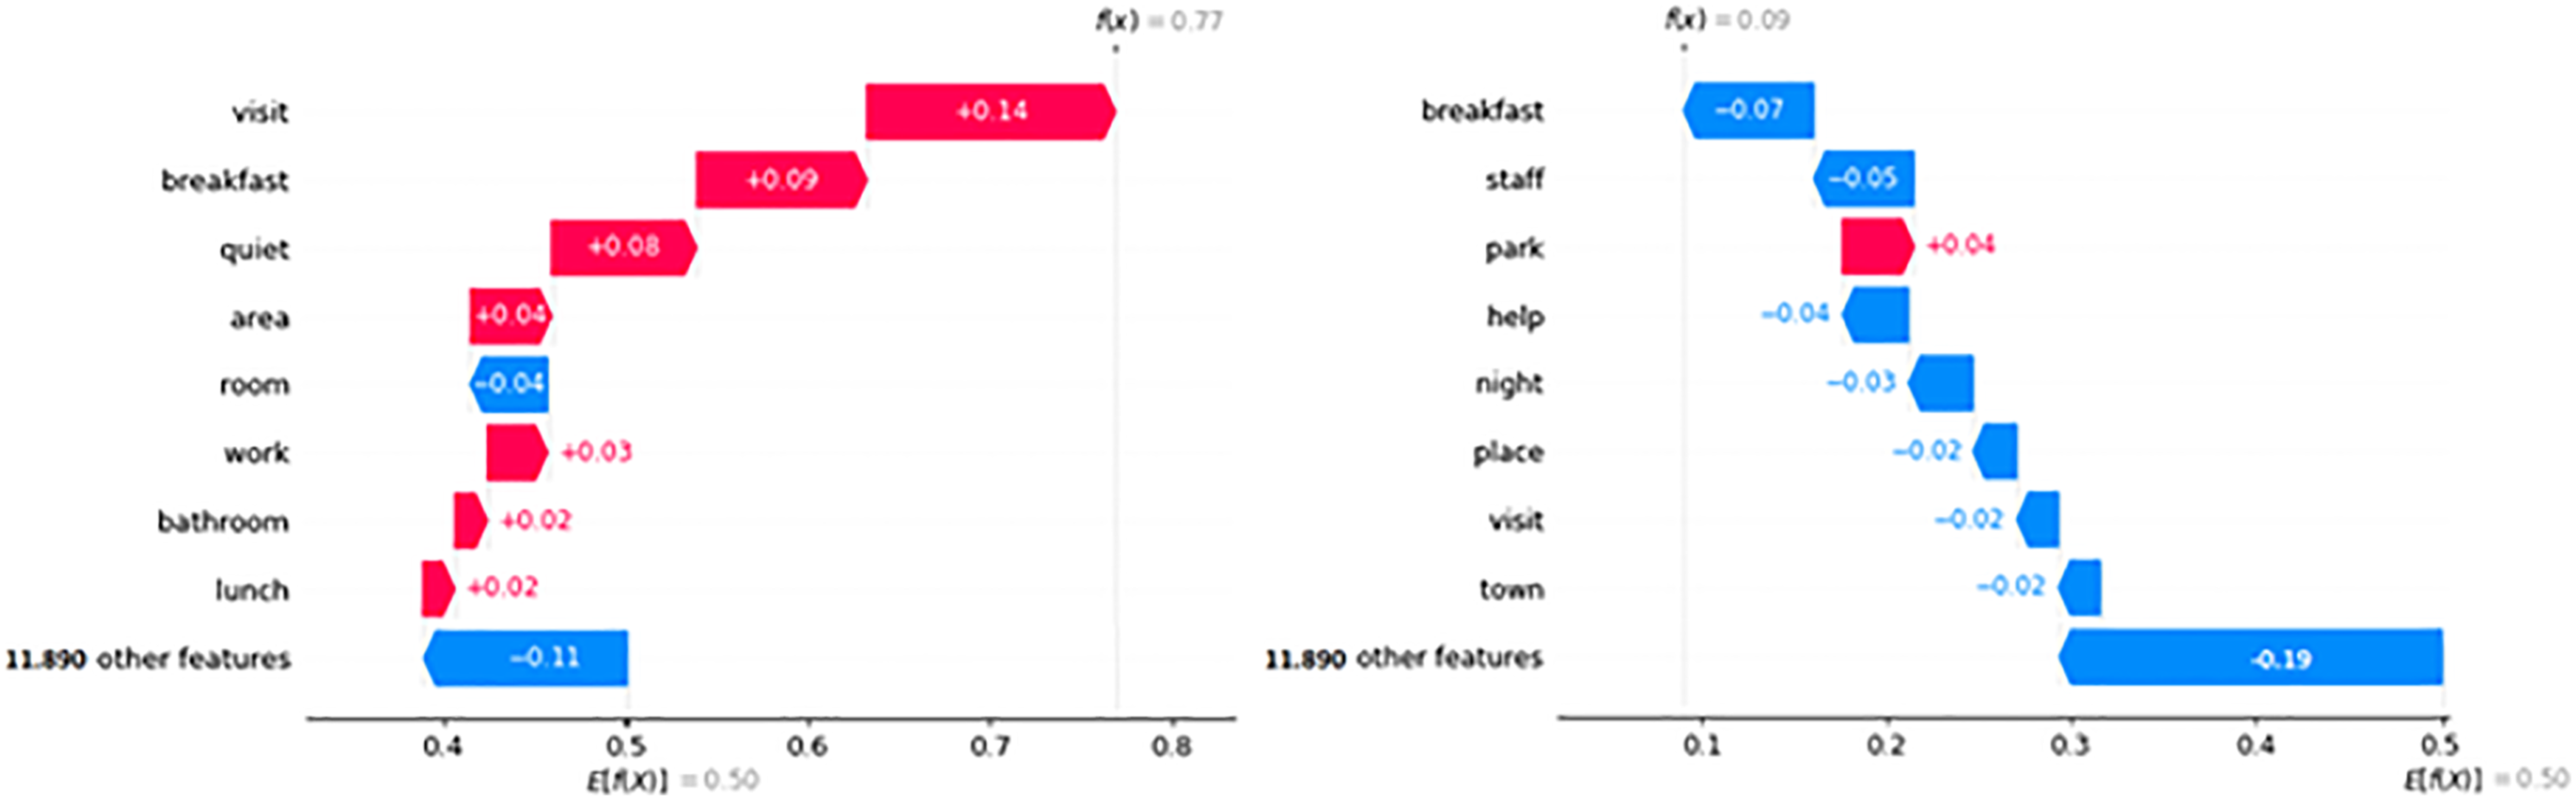
Discussion
The results show a classification framework to evaluate the rating and verbalization of the tourist experience and highlight its determinants to predict future satisfaction from the reviews. The overall pipeline determined by our work consists in the following steps (see Figure 6): (1) A review feeds the Random Forest model; (2) this model accurately predicts its positive/negative rating based on textual data; (3) explainability algorithms (Shapley values) are determined, in order to highlight the most important words influencing the model’s rating. The overall pipeline determined by our work. (1) A review feeds the Random Forest model; (2) this model accurately which predicts its positive/negtive rating based on textual data; (3) explainability algorithms (Shapley values) are determined, in order to highlight the most important words influencing the model’s rating.
Basically, we evaluated to which extent online reviews allow a reliable assessment of the tourists’ experience and their satisfaction. First, we observed the presence of misleading evaluation among the collected reviews; in many cases the numerical assessment did not match the sentiment expressed. Considering how the contradictory reviews are distributed among positive and negative reviews, we observe that 80% of negative reviews are contradictory. Since all the balanced datasets have twice the number of negative reviews and contains all negative reviews, we fed the machine learning algorithms with datasets having at least 40% of error (or noise) level. Previous studies on the sensitivity of machine learning algorithms to noisy data show that models’ accuracy decays almost linearly with the noise level: 40% of error level in data reduces by 30%–40% a model’s accuracy.97,98,99
This contributes to the literature on text mining, 58 highlighting that text can predict future behavior since the word usage and writing styles are indicative of some stable inner traits as well as more transient states, which affect people’s behaviors. The systematic relationship between the words people use and emotional states 100 derives from the human tendency to tell stories and express internal thoughts and emotions through these stories, which are essentially made possible by language. Therefore, even if the content might be similar across different individuals, the manner in which they convey that content differs.
Moreover, text can provide insight into a person’s attitudes toward or relationships with other attitude objects—whether that person liked a hotel room or some services. Consistently with previous studies, we were able to cross-validate different models and evaluate their performance. In particular, we demonstrated that the use of sentiment analysis is fundamental to accurately predict if the tourist is going to assign a positive or negative evaluation just based on the textual review.
Second, in terms of methodology, since the main difficulty involved with using text for predictions is that text can generate several features (words) that are all potential predictors for the outcome of interest, the method used showed that the classification performance was robust independently on the adopted model or the specific considered metrics, despite the higher performance of the RF model compared to the others. Also, we found a strong agreement with the predictions of the other models, especially SVM and XGB; thus implying that the explainability analysis is independent on the particular considered model.
Contrary to previous research, 33 we used a cross-validated framework in order to get more robust results. In fact, our results are independent from the train-test subdivision, thus avoiding biased results and inaccurate conclusions and reaching findings comparable with those obtained using state-of-the-art deep learning methods. 34
In addition, through the Shapley paradigm we explained the RF decisions. On the one hand, the findings underlined that the most important words are related to places, meals and staff, and in particular the word breakfast. This connotates the typical tourist offer and can be explained by both the most common type of hospitality structures, namely bed-and-breakfast, and the connection with food, one of the most importante elements of a tourist experience. On the other hand, the Shapley values also highlighted how feature values affect the classification score. This helps in characterizing the experience and predicting the satisfaction (positive or negative evaluation).
The results have also strong managerial implications in the way the tourist offer can be improved through the creation of personalized services on the basis of the reviews and the features that contribute to living a memorable experience. Understanding the actual behaviors of reviewers through such behavioral-tracking data set can reveal many valuable insights for business improvement and marketing effectiveness. Since consumers’ preferences can be dynamic and expensive to monitor, advances in technology can help not only in reducing the cost of collecting and mining data in an efficient and non-intrusive manner but also in providing more useful information to better target the offerings.
This paper proposes an accurate workflow to examine online reviews and exploit their informative content in order to provide valuable insight to tourism stakeholders and policy-makers guide. For the sake of simplicity, we did not consider possible stratifying variables such as nationality or age. However, it is reasonable to assume that these factors can affect the judgements in that, for example, expectations and needs of a teenager are necessarily different from those of a family with children. Future studies will be devoted to enlarge the examined geographical area and take into account potentially confounding factors, such as age or nationality.
Also, while in this paper we considered an ex post feature importance analysis based on Shapley values, it would be possible to include a feature importance step in the learning phase to reduce the amount of words to consider and simplify the analysis. The design and implementation of dedicated strategies to maximize and exploit the informative content provided by online reviews would deserve further investigations.
Although the main aim of this paper is to analyze tourists’ reviews and give useful insights to tourism stakeholders, the proposed pipeline could be easily implemented in all those fields where textual data are collected/used. By analyzing products and events’ reviews this model helps highlighting those aspects that mostly influence reviewers’ feelings. In fact, the main components of our workflow are: (1) Review scraping, obtained by using packages that are freely available to every programming language development environment. 101 These packages can be used to scrape almost all social media platforms (like Booking.com, Twitter, Facebook, Amazon) and obtain the desired textual information. In this paper we used Python programming language and related packages; (2) NLP techniques and Sentiment Analysis that have reached optimal performances in the analysis of textual data and in extracting useful features describing the meaning of texts. These techniques are all encapsulated in NLTK and SpaCy Python packages; 102 (3) Machine Learning and Explainability algorithms that are widely used in various fields such as wildfire preventions,103,104 medicine,105,106,107 drug discovery. 108 All the machine learning algorithms used in this paper are implemented using the scikit-learn Python package, which is one of the well-known and mostly-used package used in machine learning application and research. 109
Conclusions
On platforms like Trip Advisor tourists ensure a continuous flow of information about their experiences and level of satisfaction. In this paper, we proposed an accurate workflow to examine online reviews and exploit this informative content to provide valuable insight to tourism stakeholders and policy-makers guide. On the one hand, we evaluated to which extent online reviews allow a reliable assessment of the tourists’ experience and their satisfaction. We demonstrated that the use of sentiment analysis is fundamental to accurately predict if the tourist is going to assign a positive or negative evaluation just based on the textual review. Although all the scripts and packages used in our analysis are applied to analyze tourists’ reviews, our pipeline can be used as it is in various contexts, simply changing the scraping package: for example, products’ reviews (e.g., analysis of Amazon reviews) or Twitter events logs can be obtained. Accordingly, our pipeline has the potential of being proposed as a general framework to be used to extract useful insights from textual data.
Footnotes
Appendix
Acknowledgements
Research and results presented in this paper have been realized as part of the project “C-BAS - Customer Behaviour Analysis System”, funded by POR PUGLIA FESR 2014-2020.
Declaration of conflicting interests
The author(s) declared no potential conflicts of interest with respect to the research, authorship, and/or publication of this article.
Funding
The author(s) disclosed receipt of the following financial support for the research, authorship, and/or publication of this article: Regione Puglia; C-BAS - POR PUGLIA FESR 2014-2020.