
Abstract
Among Renewable Energy Sources wind and solar energy are the most prominent and favorable substitutes to meet mankind’s future electricity requirements. Typically, these resources are combined in a distribution network to provide local distribution users. The amalgamation of these upgrades into the distribution network may modify the malfunction and network topologies, which may fail due to their pre-set state. Therefore, an advanced and accurate tracking device must continuously monitor topology changes, which is the Phasor Measuring Unit (PMU). This work proposes a new technique based on the Sea Lion Optimization Algorithm to determine the Optimal PMU Placements and its employment positions, i.e. the power structure is completely perceptible. In addition, the cost of system losses can be calculated with or without wind energy to achieve energy reserves. The energy losses before and after the wind turbine connection is compared to realize energy reserves. This comparison of energy reserves is made using Realistic and Stochastic platforms. Comparison and proposed formulas offered in the IEEE 15, 33, 69, and 85 bus distribution networks were explored to prove their effectiveness. Moreover, the proposed methodology produces more trusted results than those of other methods in the literature.
Keywords
Introduction
Challenges of renewable energy sources assimilation in optimal phasor measuring unit placements
The electricity grid is considered to be the critical, divergent, and abundant man-made active grid. To enhance the proficiency of the electricity supply and lower the operating costs and give users the choice of which electricity provider is needed to deregulate, restructure, and decentralization of the network. It facilitates the bidirectional flow of real power and reactive power in the consumer premises. Hence, the real time monitoring of real and reactive power flow has become a challenging and essential task for ensuring safe, and secure operation.
The modern refurbishment of this grid presents several challenges. • A key stage in the development of sophisticated substructures that can capture the dynamics of the network. • Support multiple applications with diverse needs.
As a result of these meetings, the emerging electricity industries are facing unique challenges, particularly in planning, generation, and operation. Previously, SCADA systems only provided static conditions for the electrical grid. Synchrophasor technology is a success because it makes it possible to synchronize phase data in real-time on the network. The Phasor Measuring Unit (PMU) is part of synchrophasor tools that measure the time-stamped values of frequency (f), voltage (V), and current (I) phasors in the electrical grid.
It measures up to one rate per primary cycle. The main features have made PMUs a powerful and widely deployed observation tool in electric networks.
The second sight of the distribution network is to deliver quality power to the users with the lowest possible cost and eco-friendly.
Renewable Energy Sources (RES) assimilated in the distribution network to carry out the variable demand with decarbonizing effect. When encompassing RES in the distribution system, the operation of the distribution network has become more complex. The penetration of real power from RES is highly uncertain in nature. Hence, network operation in the presence of RES has become vital task. Due to a variation in the active power flow in a renewable system, meaning that the wind does not always blow whenever we want.
Sometimes the sun does not shine due to clouds in the sky, power quality problems like harmonics, frequency and voltage variations, maintaining stability is one of the major challenges in the integrations, storage of RES, protection of equipment, optimal placement of RES, islanding of renewable sources from the distribution system.
The main challenges associated with modeling include high PMU installation costs and expensive communication network requirements, as well as understanding their variability and interaction with other resources.
Consolidated literature survey and the proposed method.

Note: RES: Renewable Energy Sources; OPP: Optimal Phasor Measuring Unit Placements; PMU: Phasor Measuring Unit.
In this work, real -time monitoring of RES integrated distribution network has been focused, and a modern optimization tool has been suggested to install the PMUs at appropriate node to ensure effective monitoring, reliable, and secure network operation.
State of the art models
The placement of PMUs taking into account the minimal count of PMUs necessary to keep the system visible has posed a specific problem during the past three decades. Phasor Measuring Unit places a significant role in the assessment of its state because it has excellent merit of achieving overall system observability, security, and extensive control of electrical systems. The concept of Observable Propagation Depth (OPD) excludes the depth of the bus’s PMU measurements. 1 To represent the OPD of each bus, new rules for the spread of observability were proposed which are valid at the incomplete observable state.
The different metaheuristic algorithms such as Hybrid algorithm of the Genetic Algorithm and Minimum Spanning Trees (MST) 2 method, Mixed Integer Linear programming and Non-Linear Programming, 3 Binary Integer linear programming, 4 Binary Cuckoo Search (BCS) method, 5 Taguchi Binary Bat Algorithm, 6 Exponential Binary Particle Swarm Optimization Algorithm, 7 Modified Greedy Algorithm, 8 Modified Binary Cuckoo optimization, 9 Ant Colony Algorithm (ACO), 10 Best First Search Algorithm 11 are executed for the PMU placement to ensure comprehensive monitoring, the Wide Area Monitoring System data traffic index and the cost installation index.
Furthermore, load loss and repositioning after malfunction featured in conjunction with the relaying functions of the measuring devices in the Optimal PMU Placements (OPP) model. 12 Article 13 provides a comprehensive overview of security plans for renewable integrated power networks, including distribution, transmission, and microgrids.
Conversely 14 presents the infiltration effect of the wind turbine at the distribution level, the proximity of the wind turbine error, and the position of the wind turbine relative to the grid. In addition, A performance analysis of a wind turbine as a distributed generation unit is provided in Ref. 15. Moreover, the implications of integrating large-scale windmills into the distribution network are detailed. 16 The impact of government spending on the performance of various countries' green economies, both developed and developing has been presented in Ref. 17. The article utilizes panel data from the Belt and Road Initiative countries, which spans the years 2008–2018. The data support the claim that research and development spending directly contribute to reductions in carbon dioxide pollution levels in developed countries. With the increasingly intricate interaction between energy and the environment, environmental and socio-economic aspects of energy production have become critical. By examining the mediating role of renewable energy patents, hence 18 intends to establish possible tools for perspectives on energy policy and the environment.
Considering the flexibility, both High Voltage and Low voltage explored the robustness of the model, particularly ZT and DT usage, voltage regulation, power flow, and harmonics in the network.
Moreover, this report solves the probability restricted load flow 19 by changing the optimization, complex to consider random models of wind power generation and demand/supply of electric vehicles. Article20,21 outlines the integration of the wind farms system about the impact on voltage quality and stability of the power system. A perfect PMU placement model for electrically controlled islands, so that the electrical network is observable under controlled island conditions and normal operating conditions.22,23
The issue of placement of PMUs in the distribution is presented in the context of system restructuring.24,25 Voltage Stability Index26,27 to identify the most significant bus for voltage drop in radial distribution systems due to active and reactive power change in the line. Reference 28 proposed a method to identify the line outages in the distribution system using PMU. The GRA-SRA technique was used in Ref. 29 to combine a multi-dimensional and comprehensive set of metrics to create an energy poverty index. It includes a case study using N11 countries and data spanning the years 2001–2017.
Figure 1 depicts an effective PMU placement considering the integration of RES in the IEEE 33 bus system. The green-coloured circle indicates that the node has been deployed by wind energy integration. While the red encircled node indicates that PMU is deployed in that node. So, the PMU required to complete the full system observability in IEEE 33 Bus system is 11 with System Measurement Redundancy index (SMRI) 34. PMU placement with the integration of RES in IEEE 33 bus distribution system. PMU: Phasor Measuring Unit; RES: Renewable Energy Sources.
Research gap and motivation
Much research on the deployment of PMUs in distribution systems have been started, however they have primarily looked at traditional energy sources. This work focuses on locating wind power plants near the distribution systems and determining the best PMU location. For the best of the authors knowledge this is the first time that RES integration with PMU Placements have been done. This research’s fundamental motivation is that is since most distribution systems now produce their electricity, it’s critical to track changes in real-time with great accuracy and speed. The real advantage of using wind energy is it has high efficiency when compared to other forms of energy. By installing PMU, measuring the changes that occur is at ease, and it is facile to reduce energy poverty and emission.
Objectives
The objectives of this work are: i. To find out the effective placement of PMU with lesser number and maximum redundancy index value. Due to the effective placement, the network has been completely observable and subject to the smart grid. ii. The integration of RES into the distribution grid enhances the voltage profile and provides a consistent power supply to utilities. This will avoid the outage of the weak buses. iii. Annual energy reserves are compared using Realistic Load Flow (RLF) and Stochastic Load Flow (SLF) computation. Analyze the 24-h power reserves from the radial distribution system by incorporating wind turbines into practical 24-h wind data. iv. Testing the relation of grid energy reserves for winter and summer. The cost of energy reserves is calculated statistically from the annual total energy losses of the systems. It compares energy reserves achieved based on Realistic and Stochastic platforms. The work was carried out using 24-h data of wind for the winter and summer seasons in the 24-h load curves for both seasons.
Organization
This paper is arranged as follows: Problem formulation illustrates formulation for optimal PMU and assimilation of RES. In Optimization algorithm for solving the OPP and wind model, the proposed Sea Lion Optimization (SLnO) algorithm has been discussed for solving problem formulation. Results and discussion, provides simulation of PMU placement and integration of RES conferred for numerous test systems. Finally, Conclusion wraps up the paper.
Problem formulation
Metaheuristic method based optimal PMU placements
While determining the finest number of PMUs, it is presumed that every PMU has an adequate number of stations for measuring the bus voltage and that all the currents of the incident branch of a particular bus are current phasor. For an ‘n’ bus power system, the placement of the ideal PMU problem is stated as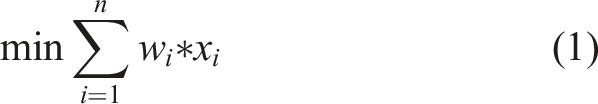
Subjected to


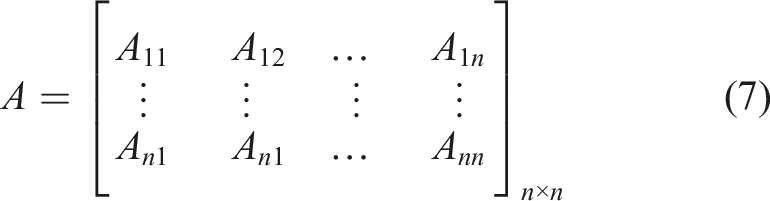
For a system that does not have standard measurement and injections, the PMU placement problem considered as finding the minimum of PMUs such that a bus must reach at least by the set of PMUs. To begin with, A binary connectivity matrix formed. The elements of matrix A defined as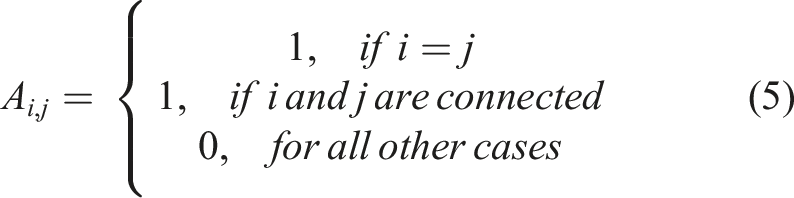


Modelling of wind turbine
The inaccuracy of wind turbine generation at all times are primarily due to changes in wind velocity and air denseness. Since wind speeds often vary, it is an involuntary variable in energy flow computations. This article deals with the Weibull distribution that was used to model wind velocities. It is a two- parameter function that provides a mathematical description of wind velocity.
30

The output power of a windmill is assumed by the following equation
21

Modelling of stochastic load
Load demands are ambiguous and that ambiguity was managed by the stochastic distribution function. The stochastic loads on each bus are incorporated into the load flow studies by showing the load in the form of randomized variables distributed with a variation of an average value. The load data of each bus is presumed to correspond to randomized variables with a Gaussian distribution.
21


The SLF integrated all uncertainty variables into the system using the MCS. 26
Modeling of the stochastic substation voltage
The voltage of the substation can vary immediately as a function of the load changes. This prompt change in sub-station voltage is modelled with a normal distribution function.
25

Energy losses cost
According to the equation given in,
24
the annual cost of energy losses (COSTEL) can be calculated as follows
It can define in terms of load factor (Lf) as
The standard values used in the computations are: 21 Where,Kc = 0.2,Lf = 0.47,KP = 57.6923 $/kW,KE = 0.00,961,538 $/kWh
Energy reserves
Energy reserves/cost savings from energy losses are obtained by
Wind Cost
The operating cost of the wind turbine per hour T (
The values of coefficients used to determine hourly wind energy costs are
19
Optimization algorithm for solving the OPP and wind model
The necessity of metaheuristic optimization algorithm
Metaheuristic optimization mechanisms are well known for solving optimization problems by the reproduction of physical or biological phenomena. They are more common because they are built around modest notions and are easier to implement.
Teaching Learning Optimization, Interior Search Algorithm, League Championship Algorithm, Harmony Search and Colliding Bodies Optimization are the other metaheuristic algorithms that are inspired by human behavior.
Population-based metaheuristic mechanisms share popular characteristics without regard to their nature. There are two key phases of the Exploration and Exploitation research process.
Operators should remain as a part of the optimizer in exploring the global research space. At this time, travels should be selected at random. When the operation phase is to take place after the exploratory phase., its phase should explore in detail the identified research space. In other words, the operation used in the area identified by the survey phase. Any metamorphic mechanism is challenged to balance investigation and functioning due to the nature of the optimization problem.
Sea Lion Optimization Algorithm in Ephemeral
This article proposes a novel naturally enthused metaheuristic optimization algorithm called the SLnO31,32 algorithm to solve the PMU positioning problem model in the distribution network. The SLnO method monitors sea lions' hunting behavior in the wild. Furthermore, the sea lions' whiskers used to find prey attract them.
The main stages in the hunting behavior of sea lions were illustrated in Figure 2 and as follows: • Stalking and hunting with their whiskers. • The Subgroup invites other members to join their subgroup, hunts prey, and moves. • Attack against the target (prey). Hunting behavior of Sea Lions: (A) Chasing, Approaching, and Tracking Prey, (B) Encircling, (C) Stationary Situation and Attack.

In this work proposal, these sealion hunting techniques were mathematically designed. Figure 3 shows the employment flowchart in the OPP, considering the SLnO algorithm. Flowchart for Sea Lion Optimization algorithm for distribution system state estimation.
Pseudo code for SLnO
Algorithm: ( Sea Lion Optimization (SLO) for PMU deployment process). Input: Number of acoustic nodes, number of maximum iterations Begin Initialize the parameters (population size, maximum number of iterations and set of target points) Calculate fitness for each and every node Randomly select any node Calculate the bus observability index Update the position of present node Chose random node end if end if if random node does not nearer to target point Update the position of present node end if end for Update the position of present Node Compute fitness for every Node Update better solution Return Optimal PMU placement
Results and discussion
A simulation study was built on MATLAB 2015a and is performed on a personal computer. It is organized in Intel® Core™ i3-5005U/2 GHz/4 GB RAM and 64-bit operating systems. The PMU deployment was formulated with the SLnO algorithm and tested on different IEEE standard test systems. To validate the effectiveness of the algorithm, OPP was carried out to address the following instances.
Phasor Measuring Unit placement in DSSE by SLnO algorithm.
Energy losses cost with and without wind integration
Energy loses savings for winter and summer conditions. The Various test systems such as IEEE 15, 33, 69, and 85 bus distribution networks have been performed to achieve the above case 1. The IEEE 33 bus system has been executed to solve the cases (2 and 3).
IEEE 15 bus system
This test system consists of two normally open switches and 14 normally closed switches. The total real power and reactive power load on the system is 1126 kW and 1123 kVar respectively. The system is a radial distribution system whose data is given in Ref. 33.
IEEE 33 bus system
This system consists of five normally open switches and 32 normally closed switches. The total real power and reactive power load on the system is 3715 kW and 2300 kVar respectively. The system is a radial distribution system whose data is given in Ref. 33.
IEEE 69 bus system
This system consists of five normally open switches and 68 normally closed switches. The total real power and reactive power load on the system is 3792 kW and 2694 kVar respectively. The system is a radial distribution system whose data is given in Ref. 33.
IEEE 85 bus system
This system consists of 85 nodes and 84 branches. The system operates at 11kv voltages. The base case of a system has 2.5703 MW real and 2.6222 MVAr Reactive Loads. The system is a radial distribution system whose data is given in Ref. 33.
Phasor Measuring Unit placements in DSSE by using SLnO algorithm
Best PMU locations with maximum coverage obtained by SLnO algorithm.

Note: PMU: Phasor Measuring Unit; SLnO: Sea Lion Optimization; SMRI: System Measurement Redundancy Index.
The PMU placement in the IEEE 85 bus system is a maiden attempt and its results were obtained with a minimum number of PMU, the best locations, and high coverage values. In addition, the total PMU channel values also obtained for the all-test systems shown in Table 2 that claimed as part of the uniqueness of the proposed work.
Comparisons of PMU locations and SMRI for various Algorithms.
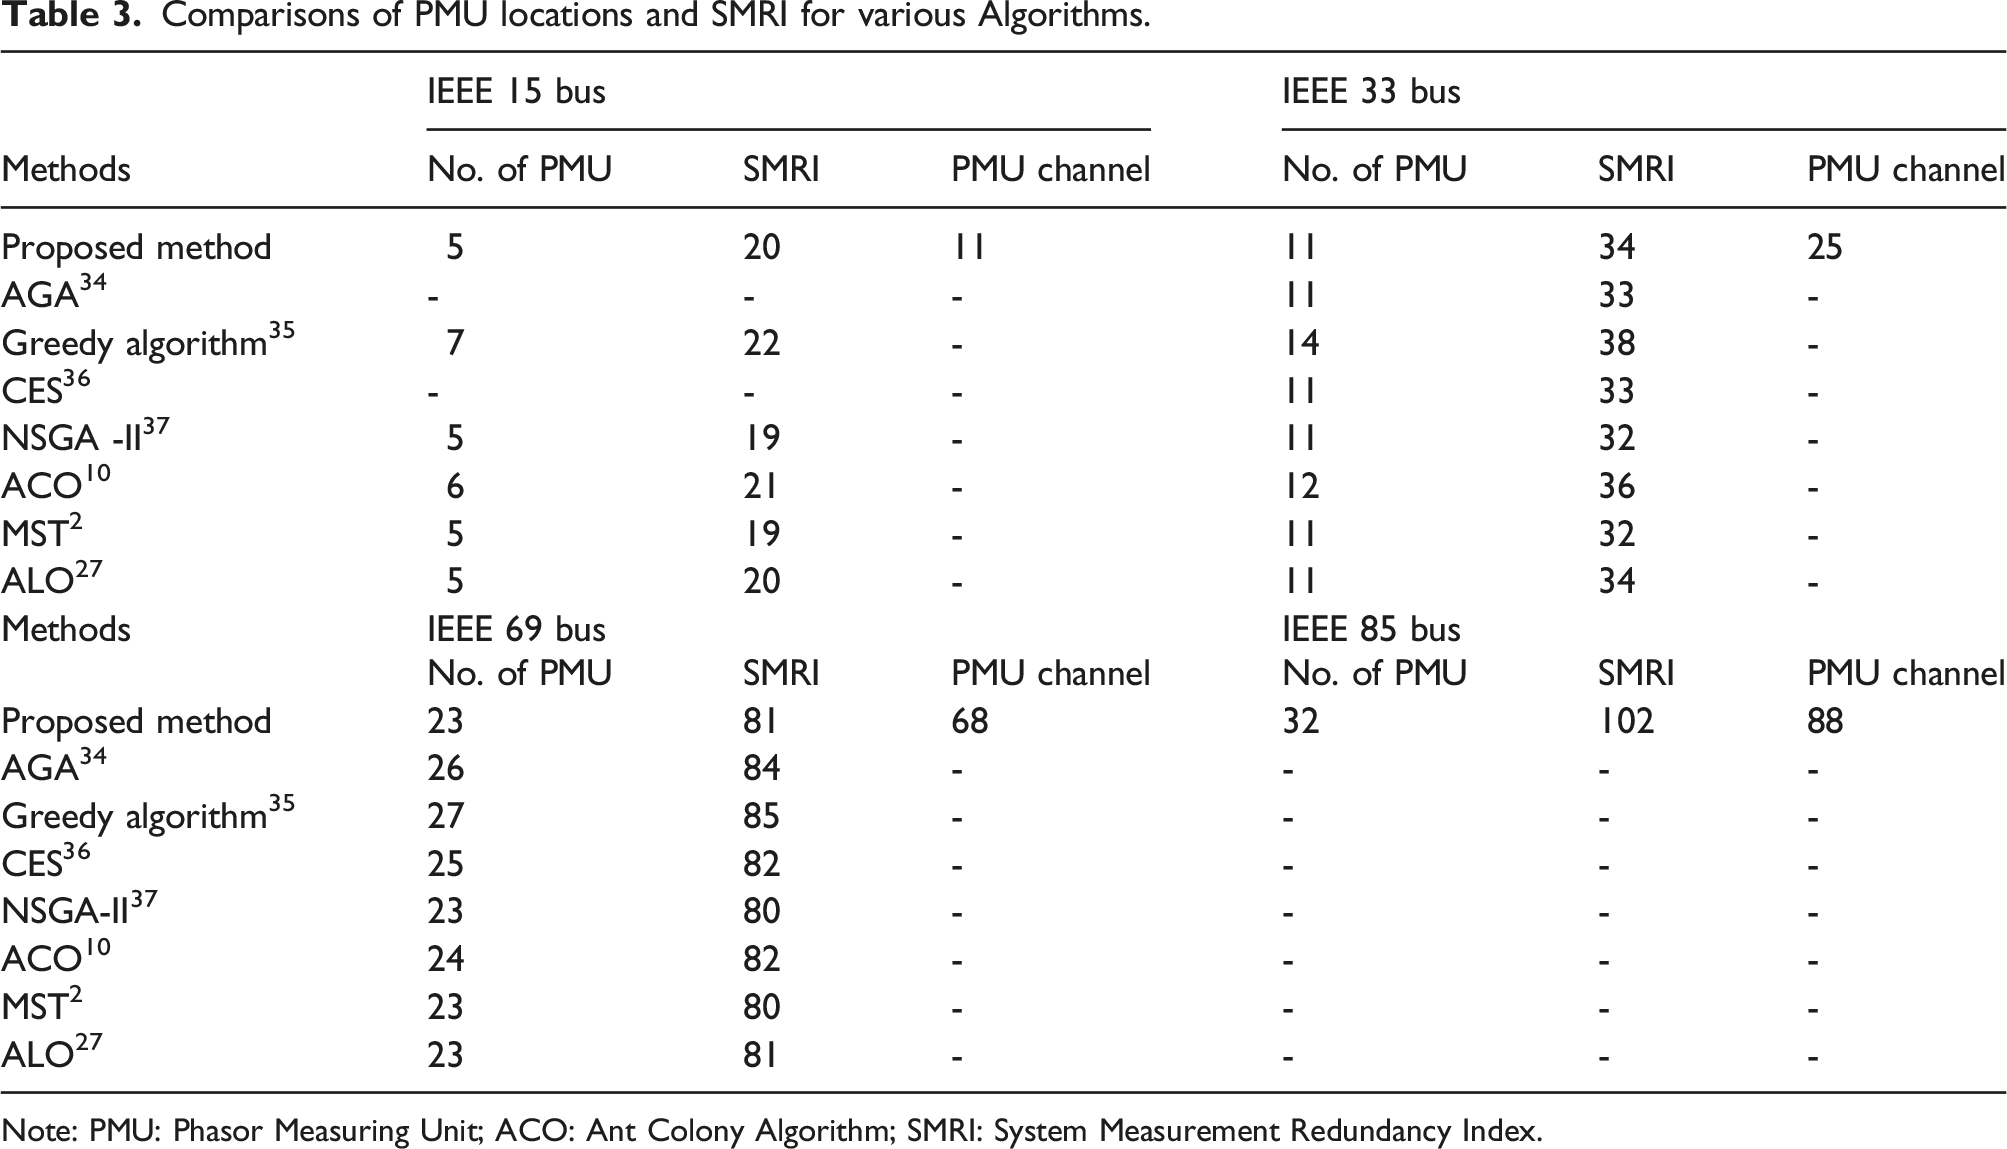
Note: PMU: Phasor Measuring Unit; ACO: Ant Colony Algorithm; SMRI: System Measurement Redundancy Index.
Nevertheless, the coverage values of the existing methods are very low compared to the proposed method. Therefore, the SLnO algorithm affords effective results. Even though, Greedy Algorithm, ACO algorithm achieved high coverage values such as 38, and 36 respectively.
It should not take as optimal because the number of PMUs required in that method is more. Since the proposed method is reduced the number of PMU from 14 (Greedy Algorithm), 12 (ACO) to 11. Hence, the proposed method is delivering better results against existing methods.
Figure 4 shows the comparison of the proposed method performance with other algorithms. From Figure 4 it is clear that SLnO has high SMRI with least PMUs when compared to other algorithms Presented in the literature. Performance of algorithms (a) IEEE 15 bus system, (b) IEEE 33 bus system and (c) IEEE 69 bus system.
Energy losses cost with and without wind integration
The integration of the windmill into the distribution network was carried out in the IEEE 33 bus system. IEEE standard radial distribution system data acquired as defined in Ref. 33,38. The base power of IEEE 33 is 100MVA and the base voltage is 12.66 kV. The cumulative active power load is 3.72 MW with a reactive power load of 2.30MVAR. RLF for the feeder system shall be performed using the forward/reverse load flow method. 25 The exact measurements taken by the PMU and n are compared with the load flow values. Then the error values were downplayed. The windmill selected for this analysis have the following characteristics: Vci = 2.5 m/s, Vr = 13 m/s, Vco = 25 m/s and Pr=0.6 MW. 21 Ten wind turbines are planned to install in the test distribution grid. The 24-h daily datas were used for the two seasons of the year, winter and summer. The average wind speed, the standard deviation for the 24-h data (Cape Comorin, a southern Indian location) are obtained for January and May.
Average and standardized wind speed deviations for the summer, winter seasons are monitored by the PMU indicated in Figure 5. There are approximately 10 wind turbines installed in the distribution network. Initially, the forward/backward load flow were executed for the IEEE 33 bus utility grid. From the load flow result, the voltage magnitude angle, real power, reactive power, losses were obtained. Based on the voltage values, the integration of the wind turbine is implemented. Mean and standard deviations of wind speed – (a) summer and (b) winter.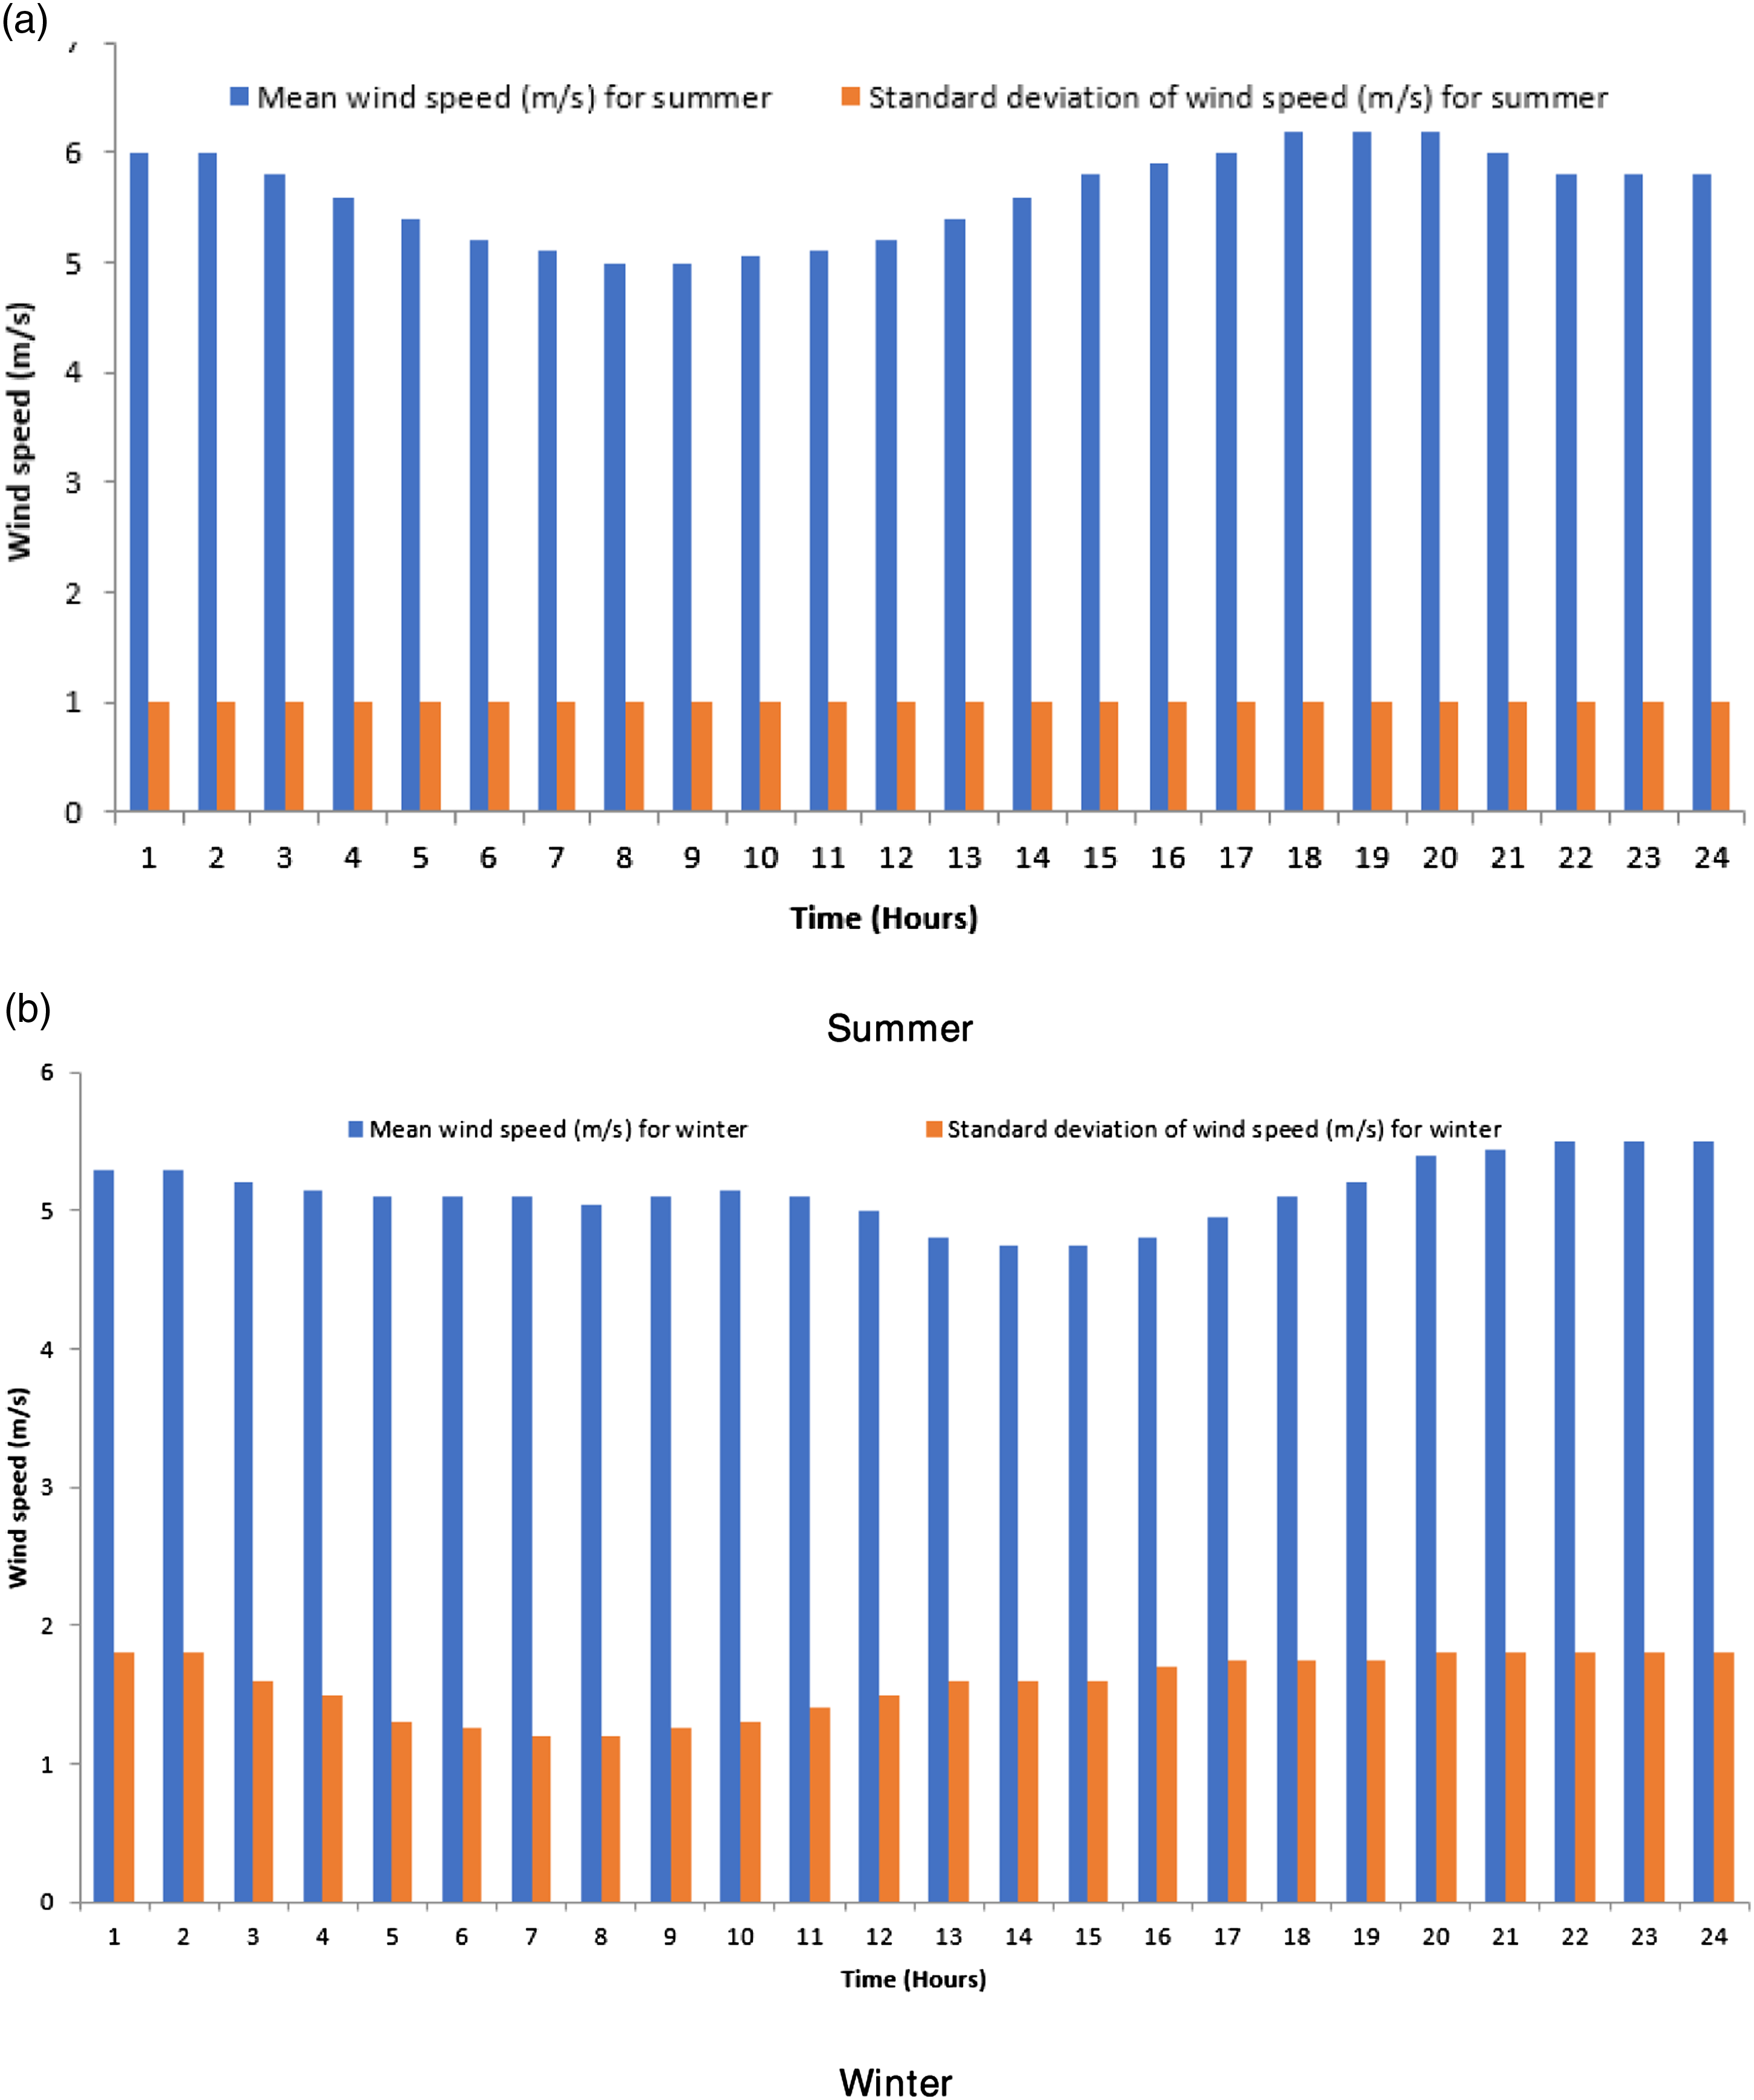
The node 18, 17, 16, 15, 14, 13, 33, 32, 31 and 12 having the minimum voltage values. These nodes are considered the weakest node and they may outage quickly if any fault occurs in the distribution network. Therefore, Wind turbines are placed in these nodes to expand the voltage profile of the particular nodes and their whole system.
Figure 6 clearly shows the system voltage with and without wind turbine. The system voltage is monitored by the PMU very precisely. System Voltage measured by Phasor Measuring Unit.
Energy losses savings for winter and summer conditions
Figure 7 shows the energy losses cost in $ based on RLF and SLF estimates for the summer season and winter seasons of 33 RDS buses. Cost of energy losses ($) of 33 bus RDS – (a) Summer – RLF, (b) Winter – RLF, (c) Summer – SLF, and (d) Winter – SLF.
Figure 8 provides a summary of overall actual power losses or values of TPL that are derived from RLF and SLF measurements for both the season’s summer, winter of 33 RDS bus. It is clear that from Figure 7, the cost of grid energy losses decreases considerably in the midsummer and midwinter following the integration of the windmill. Total real power loss (TPL) for the 33 bus RDS – (a) Summer – RLF, (b) Winter – RLF, (c) Summer – SLF, and (d) Winter – SLF.
Figure 8 demonstrates the lowest cost of energy lost per hour 5, during the summer season without the incorporation of wind turbines. The charge for the minimum hourly cost of energy losses is US$4877 from the RLF and US$4963 from the SLF. Both actual and reactive power losses values are 61.83 kW and 41.86 kVAR respectively.
The minimum bus voltage for that hour is 0.9481p.u. The minimum load for summer energy losses following wind turbine deployment shall also be measured per hour 5.
The minimum cost per hour for energy losses is US$4719 RLF and $4727 SLF. The actual and associated power losses are US$57.77 and US$45.03 respectively. Seasonal energy conservation is depicted in Figure 8. It indicates a substantial difference in energy conservation for the test method during the winter and summer seasons. Peak energy reserves for the summer season were reached at 3 p.m. It is US$5209 based on SLF estimates and US$5209 based on RLF calculations. For the same time, winter electricity reserves total US$4013.38.
The maximum energy reserves for the 10-winter hour reached this value of US$4772 based on SLF calculations and US$4779 based on RLF calculations. Energy reserves for the summer amount to US$4523 per hour. A minimum electricity savings of US$25 were achieved at the time of four for the summer. Minimal energy reserves of the winter at the time of six and benefit for it is US$1065. The minimum energy reserves of the winter outweigh the minimum energy reserves for the summer season. Figure 9 reveals that energy reserves were greater in the winter from 1 to 10 h and in the summer from 11–19 h and 21–24 h. The disparity of wind speed and load patterns influences net conservation of energy. Energy loss savings for summer and winter seasons of 33 bus RDS –(a) Summer-(b) Winter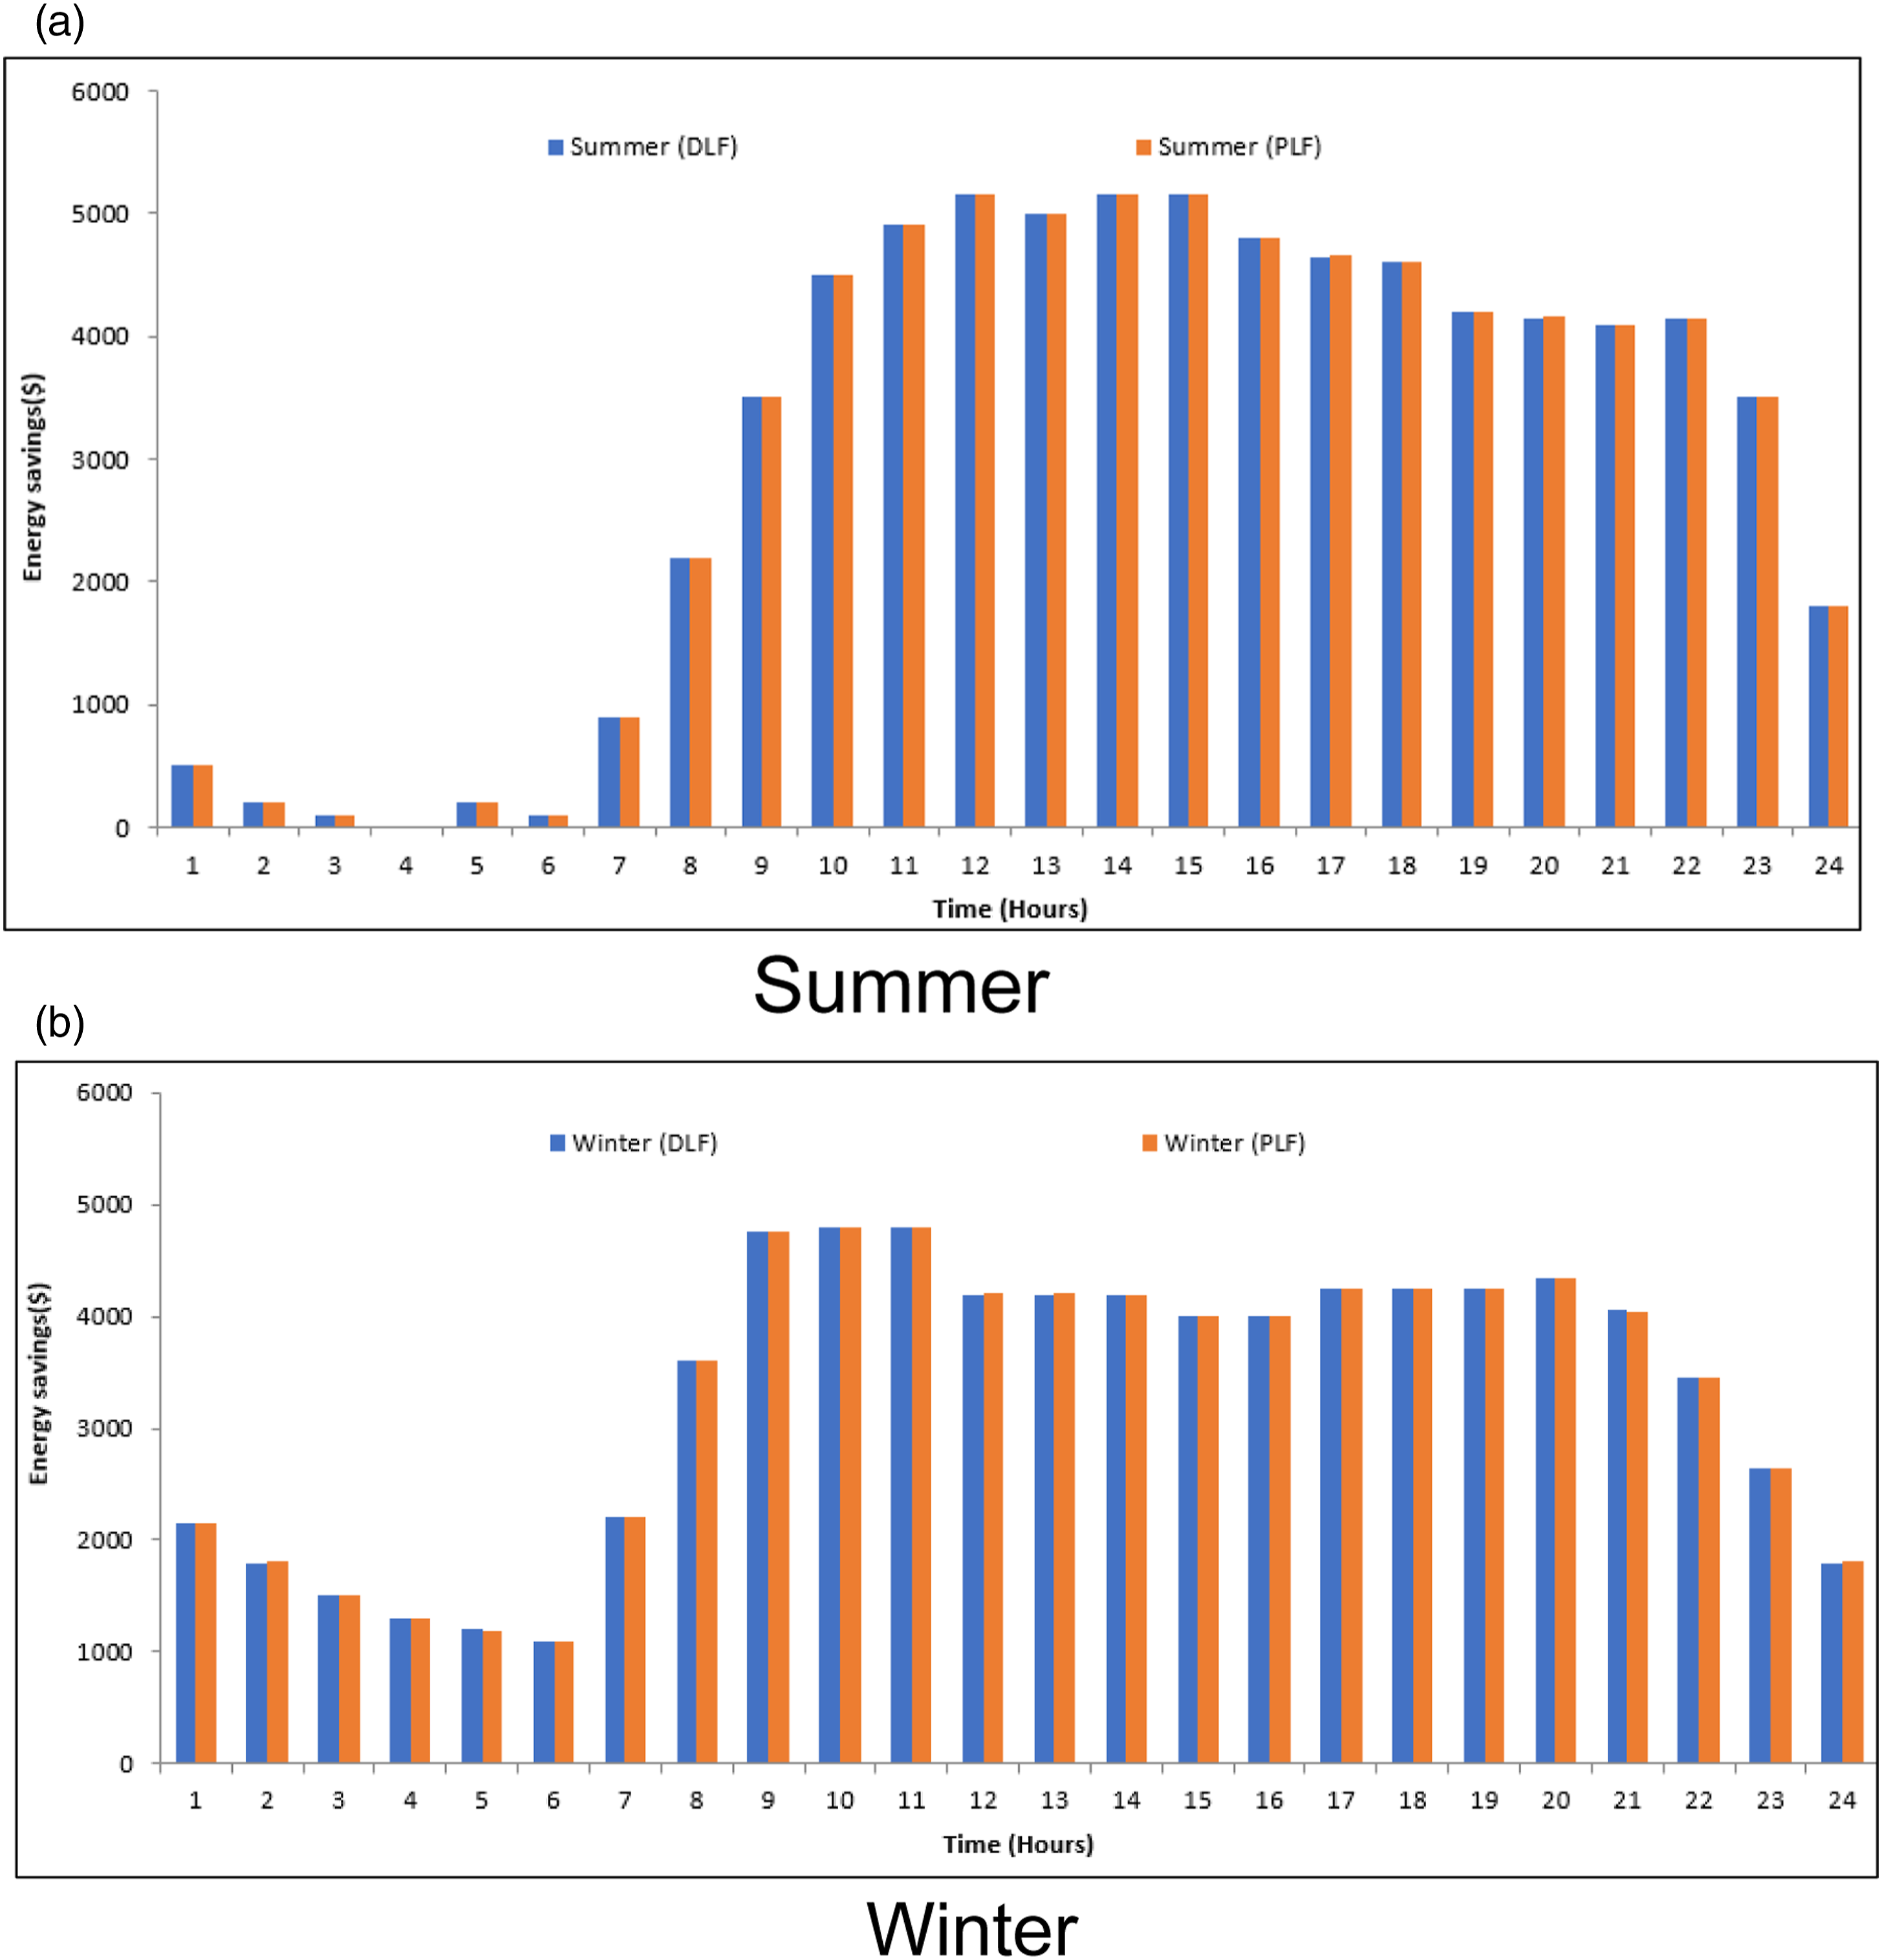
Conclusion
In recent years, improvements to distribution networks have exacerbated the distributed power line problem. This increases the number of PMUs to be monitored and replaces the data with an increased sampling rate. This paper presents a helpful justification for the optimization of PMU placement technique through sea lion optimization. This technique provides perspectives such as optimum locations, maximum visualization, minimum PMU, and total PMU channel. In addition, this article describes the effect of RES integration on the distribution network. Energy reserves of the generation were resolute by computing the cost of grid losses with and without wind generation. Realistic and stochastic methods of energy loss before and after the integration of the wind turbine as regards the achievement of energy reserves. A demonstration of the proposed technique was conducted for standardized distribution systems. Based on the results, SLnO is proved as a promising tool for solving such a kind of constrained objective optimization problems. As a result, it can conclude that SLnO solution to the precise problem is the best one so far.
Limitations and scope for future research
Considering the fact that the current work provides a significant contribution to existing policy and research. This work only focuses on integrating wind power plants with optimal PMU placement. Hence, future work should be conducted using some other RES.
Societal implication and contribution
The work presented in this paper is useful for practical implementation in the distribution system. The rate of emissions will be lowered by employing green energy. Energy poverty can be reduced when the power flow is properly monitored using PMU.
Supplemental Material
sj-pdf-1-enb-10.1177_18479790221106307 – Supplemental Material for State estimation with trusted phasor measuring unit placements of distribution system involving renewable energy sources
Supplemental Material, sj-pdf-1-enb-10.1177_18479790221106307 for State estimation with trusted phasor measuring unit placements of distribution system involving renewable energy sources by Thamaraiselvi Arivazhagan, Subramanian Srikrishna, Naveenkumar Kaliyan and Ganesan Sivarajan in International Journal of Engineering Business Management
Footnotes
Acknowledgements
The authors would like to thank the Authorities of Annamalai University for their continued guidance and support while carrying out this research work.
Declaration of conflicting interests
The author(s) declared no potential conflicts of interest with respect to the research, authorship, and/or publication of this article.
Funding
The author(s) disclosed receipt of the following financial support for the research, authorship, and/or publication of this article: This work is supported by Tamilnadu State Council of Higher Education (TANSCHE) under the Research Grant Project [RGP/2019-20/AMU/HECP-0033]. The work is executed in the Power System Simulation laboratory of the Department of Electrical Engineering, Annamalai University using MATLAB version 2020 software.
Supplemental Material
Supplemental material for this article is available online.
References
Supplementary Material
Please find the following supplemental material available below.
For Open Access articles published under a Creative Commons License, all supplemental material carries the same license as the article it is associated with.
For non-Open Access articles published, all supplemental material carries a non-exclusive license, and permission requests for re-use of supplemental material or any part of supplemental material shall be sent directly to the copyright owner as specified in the copyright notice associated with the article.