
Abstract
A significant challenge of managing successful engineering projects is to know their status at any time. This paper describes a concept of automated project progress measurement based on data flow models, digital twins, and machine learning (ML) algorithms. The approach integrates information from previous projects by considering historical data using ML algorithms and current unfinished artifacts to determine the degree of completion. The information required to measure the progress of engineering activities is extracted from engineering artifacts and subsequently analyzed and interpreted according to the project’s progress. Data flow models of the engineering process help understand the context of the analyzed artifacts. The use of digital twins makes it possible to connect plan data with actual data during the completion of the engineering project.
Introduction
Knowledge about the current status of engineering projects enables timely statements about their success during their progression. It also enables prompt intervention via control measures in the event of problems. 1 Many previous methods rely on stakeholders’ knowledge represented in collected reports and calculated metrics. 2 The evaluation of the status is thus based on engineers’ subjective assessments who often overestimate their progress. 3 New research and industry approaches, such as digital factory or digital twins, are collecting more and more reliable data that can be used to evaluate the progress of an engineering project. This data and the data flow throughout engineering can help overcome the subjectivity of the assessments and automate the measurement of the project’s progress.
In the following chapter, the problem is described in detail. Firstly, the motivation and the rationale for the need of an objective and an automated solution to measure the progress of the engineering project are explained. Afterward, current methods and key performance indicators (KPI) for project monitoring are presented, followed by the solution sets data flow and digital twins. According to the research gap and research approach, the new concept and method is presented and evaluated through a use case.
Problem statement
Engineering needs to be managed and monitored like any other business process. However, the activities and results from engineering are determined by specific conditions that make evaluation difficult. The heterogeneous activities are derived from transforming an idea into a marketable product. 4 The activities range from design drawings, running simulations, defining product roadmaps, developing company-specific engineering processes with integrated design methods, and even identifying qualification requirements. 1 This diversity makes it challenging to derive a standard assessment procedure for engineering.
An online survey was performed to examine the current status of project progress measurement in the industry. Two hundred nine participants from the machine and plant industry, the automotive industry, aerospace technology, and others participated. Surprisingly, although 65% of the participants see their projects as successful in terms of content (76–100%), only 37% completed their projects on time (76–100%). This phenomenon shows that many participants work on the project content beyond the project’s previously set end date. Usually, this time is not considered and thus reduces the profit. An understandable and transparent insight into the actual engineering status helps intervene in time; for 66% of the participants, this is of great importance. The most commonly used methods to present the project status are dependent on the employees’ input and assessments, such as interim reports, discussions, and reviews. 62.5% of the participants see an automated measurement of the project progress as helpful.
State of the art
Monitoring of engineering
A generally applicable procedure for measuring progress in engineering projects does not exist. 1 One of the main challenges is the missing general design method for engineering in practice. 5,6 However, considering engineering on different levels enables the influencing factors to be identified and the process to be controlled and improved. In the engineering processes, the necessary procedures of stakeholders are related to each other. At this level, organizational units’ responsibilities are described, and milestones between process phases are defined. Engineering is usually carried out in projects. In these projects, engineering processes are understood as process models, concrete work packages are derived, and dates are assigned to milestones. In the execution of tasks derived from the project plan, the next detail level is created. 7 Engineering activities are performed during the individual realization of the tasks; these are the actual value-adding actions of the project participants. The person-specific and dynamic instantiation of the engineering processes are activities performed by people. 8
KPIs that can assess engineering progress can be assigned to these levels depending on their required information from process, project, tasks, or activities. 9 KPIs are understood as quantifiable metrics that help to measure the success of critical factors. KPIs have a retrospective view and thus miss the temporally required adjustment along the process. 10 The different levels with their characteristics as well as the assigned KPIs are shown in Figure 1.

Level of engineering and its KPIs according to Lünnemann. 2
The granularity of information increases with each level. The engineering progress can be measured on the engineering process level (A) by the process description and the defined milestones based on achieved milestones and maturity levels. 11 Many approaches in the bibliographical references measure engineering progress with maturity levels. Maturity models represent an object’s current status under investigation through defining different object’s properties. 12 Many maturity models focus on determining the maturity level on fixed gates. Therefore, they look for the existence of required characteristics. 13 A well-known maturity model related to physical objects’ development is the technological readiness level (TRL). 14 Mueller et al. or Pfeifer-Silberbach consider the fulfilled requirements or properties for their definition of maturity level. 11,15 Other maturity models consider multiple indicators such as fulfilled milestones, quality gates, or components. 16 –19 Thus, information about maturity levels is only available to defined gates.
At the engineering project level (B), numerous artifacts are relevant for project management, such as the project plan, the work breakdown structure, and the resource plan. 2 At this level, KPIs measure the project’s success based on the three project success dimensions of effort, time, and quality. 20,21 Examples of KPIs for the dimension of effort are the cost of product development, return on investment, planned vs. actual resources, total project costs, or cost of delay. The dimension of time can be represented by the KPIs project lead time or planned vs. actual time. For the measurement of the quality dimension, KPIs such as planned vs. actual quality, number of changes, or customer satisfaction are used. The combination of the three dimensions is also represented by performing an earned value analysis. 22 However, strict fulfillment of the project plan (i.e., being on time and budget) has little to do with project success. It is essential to meet the stakeholders’ requirements of the project participants and customers. 23 According to de Wit, 21 project success is characterized by meeting the technical product specification and a high level of satisfaction among internal and external project stakeholders. 21 It is interesting to note here that the project level KPIs only indirectly describe progress and thus potential project success. None of the KPIs addresses the actual implementation of the product specification.
The engineering tasks’ level (C) gives information about the specific tasks to complete a work package. The determination of each task’s status leads to evaluating the engineering progress. 11 At the lowest level and with the corresponding high granularity of information, the individual engineering activities (D) are performed and displayed in a sequence diagram. At this level, no suitable KPIs are found in the bibliographical references, although this is where most of the information representing the actual engineering progress is available. The extraction of information or knowledge from this level needs approaches that automatically analyze the artifacts and represent them. Suitable approaches are knowledge discovery in databases (KDD) 24 or machine learning (ML). 25 In a study of trends and challenges in project controlling, García et al. identify some approaches that include ML. However, they highlight the continuing lack of ML integration in project management. 26
Data flow modeling and analysis
The provision, manipulation and transfer of data are termed as data flow within computer science. This term has its origin in the 1970s. It describes the transfer of data between IT systems or network nodes on a formal level. 27 In order to achieve a holistic analysis that integrates data provision to humans within a process, it is necessary to widen the scope. To this end, it is relevant to consider not only data, but also information and knowledge. 28 Data is enriched to information and knowledge 29 and can be provided in the form of a data stream, parameters, and digital models on a formal or an informal level. 30 Several notations from different domains allow the modeling and analysis of data streams or processes. 31,32 Related domains are, in particular, business process and computer science. A general approach is the flowchart, which is applied for IT processes, computer programs, or business processes. 33 For business process modeling, the established business process model and notation (BPMN) 34 or the Ereignisgesteuerte Prozesskette (German for event-driven process-chain) 35 can be applied. Common notations for IT processes that originate in computer science are the standardized program flowcharts 36 and the more recent Nassi-Shneiderman diagram. 37 For modeling of (IT) systems, Petri nets 38 can be applied. Closely connected are the UML-activity diagrams (AD), 39 which differentiate between activities and actions but not between data and material flow. For semantic data or information modeling, IDEFIX 40 can be used. The data flow diagram (DFD) 27 and the holistic, integrated data flow analysis 41 focus on data flow and activities. They differ in the depicted elements, the integration of decisions and variance, and the level of detail.
Especially within engineering activities, the dynamics of knowledge and its manifestation within artifacts are highly relevant. 42,43 Fraunhofer IPK proposed a holistic analysis of data and information flow, focusing on artifacts along the value stream in the engineering environment. 42 Here, especially product-related data and models, such as computer-aided design (CAD)-models or bill of material (BOM), are relevant. These models evolve along the value creation process within the engineering process and result in production plan models and, ultimately, a physically produced product or system. This process’s analysis is the main aim of the data flow analysis developed by the Fraunhofer IPK. 41,44
The methodology comprises an iterative approach, 41 a notation, 7 and a digital tool. 44 The flow of data, information, and models is analyzed along the value stream of engineering activities. Two main elements are considered: engineering activities and the data or information flow between activities.
A value-creating activity is defined, in a narrow sense, as an activity that creates value and is necessary. Here, lean production criteria can be transferred to avoid waste due to too much transportation, inventory, motion, waiting, overproduction, or defects.
45
For each activity, the following aspects are taken into account: Process and organization: the description of the planned way of working on a higher level and the respective organizational structure, such as a team or division. The role within the organizational structure, which is responsible for the execution. The IT-System or tool used within an activity. The artifact (manifestation of data or information) and its format created, changed, enriched, transformed, or consolidated within an activity. The location of the activity to consider geographical restrictions. The data storage location (source and drain). The data flow between these activities.
Every value-creating activity is based on an incoming artifact, manifested as knowledge, information, model, or data. It aims at passing on an enriched artifact. This is defined as data flow within the framework of information-driven engineering. The data flow considers source and drain activity, information content, hierarchy level, other artifacts or parent artifact, data format, transfer details as frequency, or quality of service (QoS) requirements. The notation was also extended to consider decisions with its decision alternatives, solution space, and the decision result. These are linked to activities. 7 The quality of data and models is one critical criterion to analyze engineering processes. The essential criteria are accuracy, relevance, validity, availability, and accessibility. 46 A detailed analysis of the artifacts’ role and maturity in the data flow on different system levels (product, component, sub-component) and different domains (electronic, mechanical, software, services) and their interconnection along with engineering projects has not been conducted so far.
Digital twins
Digital twins (DT) are a technological concept that enables collecting, managing, and analyzing product-individual data in different phases along the lifecycle. 47 –49 The concept originated in the aerospace industry and focused on the simulation of an aircraft’s behavior in mid-air. 48 There are several definitions 50 of DT as their characteristics differ with the application environment. Within this paper, the definition by Stark and Damerau is used: DTs are “a digital representation of an active unique product (real device, object, machine, service, or intangible asset) or unique product-service system that comprises its selected characteristics, properties, conditions, and behaviors by means of models, information, and data within a single or even across multiple lifecycle phases.” 51 Boschert and Rosen describe the DT as a support system for the physical product. 48 Hence, a certain amount of system intelligence needs to be considered within a DT.
Two relevant models to describe DT are the 8-dimension model by Stark and Damerau, 51 which supports defining DTs’ necessary capabilities and the design elements (DE). 52 These elements describe the necessary hardware (DE 1) and software (DE 2) on edge – meaning close to the represented system. In addition, the data repository (DE 3) and the necessary database in the form of the digital master (DE 4) and digital shadow (DE 5) are represented. The digital master (DM) contains relevant data, information, or models from the planning phase. In contrast, the digital shadow (DS) data describes operation data from the production, use, or end of life (EoL) phase. The last DE defines the system’s intelligence and especially the interconnection of the digital master and digital shadow as well as the resulting actions or services (DE 6).
DTs are applied in different phases of the product lifecycle with different aims and content. They evolved from the representation of physical components in aerospace 53 to enhanced simulation capabilities. 54 The most recent applications are in the manufacturing context with a focus on mechatronic and highly complex products. 49,54
More recent research and industrial applications extend the lifecycle perspective toward the product development phase as well as the customer perspective and respective services. 49 The aspect of interconnecting all lifecycle phases and providing feedback for optimization of future products or processes comes to the fore.
Research Gap
As Figure 1 shows, some approaches and KPIs are already on the first three levels (A to C) that indirectly express engineering progress. On the last level, where at the same time most of the information on the engineering status can be found, there are no KPIs. Despite the different activities and their mutual influences, engineering’s performance is often evaluated with indicators based on input variables (such as the number of workers, working hours, resources used, and money spent). This choice of variables is surprising, as no clear correlation between resource use and problem-solving quality has been demonstrated. 1 A resilient project management system 55 is necessary to ensure that delayed projects can be brought back to success under its power. Furthermore, the current state of the art in research and industrial applications does not exhibit a holistic concept for DTs to represent engineering projects. It mainly focuses on products or manufacturing processes. 56 First use cases also consider project simulation. 57 There is a need to apply the DT concept in industrial applications to establish project progress monitoring and optimization.
This research aims at increasing engineering project success by creating new monitoring mechanisms through automated measurement of engineering project progress. This innovative approach differs from existing approaches. The information needed to measure the engineering progress can be automatically obtained from the engineering IT systems’ data and subsequently analyzed and interpreted concerning the project’s progress. This data makes it possible to measure progress more frequently and in greater detail, which increases the project’s success and, thus, the company’s competitiveness.
Research approach
The research approach for the new concept of automated project progress started with an online survey to gather both the requirements and the state of the industry related to project progress measurement. In the following steps, it was observed how documentation and execution of engineering activities take place as well as which methods are available. The gaps between the industry’s requirements and the existing methods were identified and analyzed.
A concept of automated progress measurement and prediction was developed to address this gap. Additionally, it was analyzed how new research approaches like DT and ML can foster the concept’s effectiveness. ML was used to achieve the research goal of project progress automation. This application involved using data from previous projects to identify the process states’ properties and transfer them to the current project. The DT is intended to leverage the potential to link the project’s current data with the corresponding plan data and previous projects’ data.
Digital twin for automated measuring of project progress in engineering
The central idea of the presented concept is the automatic analysis of the relevant engineering artifacts (models and documents) as well as the executed steps of an engineering project (activities) to determine the current engineering progress, predict the future engineering progress and derive optimization measures.
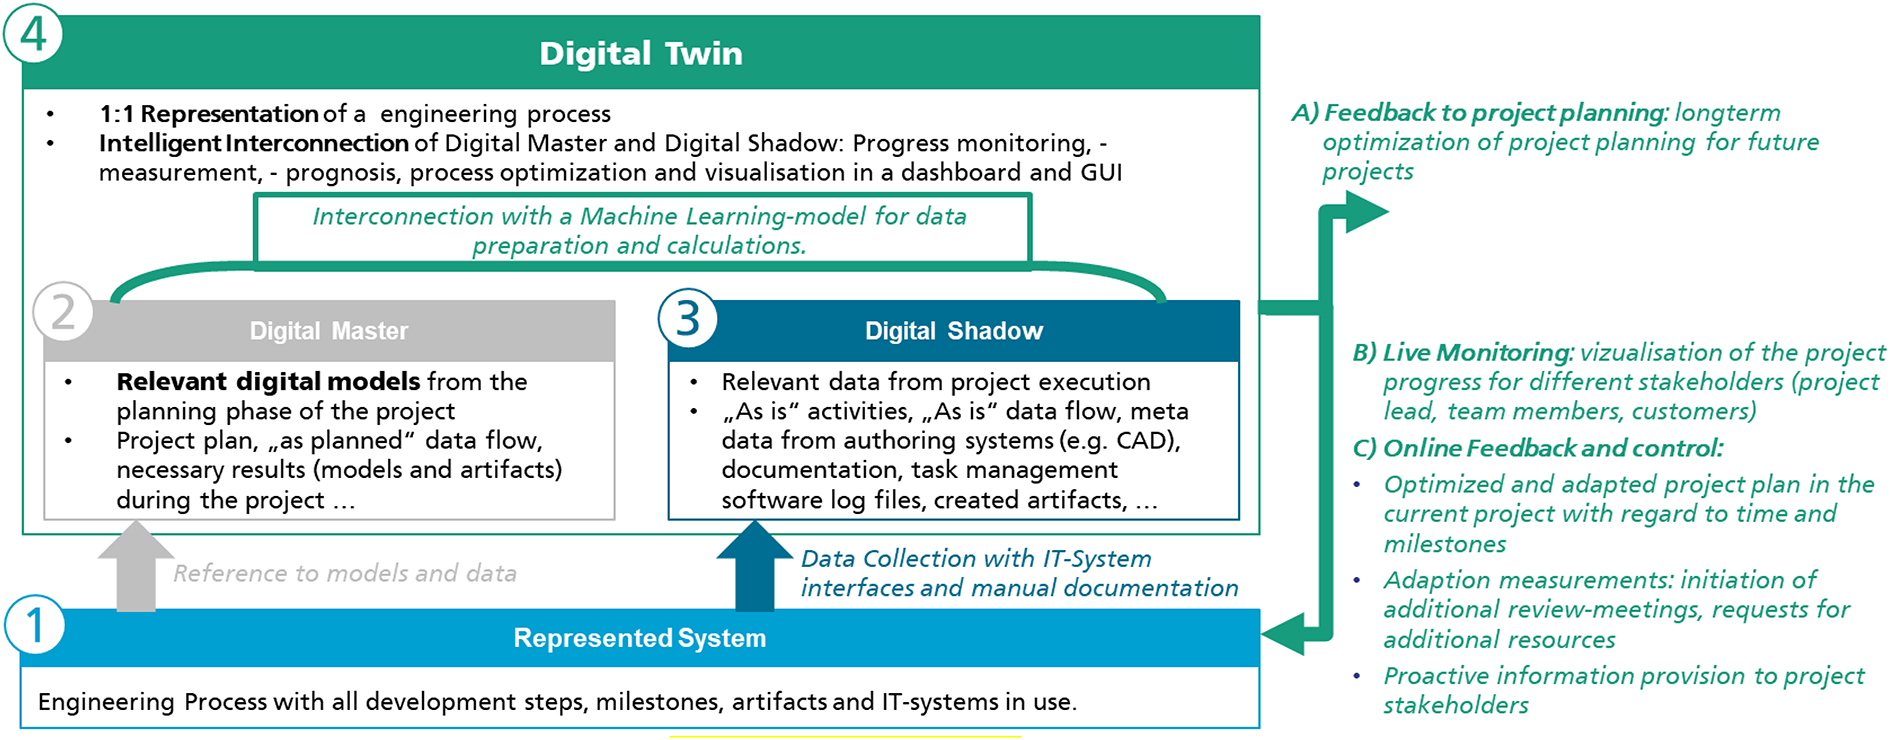
Here, the concept of a DT comes into play. In this context, the DT is a virtual 1:1 representation of an engineering project with all process steps, milestones, artifacts, and used IT systems (see Figure 2). The following subchapters discuss the essential elements of a DT in detail: The represented system (1), the digital master (2), the digital shadow (3), and their intelligent interconnection within the DT (4).
Digital twin framework for process monitoring.
1) Represented system
Engineering is formally described on several levels: with process descriptions, project plans, and specifications of the product to be developed. Many documents, models, part lists are created during an engineering project that describe the product or the system on an increasingly detailed level. The most common artifacts are requirements lists or models, CAD models, parts lists, simulation models (CAE), and many others (digital factory models, DMU models, etc.). Especially in the early phases of engineering, the product is represented virtually before the first physical prototypes are available. Moreover, these artifacts and the used IT systems and tools are usually defined with software architectures, organizational charts, and role descriptions.
The artifacts are created, edited, or used in different activities during the project. Thus, it is relevant for the automated project progress measurement to establish a reasonable database that includes the change history of artifacts, the applied IT systems, the executed roles, and the additional metadata. A suited approach for analyzing these engineering artifacts along the engineering process is the data flow analysis. In addition to modeling the activities and the data flows, this concept also makes it possible to integrate the engineering process perspective. The individual artifacts are traceable along with the data flow, enabling the automated understanding of how many activities are performed with this artifact.
2) Digital master
The digital master (see no. 2 in Figure 2) describes all relevant data, information, and models from the project’s planning phase to define the project’s planned status. In the presented concept, it comprises the models of the process description (e.g., in BPMN), the project plan, the data flow architecture, the IT system architecture, time schedules, and all artifact-specific descriptions, such as the requirements specification book as well as other reference projects and historical data.
3) Digital shadow
The digital shadow (see no. 3 in Figure 2) describes all relevant data, information, and models from the project’s execution to define the as-is status. Here, the data is collected using IT system interfaces but also by manual documentation. The digital shadow data contains the executed activities and the respective data flow, metadata from authoring systems (e.g., CAD), documentation, task management software log files, or created artifacts. In this element, the digitalization degree in a project is crucial for defining the digital shadow elements.
4) Intelligent interconnection in the DT
To evaluate the engineering process’ maturity level, a comparison of the planned project progress and the current project status is necessary. Therefore, DT itself (see no. 4 in Figure 2) includes the intelligent interconnection designed in ML models for project progress measurements with artifacts. The functionality of ML to recognize correlations from data 58 is used here to determine the maturity level. ML models, that use the extracted knowledge from the artifacts to learn the procedure for calculating maturity levels of project progress that the developer did not explicitly program, are developed 25 ; this ensures that no subjectivity is included in the derivation of maturity levels. According to Zhang et al., 55 this approach enables a resilient project management system that improves itself through continuous learning from previous projects and a shared database.
The digital master and digital shadow’s intelligent interconnection for project progress measurement consists of multiple ML models that calculate each artifact’s maturity level. Although the engineering activities are different, repetitive structures exist across development projects. 59 In this case, similarities concerning activities, IT systems, and artifacts, even though the content and requirements change across projects, are found (see Figure 3). Specific, machine-readable indicators of progress within the artifact are used. Based on the artifact-specific indicators, the ML models are also artifact-specific. Consideration of the IT systems used in performing the engineering activities are relevant to these ML models, because the artifact indicators are represented quite differently in several IT systems. This different representation has an impact on the data preparation of the ML models. These indicators are exported from the current project’s artifact and used to calculate the maturity level. ML algorithms enable a company-specific determination of maturity levels by learning on artifacts from previous projects.

Measurement of project progress with artifacts using data flow models.
The data flow model can be used to conclude the activities that have been completed or are still outstanding. If an artifact has a maturity level below 100%, the activities to create or edit this artifact are in progress. If an artifact has a maturity level of 100%, the subsequent activities have started and the artifacts from the subsequent activities are included in the maturity calculation. If the project starts, the first artifact can also be identified by detecting the first activity, and the algorithm for calculating the maturity can be started. After calculating the artifact’s maturity level from the current project, the project’s overall maturity level is calculated.
As a service, the digital twin provides feedback for project planning based on the long-term results. Thereby, project planning is optimized for future projects (see (A) in Figure 2). In the short term, besides live monitoring (B) by visualizing the project’s progress by different stakeholders, the DT also provides online feedback and control (C) for the current project. Different actions are then executed based on the project progress, such as optimization and adaptation of the project plan, adjustment measures, and proactive information provision.
Use case
ML model for a CAD model
Implementing automated maturity level calculation requires an analysis of the artifacts to identify progress indicators. In the implementation of the use case, the focus was on the artifacts that are created digitally. Thus, the selected artifact is the CAD model, which is created in the NX system.
According to Figure 2, the elements for the use case are classified as follows: Represented system: Creation of CAD model as a part of an engineering process; Digital master: Historical, finished CAD models from previous projects; Digital shadow: Current CAD model; Digital twin: Data preparation for CAD model indicators, three ML algorithms (decision tree, random forest, and k-nearest neighbors (kNN)), and live monitoring by visualizing the maturity level of CAD model.
The implementation of the maturity level’s calculation of CAD models is done in two stages. The reason for this is the identified indicators. One indicator is the model history, which records all successively executed design operations. However, this history is only available for the components. For assembly, the indicator is the constraint structure. The constraint structure also successively notes which components were aligned with which constraint. The ML model learns what steps need to be taken to reach a certain maturity level based on previous models for both indicators. In this context, both the number of steps and the type of design operations or constraints are considered. By addressing the type of design operations or constraints, the engineers’ preferences are also reflected.
Due to the different indicators, two different ML models are necessary, but their logic is similar. In both models, the previous CAD models are used to learn the specific combination of design operations or constraints and their maturity level. A table is created in which the individual types of design operations or constraints are marked as features in the ML models. It is essential to learn based on earlier CAD models to know how many design operations or constraints are needed to have a final model. Therefore, the maturity level is calculated as the quotient of performed design operations or constraints to the total number of steps. By this calculation of maturity levels, each step is considered to have a positive meaning to increase maturity. An experienced engineer will probably need fewer steps than a less experienced one, but accordingly, the weighting on each step is higher for the experienced engineer.
Applying the ML model involves checking which design operations or constraints have been performed. The appropriate combination of design operations or constraints is selected. The maturity level from the combination is then taken as the current CAD model’s maturity level.
Additionally, constraints are also checked to determine which components are included in the constraints. The maturity levels of these components are then used and included in calculating the CAD model’s maturity level.
Evaluation
The concept of automated progress measurement for CAD artifacts was evaluated using radial motors as an example (see Figure 4). The digital twin’s technical implementation and the connection between the digital master and the digital shadow were not implemented for the evaluation. Historical (DM) and current artifact (DS) were manually provided for the evaluation.

CAD model of radial motor in NX. 60
The ML model was learned using CAD models for radial motors from the GrabCAD database, where engineers upload their CAD models for public use. 60 One of these models was set aside for the validation of the learned ML model. The other 20 CAD models were prepared according to the constraints’ data preparation process. A table from the exported list of constraints, which records their occurrence frequency, is created in this process. Each row of the table represents an intermediate status of the constraints performed and differs from the row above by precisely one constraint. The exported list is examined by each constraints’ type and is written into the table in chronological order. The maturity level for each intermediate status is calculated as the number of constraints in the row divided by the total number of constraints in the finished model. This procedure is performed for all lists from the 20 CAD models. For the ML model, the various constraints were the input, and the maturity level at each stage was the output. Three ML algorithms (decision tree, random forest, and kNN) were implemented to compare the most suitable algorithm for project progress measurement. These three algorithms make it possible to investigate their internal working and structures, interpret their predictions, and, more importantly, prediction errors.
The validation of the ML models is done with the one CAD model that is also complete. This way, the actual maturity levels are known for each stage. However, only the individual states of constraints’ combination are given to the model. The ML model searches for the most similar constraints combination and takes the corresponding maturity level as the validation CAD model’s maturity level. The maturity level derived from the ML model is compared to each engineering state’s actual maturity level, and the error is determined. Table 1 shows the errors of the validation model.
Errors of the ML model.

The numbers represent percentage units of maturity level. The mean error of random forest (0.154) represents an overestimation of 0.15% of the actual maturity level. The accuracy shows that the respective ML model determines the correct maturity level for the validation model. For decision tree and random forest, the accuracy is above 95%, which indicates a suitable calculation of maturity level from the ML models. The error range is vast compared to the accuracy and the mean error. Outliers can explain this phenomenon in the early and late maturity levels. The data sets measured by the combinations of constraints are small in the early and late maturity levels, and thus, the ML models have little data to learn in this range. Therefore, the ML models overestimate in the early stages of the artifacts. One option to reduce these errors is to integrate domain knowledge into the ML models. The random forest algorithm has a higher accuracy as well as a smaller error range, which speaks for the application of this algorithm in the prediction of maturity levels.
Conclusion and outlook
This paper introduces the fundamental concept of automated information extraction and artifact interpretation. The presented concept of automated project progress measurement in engineering provides a potential for objective estimation and reduces engineers’ effort. The proposed application of digital twins could enable linkage between historical data, planning data, and actual data within project progress monitoring. This interconnection could make it possible to learn from previous project experiences and information, derive the project progress, and set the results in the context of the engineering process.
As a first step, an ML model is developed and tested, located at the core of a digital twin intelligence. The ML model has been evaluated with a CAD model from an engineering project. CAD models, however, are only one artifact of many within an engineering project. The linkage between digital master and digital shadow has not been evaluated and technologically implemented yet for more than the presented ML use case. Still, this use case shows that learning from previous projects and transferring it to the current project is possible with high accuracy.
For future research, the concept needs to be applied to other artifacts, product types, and a broader scope of digital master and shadow data. As a next step, the necessary preconditions for industrial applications need to be analyzed, such as digitalization and data accessibility. Above all, handwritten documentation on paper by engineers must be made analyzable to make all relevant information available. Also, the industrial application requires more research and evaluation to deploy the developed concept. Therefore, IT infrastructure, IT systems, interfaces, and the processes and skills to operate and maintain such a digital twin need to be defined and established. Another research topic is the integration of service development as well as business model implications for external stakeholders.
In a future vision, more and more automated product development projects will be executed. Therefore, such a system needs to be developed with a high awareness of ethical and psychological implications. Then, a digital twin could support product development teams in their creative work by executing automated repetitive work and providing the exact information at the right time, place, and in the proper format.
Footnotes
Acknowledgment
We acknowledge support by the German Research Foundation and the Open Access Publication Fund of TU Berlin.
Declaration of conflicting interests
The author(s) declared no potential conflicts of interest with respect to the research, authorship, and/or publication of this article.
Funding
The author(s) disclosed receipt of the following financial support for the research,authorship, and/or publication of this article: We are supported by the Open Access Publication of TU Berlin for the publication of this article.