
Abstract
Organizational efficiency is considered as one of the important factors affecting the sustainability and viability of an organization and of the larger society that such organizations are part of. Scholars in the interdisciplinary studies of engineering, business, and economics have concluded that the socioeconomic parameters of society are deeply linked with organizational efficiency. Organizational efficiency is generally defined as a measure of the relation between the input resources and output generated within a system. Organizational efficiency in public and private sector enterprises plays a crucial role in ensuring value creation and sustaining the economic and social development of countries. The importance of a sustainable economy and social well-being requires many countries around the world to design and implement tailored pathways to achieve their target of sustainable development, which requires assessing and continuously improving the efficiency of their organizations. Measuring efficiency and implementing periodic course corrections are imperative for maintaining high levels of organizational efficiency. The literature on organizational efficiency measurement is limited and qualitatively inferior, especially when it comes to sustainability considerations and for organizations operating in the Arabian Gulf. The research approach developed in this study to measure efficiency in Qatari organizations is crucial in understanding and improving the transformation journey of Qatari, and similar organizations. This paper focuses on the research approach adopted to measure organizational efficiency based on international best practices and conducts a comparative analysis on the local organizations from a sustainability perspective considering all dimensions of economics, environment and social impacts. The methodology involved in measuring and benchmarking organizational sustainability identifies the “as is” state of organizational sustainability and efficiency in the organization. Identifying the causes of the efficiency gap and improving organizational efficiency from the local perspective are the objectives. The survey result ranked the main areas for improvement within local organizations as 23% Overall organization culture and behavior, 21% Human Resources, 19% Leadership and Governance, 18% Operation, 11% Finances and 8% Quality Assurance.
Introduction
The objective of this research paper is to establish a research approach for organizational efficiency (OE) in Qatari organizations. OE is defined as an organization’s ability to implement its plans by using the smallest possible expenditure of resources to achieve its strategic objectives. 1 OE is also defined as a measure of the relation between the input resources and output generated within a system (Figure 1). OE essentially indicates how well organizations use their resources to generate maximum output with minimum input (resources, energy, manpower, time, and money) and minimum waste. 2
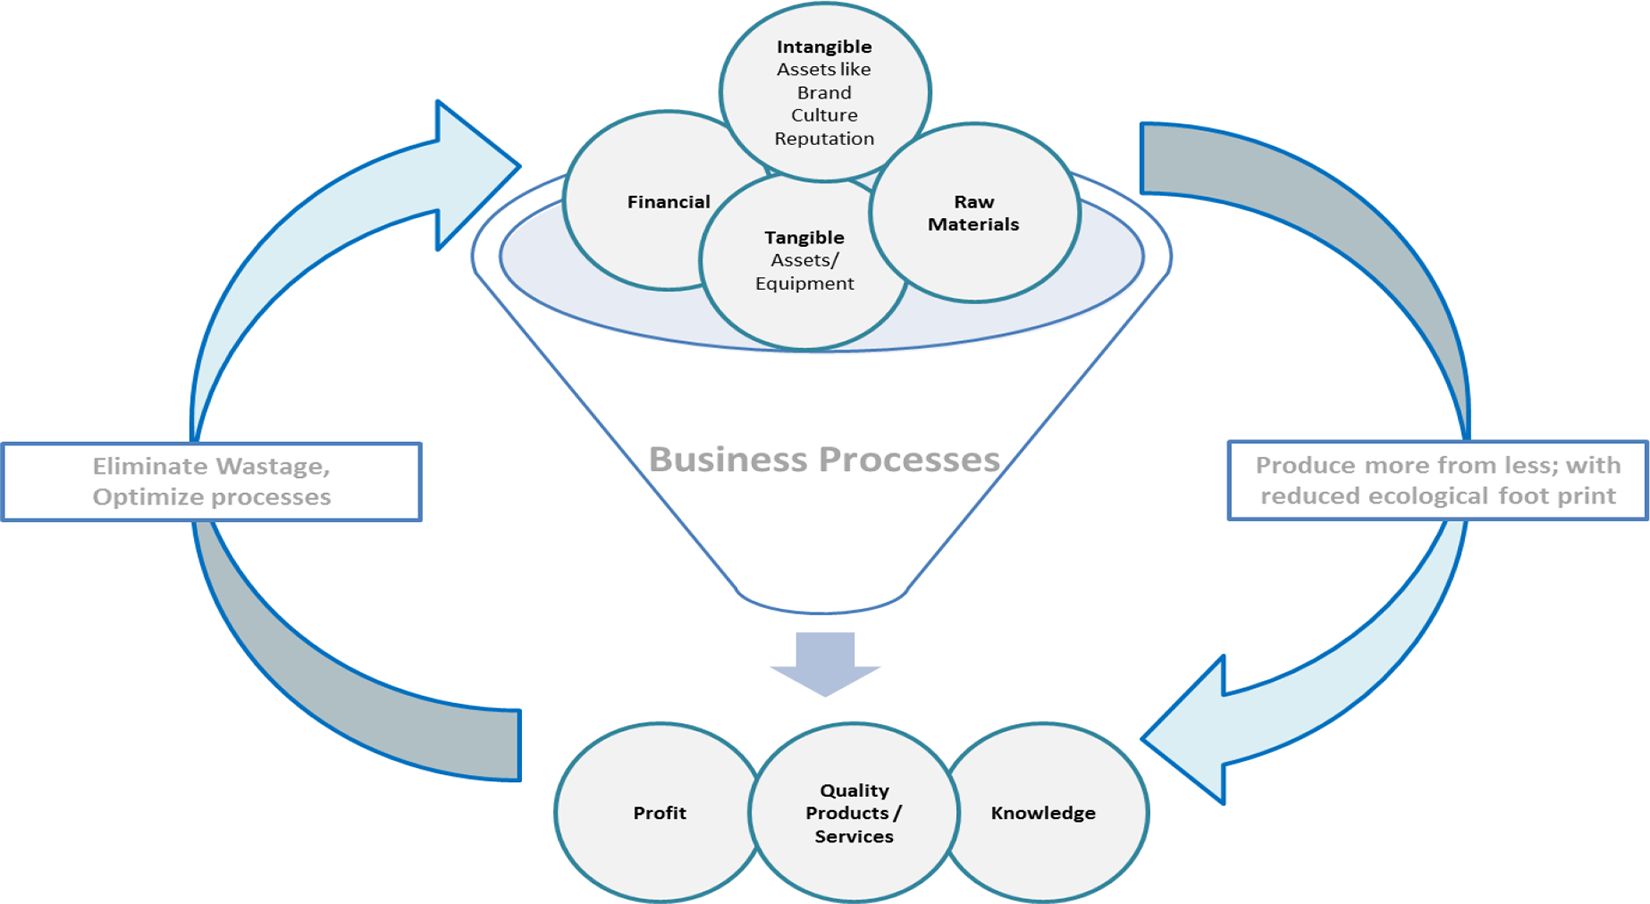
Organizational and institutional efficiency is the relation between the inputs (resources) and outputs (services, deliverables, and impact) of a system. 3
Organizational inefficiency is critical for Qatar because most of Qatari’s organizations and public sector institutions are funded by oil and gas revenues. These organizations have historically operated on huge budgets, where efficiency is a minor concern. The accomplishments of Qatari organizations achieved have been mainly driven by oil and gas revenues, and OE or reducing the waste of critical resources is a minor focus. E.g. Qatari education system involving K–12 schools, Universities, Higher Research institutions are prominent organizations among GCC countries; similarly, Qatari healthcare system is one of best in middle east. However, the cost of establishing and maintaining such systems and facilities have been much higher than elsewhere in the world as these organizations were not grown organically but planted and nurtured inorganically involving huge expenditure to bring relevant talents and infrastructure. 4
Comparing organizational culture and management approach of Qatari organizations with those of western or Japanese organizational and management philosophies might be ineffective as most of Qatari organizations are yet to fix issues in their basic structural pillars like human resource practices, performance oriented culture, promoting innovation and out of the box thinking. However lean philosophy revolves around optimal resource utilization for value creation targeted at the end user. 5 All resources utilized in processes apart of value creation for end user is treated as waste and reduced through process improvement initiatives. In case of Qatari organizations, understanding the root causes of inefficiency and improving OE to enhance the overall efficiency of the country is essential to enable its transformation into an innovation-driven knowledge-based economy and sustainable development. Thus, the research approach in this study includes all sustainability dimensions to understand the QE. 6
General OE
OE could be mapped as a key performance indicator of corporate performance for both the public sector and private sector. 7 Scholars in the interdisciplinary studies of engineering, business, and economics have concluded that the socioeconomic parameters of society are deeply linked with corporate performance, OE, and thus the overall well-being of the economy and society. 8
Organizations across the world use various parameters to define efficiency, for example, employee performance and company profits, ratio of input cost to the value of output, ratio of key measures in manufacturing processes to production volume. 9 Although each organization defines its measures for mapping efficiency, optimizing the ratio between input costs to output benefits is the essence and considers minimizing the waste as a by-product or inputs (Figure 1). 10 Key performance indicators utilized in 6 sigma improvement projects are utilized to map efficiency in line with international best practices. While utilizing problem solving techniques like Taguchi method would definitely help in reducing scrap, rework, improving process performance, productivity and reduce manufacturing costs due to reduction in process variability. 11 However, the application of Taguchi method seems to be limited in GCC countries because of inadequacy in suitably trained and skilled human resources for successful implementation. Furthermore, the manufacturing and industrial production apart from oil and natural gas related industries, is relatively low in Arabian Gulf countries. Thus, tools like Taguchi Method which suits in industrial manufacturing may not be optimal for OE improvement for Qatari organizations. In comparison, 6sigma implementations offer required flexibility in application while ensuring the OE improvement goals are achieved.
Organizations—irrespective of type—operate interactively and interdependently between their inputs, outputs, internal systems, and external factors (Figure 1). Organizations always need resources as input value, and they are processed through internal systems (business models, manufacturing or service mechanisms) under external conditions (macroeconomic conditions, regulations, market forces) to produce output(s) that eventually generates value, different than that of the input, and contributes positively to the betterment of society, both socially and economically. 12
OE in Qatar
The importance of and need for OE in Qatar have been widely recognized by key governmental, industry, and academic leaders as part of Qatar’s, and similar countries’, quest for transforming into an innovation-driven knowledge economy and sustainable development. There are immense opportunities for efficiency gains across various verticals in the public sector and private sector enterprises in Qatar. Addressing the issues relating to inefficiencies through technology implementation, improvement of infrastructure, and strengthening regulations and processes would ensure that Qatar gains in efficient resource management in the long run. In the case of Qatar, there is an abundance of hydrocarbon resources, and other vital resources such as water and fertile land are scarce. Hence, efficiency is critical to create and capture economic value. Encouraging private sector development through innovation and economic diversification is the core of sustainability for Qatar. 13
Because Qatar’s economy depends on revenues from oil and gas, approximately 50% of its GDP, 14 it needs to diversify the revenue sources to fulfill the country’s strategic objective of transforming to KBE. This change will require significant OE improvements in services, manufacturing, and public organizations. 13 In 2016 and 2017, Qatar’s fiscal deficit was 9.2% and 6% of GDP, respectively; this data highlights the need for better cost control and high levels of OE in government-funded organizations. 15 In the past few years, government-funded organizations have been managing the challenges of budget cuts. These organizations will have to manage with the reduced budgets by improving OE levels. 16
Qatar’s successful 2022 World Cup bid is increasing the size and speed of large-scale infrastructure projects in Qatar. Organizations managing these projects should focus on delivering these projects efficiently without exceeding their budgets. The lack of efficiency in these high-value projects would significantly affect the Qatari economy, particularly with its reduced oil prices and increased budget deficits. 17
The proposed implementation of VAT will increase the cost of operations for Qatari organizations. To sustain their profitability, these organizations will have to improve their efficiencies significantly. 18 Since the blockade imposed on Qatar by its GCC neighbors on June 5, 2017, the operating costs of organizations in Qatar has increased. The increased cost of operations could result in financial losses. Hence, organizations will have to increase their efficiencies to sustain their operations. 19
Qatar’s Second Voluntary National Review Report (QSVNR) 2018 highlights the need for efficiency improvements in various spheres such as governance, resource utilization, economics, and infrastructure. The report highlights the need to “Support positive economic, social and environmental links between urban, semi-urban and rural districts by strengthening national and regional development planning” to achieve sustainable socioeconomic and environmental development within Qatar. The lack of efficiency in Qatari organizations affects its society and economy. The government of Qatar funds most of the government and semi-government organizations in the nation. Wasteful, inefficient spending of resources on inefficient organizations is unsustainable in the long term. These resources could be spent on areas such as education, healthcare, and infrastructure, which directly benefit society and the country. 20
There is also an opportunity cost for wasteful, inefficient spending of resources. Most of Qatar’s revenue is from limited resources such as oil and gas. Inefficient organizations end up spending more than is adequate to achieve their objectives, further stretching the government’s budget support. To reduce budget deficits, the production of oil and gas resources will increase, reducing the limited sources of oil and gas faster than planned. 21
As per the Global Competitiveness Report 2017–18, published by World Economic Forum, Qatar has 25th in the Global Competitive Index with a score of 5.11. Although it seems to be an achievement for the gas-rich country, considering that Qatar was the only middle eastern country ranked among the top 25 countries, there was a decrease in Qatar’s rank from 18th in 2016–17 to 25th in 2017–18. Various factors may have contributed to the decrease in the country’s ranking, including its poor performance in higher education and training, the inefficiency of its goods market, the underperformance of its labor market, its underprepared financial market, and the small size of its market. Factors such as the goods market and labor market efficiency are directly linked to OE and sustainability. In reality, market disruptions caused by the blockade on Qatar imposed by KSA, the UAE, Bahrain, and Egypt on June 5, 2017, have affected the total market size and financial liquidity, which has subsequently affected financial market readiness. 22
The key global competitiveness metrics of Qatar is compared with the OECD and MENA averages and country averages of Singapore and Norway (Figure 2). Qatar has exceeded the OECD average ranking for the robustness of institutions, macroeconomic environment, and infrastructure. While Qatar’s ranking for most of the 12 pillars used to measure global competitiveness, the ranks of technological readiness and market size have been significantly lower than the OECD averages, highlighting the area in need of improvement in the near term. 14 However, we compare Qatar’s rank with the highest-ranking OECD countries, such as Norway and Singapore, significant gaps emerge in all 12 areas.

Comparison of Qatar vs. OECD average, MENA average, Singapore and Norway. 22
According to the Global Competitiveness Report 2017–2018, Qatari economy is vulnerable to commodity price fluctuations, specifically crude oil prices. Therefore, the country should diversify revenue streams. 22
The QSVNR published in July 2018 by MDPS confirms that Qatar should transform to a knowledge-based economy; this also addressed in Qatar Voluntary National Review Report (QNVR) 2030, which aims to transform Qatar into an advanced country capable of realizing sustainable development and ensuring a high quality of life for its people for the long term. This goal will be achieved by diversifying the economy and reducing the dependence on oil and gas. QNVR 2018 also highlights the need to support positive social, economic, and environmental initiatives and achieve energy and resource efficiency in the public and private sectors to achieve sustainable development. 20
As a high-income and carbon-dependent economy, Qatar should focus on transforming into a knowledge/innovation-driven economy. The key engine of growth is knowledge; knowledge is acquired, created, disseminated, and applied to enhance economic development. 23 Typically, the four pillars of the knowledge economy are a (i) skilled and educated workforce, (ii) widespread and secure information and communication (ICT) infrastructure, (iii) effective innovation spurring system, and (iv) institutional regime that offers incentives for the effective spread and efficient use of existing knowledge. These four pillars and their interactions determine the sustenance and survival of knowledge economies in highly competitive and interdependent/globalized societies. 6
Qatar’s national development strategy for 2018–22 identifies the challenges to institutional development, service delivery, and fiscal management. It identifies that the economic benefits offered by government/semi-government organizations to its employees are far greater than those from the private sector. However, the performance and productivity of those employees are not comparable to those of the private sector. The reasons are as follows: poor performance of monitoring systems, lack of accountability, low motivation, and lack of communication skills. 13 Qatar’s fiscal deficit of 9.2% of GDP in 2016 and 6% of GDP in 2017 highlights the need for better cost control. This need adds to the urgency for high levels of OE in government-funded organizations. 15
Qatar’s successful 2022 World Cup bid is increasing the size and speed of large-scale infrastructure projects in Qatar. To sustain their profitability, these organizations must improve their efficiencies significantly. 18
Aim and objectives
The aim of this paper is to identify and understand the general OE level of Qatar’s organizations, by gathering as much data as possible from the business, industry, public and private sectors and conducting a general online survey. This method should lead to recommendations for the appropriate framework to help organizations in Qatar to improve their efficiency level. 24
As the methodology, a survey of stakeholders is conducted in the context of organizational (in) efficiency in Qatar, to develop an evidence-based understanding of the following: root causes of organizational (in)efficiency. possible means to improve the efficiency of organizations.
25
Based on the survey results, causes of organizational inefficiency in Qatar are identified and remedies are proposed in the form of a roadmap for organizations to improve OE.
The survey is designed for broad professional audience to ensure that adequate survey responses are obtained to arrive at meaningful conclusions that are not skewed based on limited responses. The approach to generalize the target audience of the surveys is also based on the lack of availability of credible information on operations of Qatari organizations and the limited information available in the public domain through annual reports.
Methods and approach
This research employed the triangulation method (qualitative and quantitative data collection mechanisms) to establish the research questions and constructs (Figure 3). 26 Employing the data triangulation method to study a hypothesis increases the veracity and validity of the results. 27 Furthermore, a widely accepted practice is to base research on multiple streams of information (triangulation of data source), and in this case, (i) content analysis, (ii) a questionnaire, and (iii) observation and iteration with constructs from the literature review. 27

Overall methodology of the research. 28
The triangulation method applied in this research involves acquiring information and data required for the culmination of research from 3 sources which are (1) literature review, (2) a survey conducted across industry professionals in Qatar, and (3) semi-structured interviews with academics and industry champions in Qatar. The leads on potential causes for OE inefficiency in Qatari organizations were obtained from literature review and semi-structured interviews with academicians and industry champions. Pre-survey interviews conducted with industry champions and academics to initially verify the draft survey questionnaire. Post survey interviews are planned to obtain feedback on results and discuss the efficiency improvement framework once the survey results are gathered. 29 As the first step of the triangulation method, an extensive literature review of OE improvement was conducted from a global perspective and within Qatar’s organizations to structure the survey questionnaire design. Similar to the research of Sureeyatanapas et al., 30 the key focus areas of (i) OE models, (ii) factors impacting OE, and (iii) measuring OE were identified for the survey. 30 Second step of triangulation method was the information and leads obtained from academicians and industry champions thus helped in crystalizing the survey questions making it relevant to the employees of Qatari organizations given the nature of organization culture and behavior which are specific of organizations in the Middle East. Third step in the research approach was the survey itself which channeled the feedback from employees of Qatari organizations which validated the information derived from previous steps explained above.
Pre-interview and IRB approvals
In this research, the quantitative approach was the predominant approach. To summarize the research methodology, data consolidation was conducted in three phases: (i) pre-survey interviews, (ii) general survey, and (iii) postsurvey interviews. The survey questionnaire was developed to target the audience from four entity types: (i) government organizations, (ii) semi-government organizations, (iii) private organizations, and (iv) non-profit organizations. 31
The pre-interview was conducted among the peers of PhD students doing similar research, to obtain some ideas and have a discussion with an academician to obtain their feedback. In addition, a random pre-interview was conducted with different people from different organizations and at different levels within Qatar’s organizations. Next, based on those results, a set of questions was posted online as a survey. The questions were designed to provide the requisite input to answer the research questions. Furthermore, this research obtained IRB approval.
Quantitative methods and plans
Online surveys were developed and run for a maximum number of participants from Qatari organizations to cover an employee’s perspectives on understanding the level of efficiency in Qatari organizations and the causes for inefficiencies in Qatari organizations.
The survey was conducted anonymously to identify the employee perspectives of the current state of the organization’s culture, leadership, efficiency, and effectiveness. The outcome of the survey was consolidated for data analysis. This step led to quantifying the responses and identifying the response trends. This input and the other data obtained on Qatari organizations’ from the public domain formed the basis for identifying efficiency improvement opportunities in Qatari organizations. 32
Survey sample
The optimal number of respondents was calculated based on the following formula:
For sample size n,

Where, X = Zα/22 *p*(1-p)/MOE2, and Zα/2 is the critical value of the normal distribution at α/2 (e.g. for a confidence level of 95%, α is 0.05, and the critical value is 1.96), MOE is the margin of error, p is the sample proportion, and N is the population size. Notably, a finite population correction has been applied to the sample size formula.
Therefore, the population of Qatar is 2,148,774, but the targeted workforce size is 682,523. A size of 438 was selected randomly from the targeted workforce size based on a 5% margin error, 95% confidence interval, and 50% sample proportion. 33
Survey questionnaire
The survey questions were presented as a questionnaire and designed to elicit responses from respondents to address two objectives of the research: (i) understand the level of efficiency in Qatari organizations and (ii) identify the causes of inefficiencies in Qatari organizations. The generic causes of inefficiencies identified from the literature review provide an indication of factors at the global level. However, because of the importance of traditions and culture in Qatari organizations, a survey provides an opportunity to identify and validate the factors causing inefficiencies. This information would also lead to further research in identifying mitigation plans to address the causes of inefficiencies, which would eventually lead to the transformation of Qatari organizations from inefficient to being efficient and profitable in the long term. The questionnaire had two parts: (i) identification of respondents’ key demographics and (ii) elicitation of responses on the level of OE and causes for inefficiencies. 34
Validation of the questionnaire
Surveys are the most frequently used tool in the quantitative approach. This method can be employed effortlessly over a large population of respondents to obtain a rational, objective, and generalized view of research outcomes, for example, when an organization’s management wants to gauge the effectiveness of training courses being conducted in the organization. Although a qualitative approach—employing open-ended questions and feedback sessions being conducted for the participants to give their feedback—would result in a perspective, a measurable and rational outcome is not always possible because the responses from the qualitative approach are subjective and may not always translate to effective training sessions. 35 By contrast, conducting a survey to rate the training on key pre-determined parameters, tracking the baseline pre-training awareness scores of participants, and comparing that with the post-training scores would readily provide a rational and objective outcome of the effectiveness of the training, which could be generalized to the whole population. 36
Key benefits of the quantitative approach are as follows: Easy to gather information from a large sample population Can conduct research across varied demographic groups and comparative analyses of the results to understand varied perspectives and outcomes Allows generalization of results Results are collected as numerical data and rating, and statistical tools can hence be employed to arrive at inferences.
37
The questionnaire was created to survey employees from the government sector, semi-government, and private sector because the organizational culture and work environments differ in these three sectors. The questionnaire was divided into three sections to better understand the research subject. The first section focused on the demographic details of respondents; the second section focused on understanding the OE in the organizations where the respondent worked; the third section focused on causes of inefficiencies in the respondent’s organizations. All responses were rated using a five-point Likert-type scale (1 [very low] to 5 [very high]). The questions were balanced to stimulate responses from national and international perspectives. 38 The pre-survey interviews were conducted with industry champions and academicians to validate the questions and focus areas.
Online survey rollout
Once the questionnaire was evaluated, the public was surveyed through an online survey platform. The questionnaire results were consolidated from the online responses. Data analyses were conducted based on the questionnaire responses and initial conclusions were drawn. Critical trends, insights, and outliers were discussed to obtain their rationale. 39
Once the initial set of conclusions and observations were finalized, post survey interviews were conducted with industry champions and academicians to deliberate the results. Next, feedback on the responses was analyzed, and this process leads to the development of a framework and recommendations for OE improvement in the Qatari context. The feedback consolidated in post survey interviews also helped identify the ease of implementation of potential solutions from the industry and academic perspectives and validated the survey results and proposed framework. The feedback also provided direct, personal interaction with industry professionals and academicians such that inferences could be made on the OE measures in their respective organizations, and feedback on the proposed framework for OE improvement in Qatari organizations could be obtained. 40 The survey results also point toward the need to establish full-fledged quality management functions within Qatari organizations—so that the skilled human resources could implement tools like quality function deployment (QFD) tools to identify the root causes for inefficiency upfront before the causes snowball into major disruptive issues.
Results and discussion
This section focuses on the analyses of the survey results, to identify and understand the general OE level of Qatar’s organizations. This level leads to an understanding of the underlying factors causing organization inefficiencies and thus guides the creation of an appropriate framework of tools and methodologies such as Quality Function Deployment to integrate Total Quality Management in order to help organizations in Qatar improve the efficiency level within their organizations.
A statistical analysis of the questionnaire sent to 1306 companies across industries in Qatar was conducted; 438 completed responses were collected. Based on the suitable questions on the questionnaire, the efficiency was evaluated based on the results of the statistical analysis.
The surveyed population was the employees who worked for organizations such as government and semi-government organizations and companies operating in the oil and gas, banking, airlines, technology services, education, transportation domains.
Data collection was conducted by questionnaire. The questionnaire was distributed mainly on a professional survey website. A total of 1306 questionnaires were distributed, and 438 valid questionnaires were collected. The effective recovery rate was 34%. Therefore, the final sample was 438 employees: 26% were females (the rest were males), and 31% were Qatari (the rest were non-Qatari).
The main instrument was the questionnaire. The questionnaire was divided into five sections: (1) questions related to the demographic variable, (2) questions that measured the efficiency level of the organization, (3) questions that measured the causes of inefficiencies, (4) questions that measured the strategies to enhance OE.
Demographic variables
The questionnaire mainly included seven demographic variables: gender, nationality, age, education, salary, type of organization, and length of residence in Qatar. Figure 4 shows the cluster bar charts of age and gender for Qataris, non-Qataris, and both. The age of most participants is between 21 and 50 years: 46.9% are aged 21–40 years, and 34% are aged 41–50 years. Figure 4 also reveals that the percentage of females is higher than that of males of younger ages, but the opposite was observed in older ages among the Qataris.

Distribution of participants based on age, gender, and nationality.
Figure 5 shows the cluster bar charts of education level and gender for Qataris, non-Qataris, and both. In Figure 5, most participants (N = 164, % = 37.4) have a bachelor’s degree or higher: 37.4% hold a bachelor’s degree (34.9% of all males, 44.7% of all females), 30.4% hold a master’s degree (28.7% of all males, 35.1% females of all females), 18.5% hold a PhD (21% of all males, 11.4% of all females). The percentage of females with bachelor’s degrees or higher is 35% for the Qatari participants and 19% for the non-Qatari percipients, which is lower than the percentage of the Qatari males (50%) and non-Qatari males (86%).

Distribution of participants based on their education level, gender, and nationality.
Figure 6 demonstrate the cluster bar charts of salary and gender for Qataris, Non-Qataris, and both. None of the Qataris is paid less than QAR 5000, and 4.3% of their non-Qataris counterpart is paid less than QAR 5000. Moreover, the salaries of 20.1% of the participants range between QAR 5000 and QAR 10000 (12.3% of all females, 22.5% of all males), the salaries of 14.8% of the participants range between QAR 10000 and QAR 20000 (21.1% of all females, 12.7% of all males), the salaries of 24.4% of the participants range between QAR 20000 and QAR 40000 (29.8% of all females, 22.5% of all males), the salaries of 37.9% of the participants are higher QAR 40000 (36% of all females, and 38.6% of all males). In addition, the percentage of females paid more than QAR 60000 (Qataris = 16%, Non-Qataris = 1.6%) is significantly less than that of their male counterparts (Qataris = 50.6%, Non-Qataris = 13.4%).

Distribution of participants based on their salary, gender, and nationality.
Figure 7 shows the cluster bar charts of organization type and gender for Qataris, Non-Qataris, and both. Most of the participants (N = 254, % = 58%) work for semi-government sectors (75.6% of total non-Qataris, 24.4% of total Qataris); (N = 93, % = 21%) of the participants work for the government sector (50.5% of total non-Qataris, 49.5% of total Qataris); the rest of the participants (N = 69, % = 16%) work for private sectors (72.5% of total non-Qataris, 27.5% of total Qataris); (N = 22, % = 5%) work for non-profit organizations (68.2% of total non-Qataris, 31.8% of total Qataris).
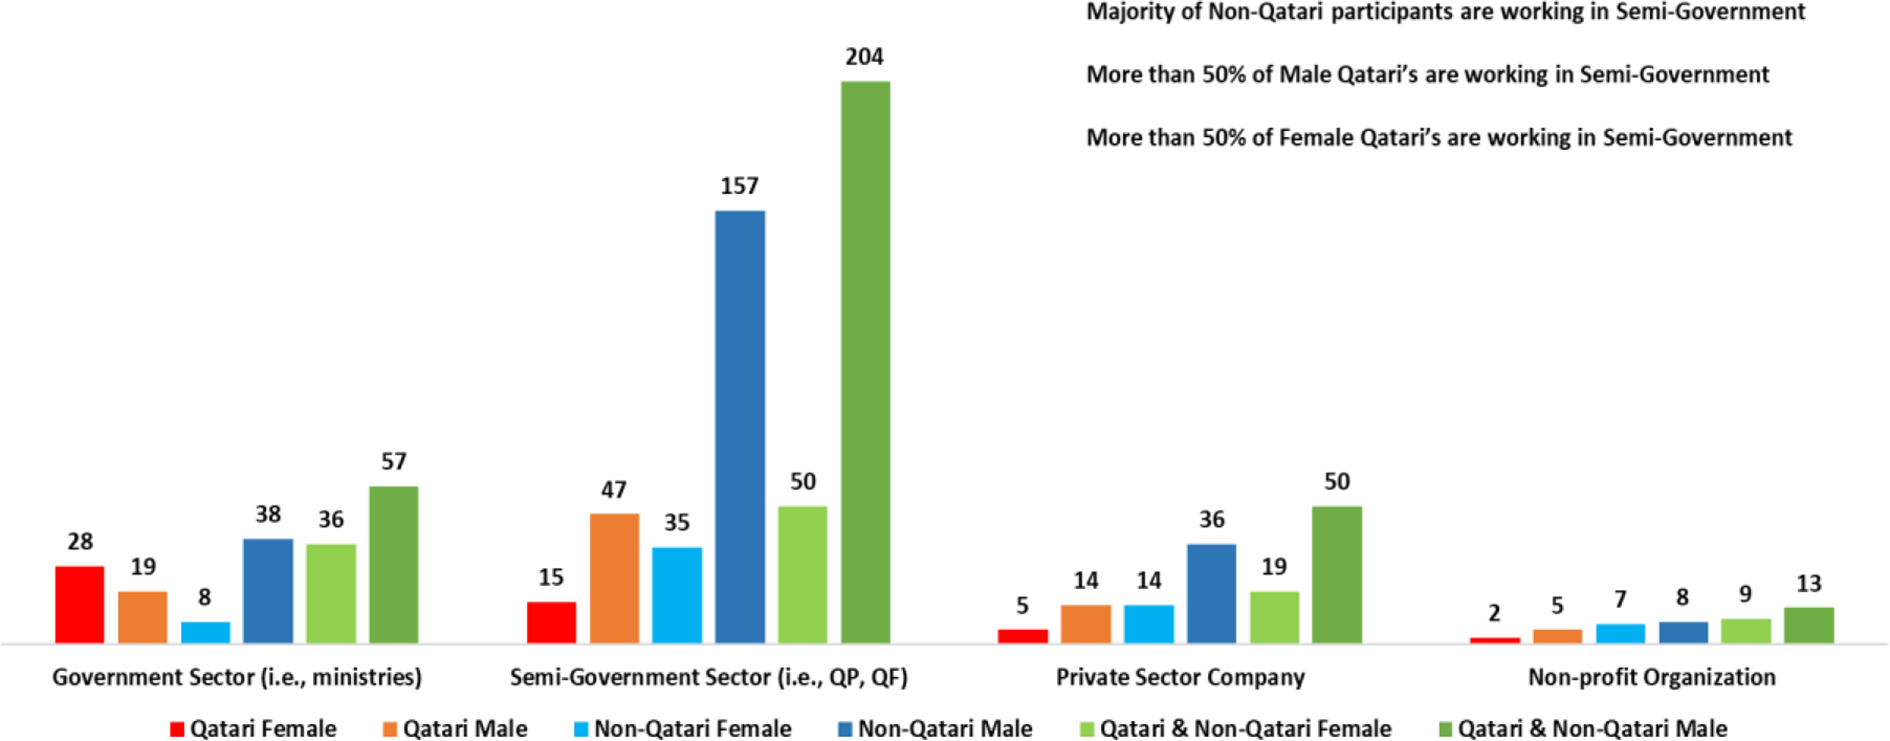
Distribution of participants based on their organization type, gender, and nationality.
Figure 8 shows the cluster bar charts of the duration of residence in Qatar and gender for Qataris, Non-Qataris, and both. Most participants (N = 237, % = 54.1%) have resided in Qatar for 10 years and longer, of which 50.2% had resided in Qatar for more than 10 years; 49.8% of all non-Qataris have resided in Qatar for more than 10 years.

Distribution of participants based on the duration of residence in Qatar, gender, and nationality.
Efficiency measurement analysis
To understand the perception about the efficiency of the organizations, two main questions on the questionnaire were considered. The first question was as follows: “How would you rate the overall efficiency of your current organization?” Its responses were ranked as follows: Highly inefficient Inefficient Efficient Highly efficient
The second question is as follows: “Compared to your previous organization, how would you rate the overall OE of your current organization?” Its responses were ranked as follows: Significantly better than my previous organization Better than my previous organization Approximately the same Lower than my previous organization Much lower than my previous organization Never worked before
Figure 9 shows the perceptional understanding for the results of the efficiency of the current organization graphically. Table 1 illustrates additional details for the same, and 75% of the participants reported that the efficiency of the current organization is either efficient or highly efficient. In Figure 10, which illustrates the responses of Qatari’s and non-Qatari’s to the question on the overall efficiency of their current organization, the response of most of the Qatari’s (81%) was efficient or highly efficient, and similarly, non-Qatari’s percentage was (76%) for the same response.
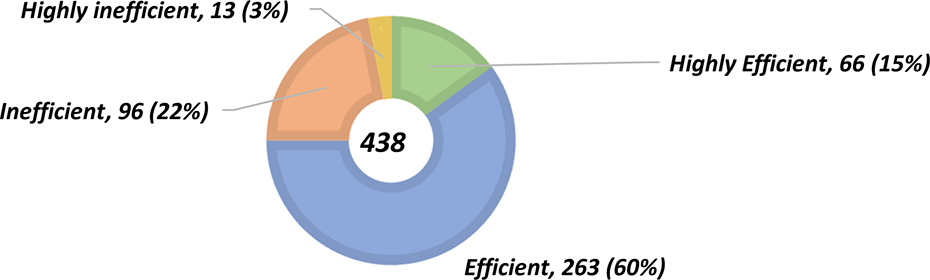
Efficiency level of Qatar’s current organizations.
Efficiency level of the current organization.


Perceptions on the efficiency levels of Qatar’s organizations by nationality. Almost 81% of Qataris think that their organization is efficient. This ratio is 71% among non-Qataris.
Figure 11 shows the distribution of responses for the question on the participants’ opinion on the efficiency of their current organization in comparison to their previous organization. It is obvious that comparative perceptions are equally split, i.e. 43% thinks that their current organization in Qatar is significantly better or better than their previous organization, which might be either in Qatar or outside Qatar. 37% of them think that their current organization in Qatar is much lower or lower efficient than their previous organization. 16.7% perceives that they are at the same efficiency level.

Efficiency level of the current organization compared with the previous organizations.
Table 2 tabulates detailed information the perceptions of the participants on the efficiency of their current organizations compared with their previous organization. 58.5% of the Qatari’s responses indicate that the efficiency of their current organization is either better or significantly better than their previous organization. This ratio goes down to 36% for the non-Qataris, 41% of whom also think that their current organization’s efficiency is either much lower or lower than their previous organization. Similarly, more participants currently working in the government agencies (67%) think that their organization has lower efficiency than their previous organization. Slightly more participants from the semi-government organizations (45%) perceives a higher efficiency whereas this ratio increases to 67.5% or participants in the private sector.
Efficiency of the current organizations compare with the previous organizations.

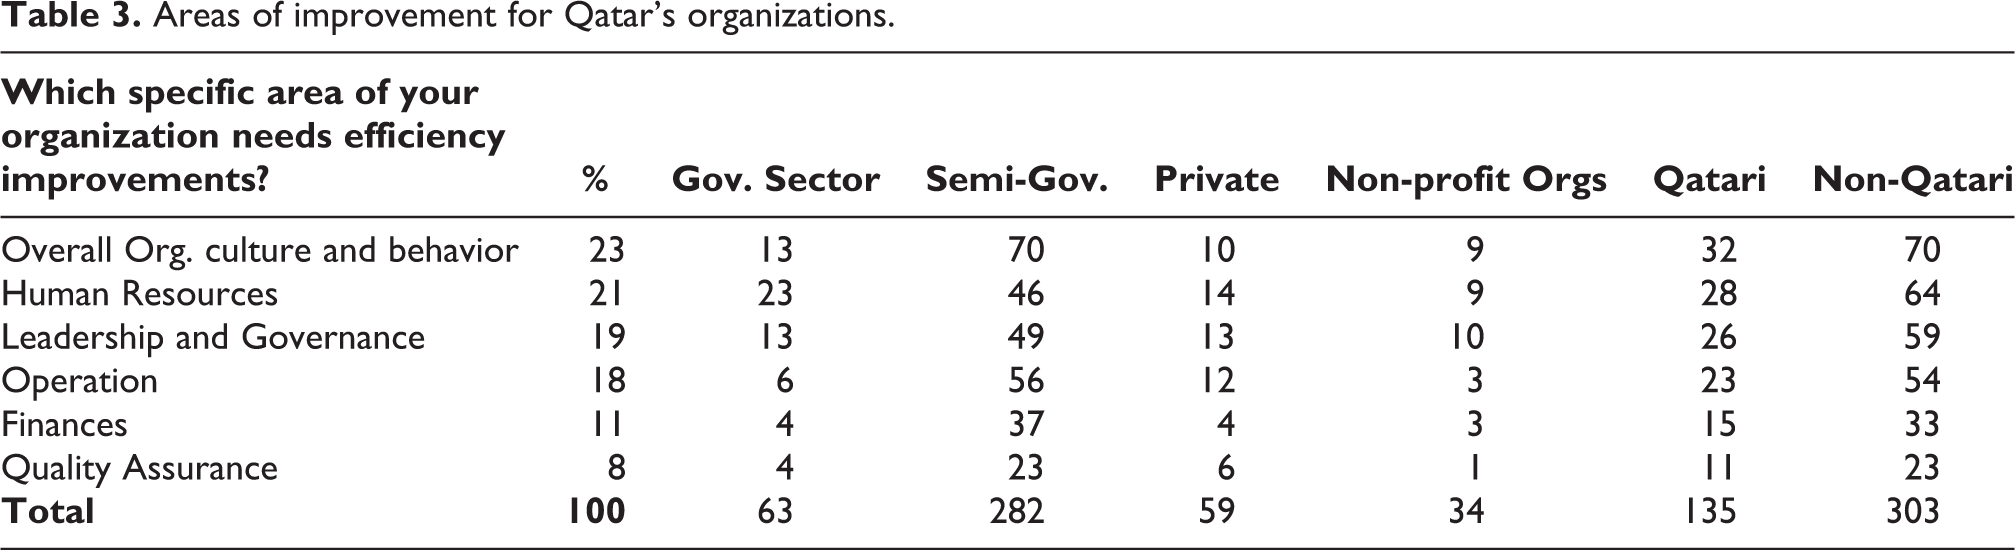
Follow up questions were asked during survey to obtain information on the areas or functions where participants think that organizations need efficiency improvements. Figure 12 summarizes the responses to the question: “Which departments of the current organization would need efficiency improvements?” Accordingly, 102 participants out of 438 (23%) indicated that overall organization culture needs to be improved, which is followed by human resources (21%) and leadership and governance (19%). In essence, it is a well-known fact that leadership and governance select and influences the human resources, and together they form the organizational culture, which in the long-term impacts the human capacity and overall efficiency. Thus, around 63% of participants indicated that efficiency improvement needs are directly related to human aspects of organizations. Table 3 presents details of what needs efficiency improvements in terms of differences between Qatari and Non-Qatari participants as well as the differences between participants from various sectors. Overall, regardless of sectors, slight majority of participants (i.e., 58–68%) agrees that efficiency improvements should focus on organizational culture, leadership, and human resources.

Areas of improvement for Qatar’s organizations.
Areas of improvement for Qatar’s organizations.
One more question was asked to the participants to rank a set of seven alternatives that could cause inefficiency based on their experience. Table 4 presents the ranking of a set of seven alternatives that could cause inefficiency based on the experiences of the participants. It summarizes the results of ranking these alternatives from 1 to 7, where one is the highest rank and seven is the lowest rank; the score is out of five based and on the mean of ranks for each alternative. The “Lack of communication between leadership and employees” has the highest mean (4.51), thus it ranks first. In the second place is the “Frequent change in organizational structure” (mean 4.43). In last place is “Wasteful operational” (mean 3.26).
Rank the causes of inefficiency within Qatar’s organizations.

Causes of inefficiency
In this section, the efficiency of the organizations was analyzed based on the above-mentioned efficiency questions, and that for several items is mentioned that could cause inefficiency of the organizations. The statistical tests such as the T test for independent samples and analysis of variance ANOVA were used to test if there are significant differences between the different categories of the target variable, which helps us decide if the variable causes inefficiency. 41 The set of questions posed to participants is as follows:
1. Are you involved in measurement, review, and improvement actions of the Key Performance Indicators (KPIs) in your current organization?
The results of the efficiency analysis from the perspective of participants involved in measurement, review, and improvement actions of the KPIs and those not involved are as follows 42 : 46.6% of the respondents to “How would you rate the overall efficiency of your current organization” are involved, and 53.48% are not. Based on the t-test results, there is significant difference in efficiency level between the participants who are involved and those who are not (t = −0.28, P value = 0.783 > 0.05). Additionally, 58.8% of the respondents to “Compared to your previous organization, how would you rate the overall OE of your current organization” are involved, and 41.2% are not. Based on the t-test results, there is no significant difference in efficiency level between participants who are involved and those who are not (t = −0.70, P value = 0.485 > 0.05). According to results, a conclusion is as follows: “employees not actively being involved in measurement of KPIs, review, and implementation of improvement actions in an organization leads to inefficiency in the organizations in Qatar.”
2. Are you aware of the strategic priorities and goals of your organization for the next 3 to 5 years?
The results of the efficiency analysis from the perspective of participants who are highly aware, somewhat aware, and unaware of the strategic priorities and goals of your organization for the next 3 to 5 years are as follows: 54.2% of the respondents to “How would you rate the overall efficiency of your current organization” are aware, and 45.8% are not. Based on the ANOVA results, there are no significant differences in efficiency level between participants who are aware and those who are not (F = 1.71, P value = 0.183 > 0.05). Additionally, 53.1% of the respondents to “Compared to your previous organization, how would you rate the overall OE of your current organization” are aware, and 46.9% are not. Based on the ANOVA results, there are significant differences in efficiency level between participants who are aware and those who are not where (F = 0.88, P value = 0.416 > 0.05). According to the results, a conclusion is as follows: “If employees are unaware of strategic priorities and goals for the next 3 to 5 years of an organization, it leads to inefficiency in Qatari organizations.”
3. Do you have the knowledge of work processes and the required tools to achieve the goals set by your organization?
The results of the efficiency analysis from the perspective of the participants who have the knowledge of work processes and the required tools to achieve the goals set by the organization and those that do not are as follows: 83.3% of the respondents to “How would you rate the overall efficiency of your current organization” have the knowledge, and 16.7% do not. Additionally, based on the t-test results, there is a significant difference in the efficiency level between participants who have the knowledge and those who do not (t = 3.73, P value < 0.001), and the efficiency weight from the perspective of the participants who have the knowledge is 73.8% versus 63% from the perspective of those who do not. Additionally, 84.7% of the respondents to “Compared to your previous organization, how would you rate the overall OE of your current organization” have the knowledge of work processes and the required tools to achieve the goals set by the organization, and 15.3%% do not. Based on the t-test results, there is a significant difference in the efficiency level between participants who have the knowledge and those who do not, where (t = 3.10, P value = 0.002 < 0.05). Additionally, efficiency weight compared with the previous organization from the perspective of the participants who have the knowledge is 65.8% versus 47% from the perspective of those who do not. According to the results, a conclusion is as follows: “The ignorance of work processes and the required tools to achieve the goals set by the organization causes inefficiency in the organizations in Qatar.”
4. In your current organization, do you know the right authority to approach when a critical decision must be made?
The results of the efficiency analysis from the perspective of participants who are highly aware, somewhat aware, and unaware of the right authority to approach in case of a critical decision to be made are and those who are not are as follows: 92.5% of the respondents to “How would you rate the overall efficiency of your current organization” are aware, and 7.5% are not. Based on the ANOVA results, there are significant differences in the efficiency level between participants who are aware and those who are not (F = 14.63, P value < 0.001), and the weighted means are (highly aware = 76.5%, aware = 67.3%, and unaware = 61.8%), which indicate that the high awareness leads to high efficiency. Additionally, 91% of the respondents to “Compared to your previous organization, how would you rate the overall OE of your current organization” are aware, and 9% are not. Additionally, based on the ANOVA results, there are significant differences in efficiency level between participants who are aware and those who are not (F = 4.80, P value < 0.001), and the weighted means are (highly aware = 68.0%, aware = 59.6%, and unaware = 44.6%), which indicate that the high awareness leads to high efficiency compared with the previous organization. According to the results, a conclusion is as follows: “The unawareness of the right authority to approach in case of a critical decision to be made causes inefficiency in the organizations in Qatar.”
5. In your opinion, does your organization have the right structure and skilled people to achieve its goals for the next 3 to 5 years?
The results of the efficiency analysis of the organizations that have the right structure and skilled people to achieve their goals for the next 3 to 5 years and the organizations that do not are as follows: 55.7%% of the respondents to “How would you rate the overall efficiency of your current organization” reported that their organization has the structure and skilled people to achieve its goals for the next 3 to 5 years, and 44.3% reported that their organization did not. Based on the t-test results, there is a significant difference in the efficiency level between the organizations that do and that do not (t = 7.01, P value < 0.001), and the weighted means of efficiency are (Yes = 77.8%, No = 64.5%), which indicates that the organizations that have the wrong structure and skilled people are less efficient than the others. Additionally, 59.7% of the respondents to “Compared to your previous organization, how would you rate the overall OE of your current organization” reported that their organization has the structure and skilled people to achieve its goals, and 40.3% reported that their organization did not. Based on the t-test results, there is a significant difference in the efficiency level between the organizations that have and that do not have the right structure and skilled people, where (t = 3.89, P value < 0.001) and the weighted means of efficiency compared with the previous organization are (Yes = 69.8%, No = 52.5%), which indicates that the organizations that have the wrong structure and skilled people are less efficient than the others. According to the results, a conclusion is as follows: “Not having the right structure and skilled people to achieve the goals in the organizations causes inefficiency in the organizations in Qatar.”
6. In your organization, are you encouraged to think out of the box to solve critical problems and implement them?
The results of the efficiency analysis from the perspective of participants who are encouraged to think out of the box to solve critical problems and implement them and those who are not is as follows: 65.8% of the respondents to “How would you rate the overall efficiency of your current organization” are encouraged, but 34.2% are not encouraged. Additionally, based on the t-test results, there is a significant difference in the efficiency level between participants who are encouraged and those who are not (t = 5.07, P value < 0.001), and the weighted mean of the efficiency from the perspective of those who are encouraged is higher 75.5% versus 64.8% those who are not, which indicates that an organization that does not encourage its employees is less efficient than an organization that does. Additionally, 69.3% of the respondents to “Compared to your previous organization, how would you rate the overall OE of your current organization” are encouraged to think out of the box, but 30.7% are not. Additionally, based on the t-test results, there is a significant difference in the efficiency level between those who are encouraged and those who are not, where (t = 4.61, P value < 0.001), and the weighted mean of the efficiency compared with the previous organization from the perspective of those who are encouraged is 69.4% versus 48.2% of those who are not, which indicates that the organization that does not encourage its employees is less efficient than the organization that does. According to the results, a conclusion is as follows: “Not Encouraging employees to think out of the box to solve critical problems and implement them causes inefficiency in the organizations in Qatar.”
7. Do you feel that your manager/supervisor cares for you as a person and helps you to learn and grow in the organization?
The results of the efficiency analysis from the perspective of those who feel that their managers/supervisors care for them as a person and help them to learn and grow in the organization and those that do not is as follows: 64.9% of the respondents to “How would you rate the overall efficiency of your current organization” feel care and help from their managers to learn and grow in the organization, but 35.1% do not. Additionally, based on the t-test results, there is a significant difference in the efficiency level between those who feel that and those who do not, where (t = 4.10, P value < 0.001), and the weighted mean of the efficiency from the perspective of those who feel that is 74.8% versus 64.8% from the perspective of those who do not, which indicates that careless and helpless managers lead organizations to be less efficient than do careful and helpful managers. Additionally, 70.7% of the respondents to “Compared to your previous organization, how would you rate the overall OE of your current organization” feel care and help from the managers’ side, but 30.7% do not. Additionally, based on the t-test results, there is a significant difference in the efficiency level between those who feel care and help and those who do not, where (t = 4.16, P value < 0.001), and the weighted mean of the efficiency compared with the previous organization from the perspective of those who feel care and help is 68.6% versus 49% from the perspective of those who are not encouraged to think out of the box, which indicates that the careless and helpless managers lead an organization to be less efficient than do the careful and helpful managers’ organizations. According to the results, a conclusion is as follows: “Not careless and helpless managers about their employees cause inefficiency in the organizations in Qatar.”
8. In your opinion, how often are people empowered with the right balance of accountability and responsibility within your organization?
The results of the efficiency based on how often people are empowered with the right balance of accountability and responsibility within the organization are as follows: 14.8% of the respondents to “How would you rate the overall efficiency of your current organization” think people are always empowered in their organization, 33.1% think people are often empowered in their organization, 43.3% think people are occasionally empowered in their organization, and 9.1% think people are never empowered in their organization. Based on the ANOVA results, there are significant differences in the efficiency level between the different levels of empowerment, where (F = 20.53, P value < 0.001), and the weighted means of the different levels are (Always = 84.3%, Often = 73.8%, Occasionally = 69.8%, and Never = 55.3%), which indicates a positive relationship between the empowerment efficiency of the organization, where the greater the empowerment, the greater the efficiency in the organization. Additionally, 13.3% of the respondents to “Compared to your previous organization, how would you rate the overall OE of your current organization” think people are always empowered in their organization, 37.3% think people are often empowered in their organization, 38.7% think people are occasionally empowered in their organization, and 10.7% think people are never empowered in their organization. Based on the ANOVA results, there are significant differences in the efficiency level between the different levels of empowerment, where (F = 10.10, P value < 0.001), and the weighted means of the different levels are (Always = 80.0%, Often = 69.6%, Occasionally = 57.2%, and Never = 38.8%), which indicates a positive relationship between the empowerment of the efficiency of the organization, where the greater the empowerment, the greater the efficiency in the compared with the previous organization. According to the results, a conclusion is as follows: “Absence of the empowerment with the right balance of accountability and responsibility within the organization causes inefficiency in the organizations in Qatar.”
Strategies to enhance OE
Increasing OE and sustainability in Qatar’s organizations have become the central considerations of organizations in Qatar as well as of the government leadership. 43 In this section, based on the responses to the questionnaire distributed online to employees within Qatar’s organizations, how to improve the level of efficiency is assessed. 44 To gather as many as information a set of questions and responses collocated as follows:
1. Which of the following resources do you think your organization needs to be efficient or to improve its efficiency?
Table 5 shows the responses of participants and the resources that they think need improvement. The three resources or actions that participants selected to improve efficiency with Qatar’s organizations are (16.2%) better governance/management policies, (12.1%) changes in the human resource structure, and (12%) changes in operations.
Resources that can improve Qatar’s OE.

2. What are the three most important changes that could improve the efficiency of your organization?
Table 6 shows the three most important changes that could improve the efficiency level in Qatar’s organizations: 25% encourage in-house innovation to reduce the cost of waste and inefficiency as the first option; 21.5% prefer hiring pragmatic leadership/management to bring positive changes; and 20.2% select increasing productivity and quality and reducing costs through efficiency improvement tools such as 6Sigma.
The most important changes that could improve efficiency in organizations in Qatar.

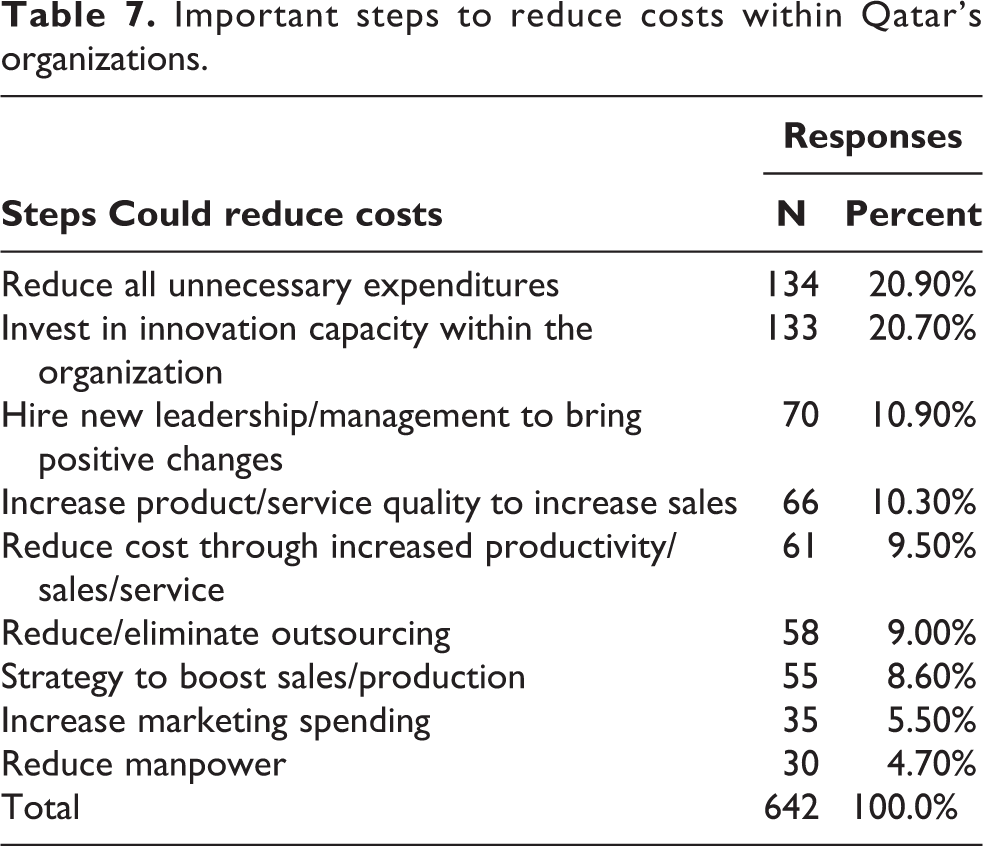
3. What are the three important steps through which your organization could reduce costs?
Table 7 shows the three most important steps to reduce costs in Qatar’s organizations: reduce all unnecessary expenditures (20.9%), invest in innovation capacity within the organization (20.7%), and hire new leadership/management to bring positive changes (10.9%).
Important steps to reduce costs within Qatar’s organizations.
Conclusions
Literature on organizational efficiency assessments is limited and qualitatively poor, especially when it comes to broader sustainability perspectives and for organizations located in the Arabian Gulf, such as Qatar. The research approach developed in this study aims to understand and have a quantitative measure on the efficiency in Qatari organizations. This is a crucial step in understanding and improving the transformation journey of Qatari, and similar, organizations toward the knowledge economy and sustainable development goals. This paper, first, focuses on development of research approach to measure and understand organizational efficiency perceptions among employees based on international best practices, and it conducts a comparative efficiency analysis on the Qatari organizations from sustainability perspective considering all dimensions of economics, environment and social impacts.
In order to have an evidence-based measure on the efficiency of the organizations, two main questions were considered in the questionnaire: How would you rate the overall efficiency of your current organization? Compared with your previous organization, how would you rate the overall OE of your current organization?
Two additional questions were asked during data collection to obtain more information on the departments that would need efficiency improvements in the organizations: Which departments of the current organization need efficiency improvements? Which departments of your current organization need improvement compared with your previous organization?
Notably, 23.3% of responses indicate that the overall organization culture and behavior needs improvement; 21% of responses indicate that the human resources department needs improvement; 19.4% indicate that the leadership and governances need efficiency improvements. These responses indicate the focus areas for overall efficiency improvements in Qatari organizations. These responses also show that the main pillars in Qatar’s organizations have not reached a level such that it helps the organization think of and improve other elements such as operation and finance. The detailed analysis of the survey results led to the following conclusions: Lack of measurement, review, and improvement actions of the KPIs causes inefficiency in the organizations in Qatar Staff being unaware of strategic priorities and goals for the next 3 to 5 years causes inefficiency in the organizations in Qatar The ignorance of work processes and the required tools to achieve the goals set by the organization causes inefficiency in the organizations in Qatar Not knowing the right authority to approach in case of a critical decision to be made causes inefficiency in the organizations in Qatar Not having the right structure and skilled people to achieve the goals in the organizations causes inefficiency in the organizations in Qatar Not encouraging employees to think out of the box to solve critical problems and implement them causes inefficiency in the organizations in Qatar Careless and helpless managers lead organizations to be less efficient than do the careful and helpful managers’ organization
Absence of the empowerment with the right balance of accountability and responsibility within the organization causes inefficiency in the organizations in Qatar.
Researchers validated their finding from survey through a Delphi group consisting prominent academicians and industry champions from leading Qatari government/semi-government and private organizations. The Delphi group feedback was solicited on voluntary basis and no fee or remunerations were paid for responses. The methodology of Delphi decision making involved a series of questionnaires/surveys being sent to selected experts by a facilitator who supervised the process, consolidated, and clarified responses with Delphi group panel of experts. Members of the Delphi group were identified based on their expertise or skill in specific areas. Responses from group members were consolidated and analyzed to understand conflicting and similar viewpoints on each points. The deliberation process continues till synthesis of ideas leads to concurrence in thinking and eventually a consensus is built. The conclusions listed above was thus vetted and validated through the Delphi group of experts.
Recommended next steps in this line of research is to develop a framework suitable for the local context to systematically improve the organizational efficiency by addressing the root causes of the identified inefficiency areas and segments. The proposed framework would include tools and methods that can be applied by Qatari organizations to improve OE by specifically addressing the top causes identified by the survey. It should be noted that the results and findings of this study are limited to the local Qatari context and the surveyed segment of the workforce. In order to achieve general guidelines and findings, surveyed population and localities should be expanded.
Footnotes
Declaration of conflicting interests
The author(s) declared no potential conflicts of interest with respect to the research, authorship, and/or publication of this article.
Funding
The author(s) received no financial support for the research, authorship, and/or publication of this article.