
Abstract
The purpose of this article is to deal with subcontracting strategies in the context of production, maintenance and quality integration. We study the multi-item capacitated lot-sizing problem for a production system composed of a single machine. The production system is considered imperfect, producing both conforming and non-conforming items. However, the deterioration of the system is a function of the time and production rate, which affects the quality of the manufactured items. Consequently, a quality control strategy is established, the aim is to inspect, adjust and control the manufactured items. To solve our problem, an evolutive optimization approach is proposed, namely the genetic algorithm (GA). Then, in order to adjust the parameters of GA, we use the Taguchi method. This article is one of the few documents dealing with integrated production management, maintenance and quality under subcontracting constraints that takes into account the complex aspect of the multi-item manufacturing industry. Then, a sensitivity analysis is also carried out to illustrate the robustness of the proposed control policy. Finally, we compare our results with the literature to validate our approach and highlight the advantage of subcontracting in minimizing costs.
Keywords
Introduction
The main interest of each company is the improvement of productivity, as well as the evolution of its competitiveness. As is clear, effective management and decision-making are crucial to improve the performance of manufacturing industry. In fact, the three main departments in the company are production, quality and maintenance. In the literature, the three functions are treated separately as well as the traditional approach dissociated from each other.
Firstly, research has shown the dependence between production and maintenance. We mention that the degradation of the manufacturing system increases as a function of the time elapsed or as a function of the production rate. For this reason, there is a dependence between production rates and the reliability of production equipment. 1 Secondly, the quality of the items manufactured and the maintenance of the equipment are attached. 2 Because, the increase in the rate of deterioration influences the quality of the manufactured items. Consequently, the choice of preventive and corrective maintenance strategy reduces the risk of failure, which results in the reduction of the appearance of non-conforming items. 3 In a third level, the quality of the manufactured items is one of the criteria for evaluating the performance of the production department.
As a result, process inspection and quality control make it possible to monitor process variations and evaluate the conformity of manufactured items.
From the previous, we have highlighted the dependence between production planning, maintenance strategy and quality control. Therefore, the effective operation of the company requires the proper management of these three functions in a simultaneous way. Indeed, the use of subcontracting is not only justified by the lack of capacity of the principal and the reduction of costs but also by the high quality of manufactured items. In other words, companies that are interested in the quality of manufactured items adopt a more subcontracting strategy. In addition, subcontracting has attracted the attention of researchers in recent decades. In the same context, this research contributes to the small body of literature on the integration of subcontracting strategies into the joint management of production, maintenance and quality in a context of multi-item capacitated lot-sizing problem (MCLSP). Our main objective is to determine simultaneously a production plan, a maintenance policy and a quality control strategy by making an optimal choice of subcontracting. The rest of the document is organized as follows. The second section presents a literature review on the integration of production, maintenance and quality.
This is followed by the contribution of our article as well as a description of the system and definition of the problem. In the fifth section, model formulation and in the sixth section, optimization procedure. In the seventh section, analysis and discussions. Sensitivity analysis is presented in the eighth section. Finally, conclusion and perspectives.
Literature review
This section focuses on three main areas. The first axis is lot-sizing problem, while the second problem focuses on quality integration for production and maintenance decision-making. Finally, the strategies for choosing subcontracting and the motivations of the latter. The following literature review is therefore conducted taking into account the different approaches that have been developed under each of these three research axes.
We treat the first axis of lot-sizing problem. Indeed, this problem is one of the problems that holds a very important place in production planning at the tactical level. However, lot-sizing models differ in the type of demand (constant or variable), as well as in production capacity (finite or infinite). We note that Aghezzaf et al. have addressed the problem of MCLSP. 4 The authors proposed an integrated production and maintenance optimization model, which aims to determine the optimal production plan and maintenance strategy. In addition, Hnaien et al. studied MCLSP, integrating production planning and preventive maintenance (PM) strategy for a single machine. 5 Their objective is to minimize the sum of production, PM, minimum repair, set-up and backorder costs. In the same way, an extension of dynamic lot-sizing models with multi-item is the fact of considering the cost of time-varying production set-up. The authors considered the time-varying production environment. 6 Their model takes into account the set-up cost, storage cost and production capacity. They have proved that their model allows them to efficiently search for high-quality solutions. Thereafter, Wang and Liu addressed the issue of economic production quantity (EPQ) as part of joint production and maintenance management. 7 The main objective is to determine simultaneously the optimal number of inspections, the inspection interval, the EPQ level and the PM level. More recently, Liao has addressed an EPQ model for a production and maintenance integration issue. 8 The production system produces both conform and non-conform items. A PM is programmed to reduce system deterioration. The aim is to simultaneously determine the size of the production lot and the PM schedule.
Secondly, the integration of maintenance, quality and production has been the subject of research over the past decades. In addition, research has jointly addressed production, maintenance and quality for a simple production system consisting of a single machine. Recently, Hajej et al. have considered a deteriorating production machine, which produces both conform and non-conform items. 9
They assumed that the deterioration of the production system impacts the quality of manufactured items. PM actions are being implemented to reduce the deterioration of the system. Their purpose is to optimize the sum of production, inventory, maintenance and defective costs. In another paper, Gouiaa-Mtibaa et al. considered that a production system subject to a random failure rate produces three types of items: high-quality conformities, lower quality items and non-conformity items. 10 In order to improve the quality of second-order and non-conforming items, a retouching activity is carried out. Their purpose is to determine simultaneously the number of batches produced and the number of PM actions. Other references have been extended from a single machine to multiple machines. Recently, Azadeh et al. have jointly addressed production, maintenance and quality for a manufacturing system consisting of a production line. 11 The authors used simulation for modelling. Their purpose is to determine simultaneously the thresholds for non-conforming and the maximum rate of non-conforming units as well as the stock size. In addition, Beheshti Fakher et al. have studied a system composed of parallel multi-machines manufacturing multi-item. 12 The authors studied the capacitated lot-sizing problem (CLSP), including the purpose of determining the PM level, number of inspections, production level, backorder level and inventory level. To solve the problem, the authors used genetic algorithms (GAs) and taboo search. In the same context, the approach of Nourelfath et al. is to integrate production, maintenance and quality for a multi-item and multi-period CLSP. 13 The aim is to jointly select optimal values for the production plan and maintenance policy, taking into account quality costs. The research work of Bouslah et al. has jointly optimized production, quality control and maintenance for a production line. 14 Their study consists in proposing a combination of a mathematical model and simulation to simultaneously determine the optimal values of three decision variables: PM age, quality control level and inventory level. In the same way, Tam et al. studied the problem of integrated maintenance planning in production, the objective is to determine an optimal production and PM plan, while simultaneously minimizing production and PM costs. 15
For strategic reasons, subcontracting has become an important means to reduce costs and improve quality within the company. Some consider that lack of production capacity, cost problems and high specialization justify the need for subcontracting. In the same context, Haoues et al. studied the integrated problem of production and maintenance associated with subcontracting strategies. 16 The objective of their research is to determine in-house production, subcontracting and maintenance plans. Indeed, Rivera-Gomez et al. have developed an optimal stochastic control model based on the deterioration of the manufacturing system. 17 Their model consists in integrating subcontracting strategies into production and maintenance policies.
The model’s goal is to minimize the overall cost including production cost, subcontracting, inventory, backlogging, PM, defective items and repair costs.
Article contribution
This article is an extension of our previous research. Authors proposed a model for optimizing subcontracting as part of an integrated production and maintenance policy. 18 The authors considered the complex case, that is, a production system composed of several machines producing a single product, whereas this document deals with a single machine producing multiple item of conforming and non-conforming quality. This is justified by the fact that the degradation affects the quality of the items manufactured by the ordering company. We mention that there are few papers that have discussed the problem of combined management of production planning, maintenance strategy and quality control. At this level, we focus on the joint optimization of production, maintenance and quality associated with the subcontracting strategy. Indeed, our approach addresses MCLSP with set-up time. More clearly, the integrated approach seeks to improve system quality and reliability while minimizing costs. Hence, we consider the dependence between the quality of the manufactured items and the reliability of the production equipment. The aim is to find a balance between internal production, quality control, maintenance and subcontracting strategies. With regard to reliability and maintenance, we consider that our production system is subject to a progressive degradation process. The failure rate depends on time and production rate. As a result, the increase in degradation leads to an increase in the failure rate and the rate of defective items. Therefore, the maintenance policy takes into account the effects of deterioration.
Indeed, the subcontracting strategy consists in choosing the most optimal subcontractor among several. Nevertheless, some studies do not give sufficient consideration to the motivations for subcontracting. The approach presented in this document is distinguished by the following characteristics: The manufacturing system consists of a single machine manufacturing multiple item. The production system must satisfy MCLSP. The set-up time is not negligible. The production system is considered imperfect. We integrate the three functions: production, maintenance and quality. The lack of ordering company capacity and the non-conformity of manufactured items by the ordering company justify the use of subcontracting. We consider the logistical constraint for the choice of subcontracting.
Therefore, minimize the sum of PM and repair costs, production costs, quality costs, subcontracting costs. Hence, we are inspired by the model presented by the literature. 4–5,12 Our model differs in the nature of the production system. The latter consists of a machine from the principal manufacturing several types of items as well as the subcontractor who completes the lack of demand. The difference between our approach and that of Beheshti Fakher et al. is considering set-up time as well as machine degradation. This is because the authors considered that the degradation depends on the age of the machine. 12 On the other hand, the degradation of our model depends on failure rates. At the level of the strategy for the choice of subcontracting, we have considered subcontracting capacity, and subcontracting unit cost and the logistical constraint, which is the distance between the subcontractor and the stock. The proposed control policy indicates the production rate of ordering company, the subcontracting rate, the inventory rate, the backorder rate, the PM rate, as well as the number of inspections during each period of the horizon. Then, we compare the results of our approach with the results of Beheshti Fakher. 19
System description and problem definition
Notations and hypotheses
The notation shown below is used in the paper set.
Model indices:

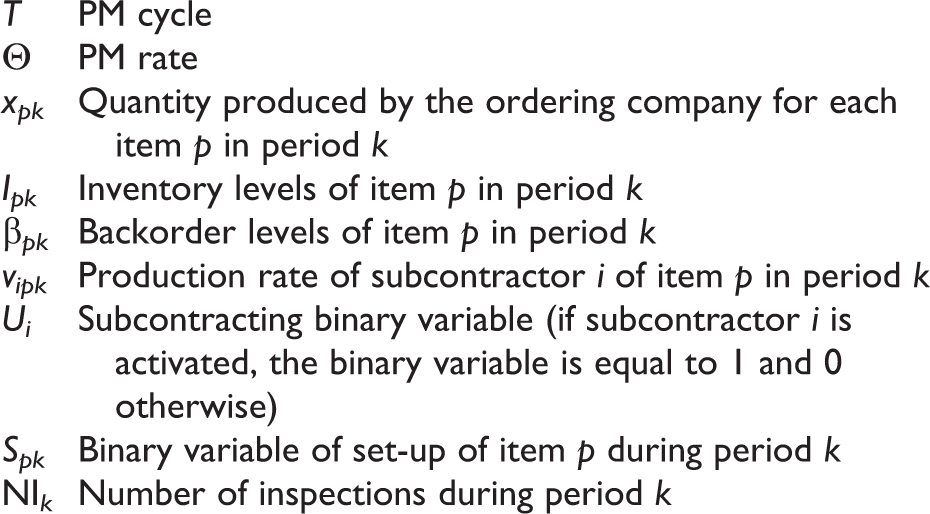
Decision variables:
Problem parameters:

Before establishing the analytical model, it is necessary to present the following assumptions: The customer demand can be higher or lower than the maximum production capacity of the ordering. The manufacturing system consists of a single machine manufacturing several types of items. The production system must satisfy the MLCSP. The ordering company process is considered imperfect, the machine can produce both conforming and non-conforming items. The items delivered by the subcontractor are all considered to be of high quality. Stock S containing the items manufactured by ordering company and the subcontractor. Customer demand is met from stock at the end of each period. The ordering company production system produces non-conforming items when the failure rate exceeds a limit level: λ
limite. The inspection is started as soon as the failure rate λ(t) reaches a limit level λ
limite. If a non-conformity is detected, the process must be adjusted.
Model description
We consider an imperfect production system that produces conforming items as well as other non-conformities from a certain level of degradation. The ordering company should satisfy customer demand with variable production rates. Our production system is composed of a single machine manufacturing several types of items. The production must satisfy the constraint of MCLSP. Over time, ordering company receives client demands from
The machine requires a quality control strategy to be established to deal with non-conformity of manufactured items. The quality strategy includes process inspection, machine adjustment and quality control. The system is subject to a degradation process with an increasing rate. In fact, the deterioration of equipment affects the quality of the items and the reliability of the machine, hence the need to implement a PM strategy in order to reduce the impact of deterioration processes and minimize the non-conformities. The integration of maintenance, production and quality decisions can reduce non-conformity of manufactured items, downtime and also total expected total cost. Our approach is characterized by: multi-item, system degradation, subcontracting strategy, logistics dimension and quality control. In this article, we will study the problem of integrated planification of maintenance, production and quality in the case of a production system manufacturing several types of items by adopting the subcontracting strategy (see Figure 1).
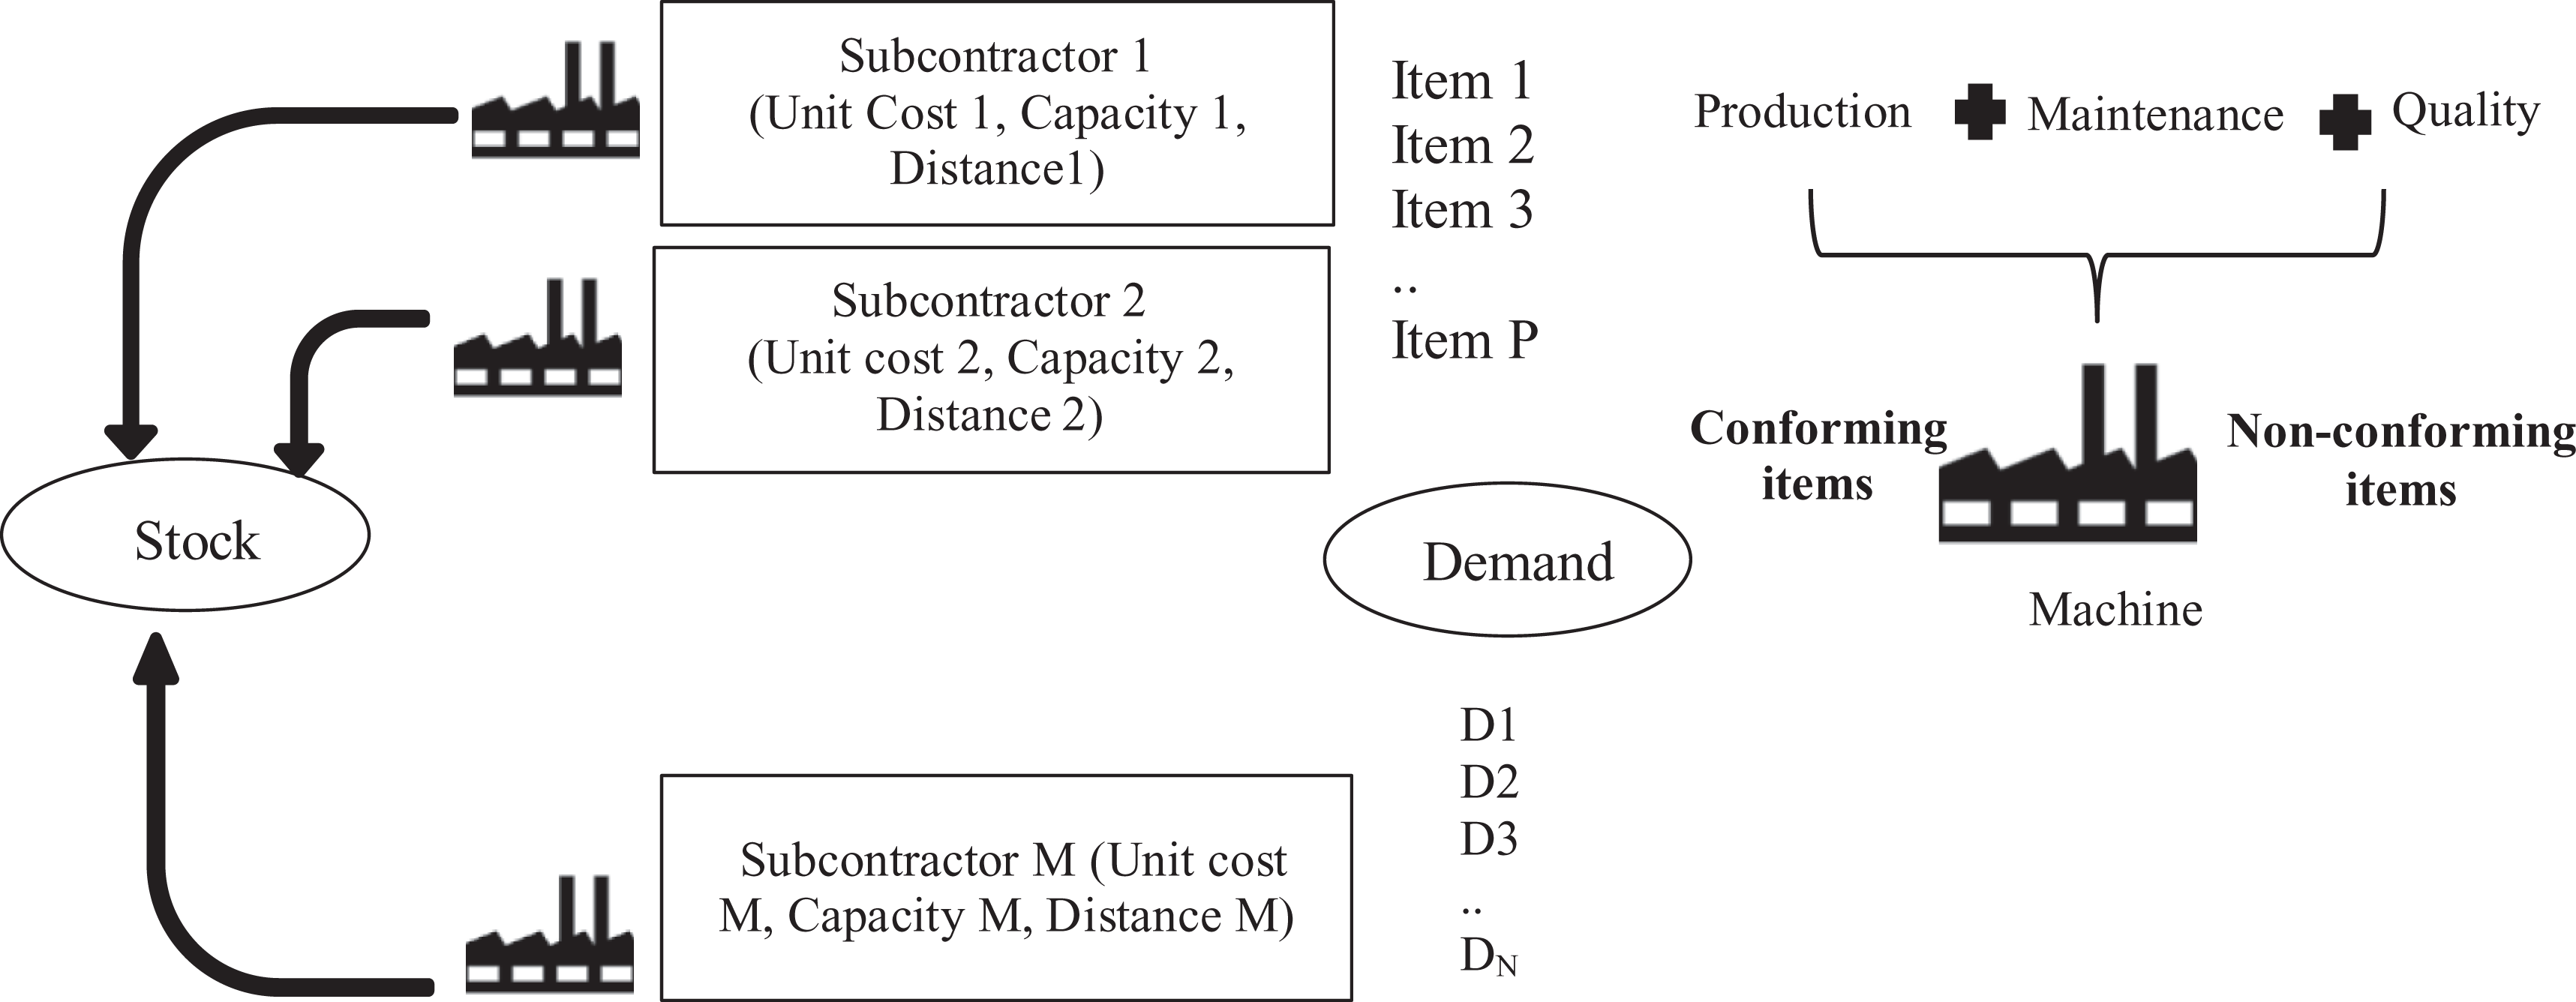
Industrial system.
Formulation of the model
System degradation
Deterioration modelling has an effect on the quality of the manufactured items and the reliability of the production machine. This is because we consider the dependence between the failure rate and the conformity of the manufactured items. We indicate that failure or unreliability F(t) means the probability that a machine will fail before time k.
In other words, the failure function is the probability that a system can change state into out of control state before the time k. As a result, the increase in the failure rate leads to the appearance of defective items. Figure 2 shows the dependence between the failure rate and process inspection.

Dependence between failure rates and process inspection.
We consider that manufacturing defects result from the degradation of reliability. Consequently, the probability of transition to an uncontrollable state at time k is represented by

Integrated control of production, quality and maintenance with the constraint of subcontracting
Production strategy
The ordering company takes charge of the production of part of the demand. Consequently, the total production cost (PC) of ordering company represents the sum of the processing cost, set-up cost, inventory holding cost and backorder cost. 5

With regard to the constraints of the production strategy, we will have the set-up constraint, the flux conservation constraint and finally the capacity constraint.
Set-up constraint
The set-up constraint allows to force that the production level

Flux conservation constraint
The balance constraint or the flux conservation constraint. It represents the sum of the inventory of the item p at the end of period k is equal to the inventory of the previous period plus the total production of the ordering company and subcontractor in the same period, minus the customer demand in that period. We also keep the amount of subcontracting compared to the reference. 5

Capacity constraint
The capacity constraint characterizes the lot-sizing part. It represents that the total production must be less than the available time of production in period k.
We note that the total production time is the sum of the manufacturing time plus the set-up time.

Regarding the available production time represents the fixed time of all periods, minus the repair time of the same period minus the set-up time per item p in period k. 12
Consequently, the number of failures expected in each period k is represented by

Subcontracting strategy
The subcontracting strategy consists in selecting the optimal subcontractor among several. Indeed, each subcontractor i is characterized by a unit cost of subcontracting Csub
i
, a maximum production capacity of subcontractor
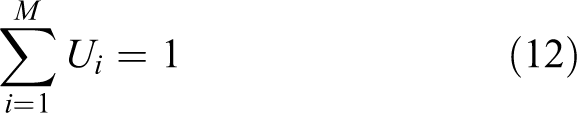
In addition, we introduce a binary variable characterizing the choice of subcontractor i.

We consider that there is no proportionality relationship between the trio Csub
i
,

Admittedly, the subcontracting strategy contains three constraints. The first is the utility of subcontracting constraints. The second constraint represents the upper and lower limits of the subcontracting rate and finally the logistical constraint.
Constraint on the utility of subcontracting
Subcontracting is adopted if the cumulative demand is greater than the size of the lots. 21

Upper and lower limit of the subcontracting rate
Each subcontractor has production limits.

Logistics constraints
The logistical constraint makes it possible to choose the closest subcontracting geographically. As a result, our strategy allows us to choose a single subcontractor during the periods of the planning horizon. Indeed, it is necessary to add the constraint that makes it possible to force the choice of a single subcontractor.

Quality control policy
We assume that our process is imperfect. This means that the system produces non-conforming items from a certain level of degradation. To detect the hazards of the production process, we carry out successive inspections. The inspection of the manufacturing process depends on limit failure rates λ limite provided from the machine history. Subsequently during the inspection, if we detect the appearance of non-conforming items, the process must be adjusted. Therefore, all sub-lot parts must undergo a quality control process to isolate non-conforming parts. In addition, all non-conforming items are rejected. Figure 3 shows the quality control strategy adopted in our integrated approach.

Quality control strategy implemented.
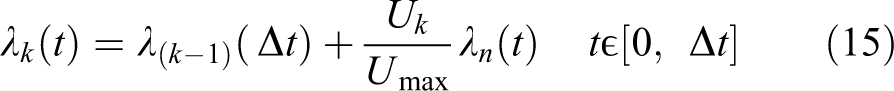
The quality control strategy consists of machine inspection, quality control and finally machine adjustment. Figure 4 shows the inspection strategy over time. Indeed, the process during each production period k undergoes successive inspections at the moment j. The number of process inspections during each period k depends on limit failure rates λ limite.

Process inspection.
In short, the cost of the total quality control strategy adopted (QC) is the sum of the inspection, adjustment and quality control costs.

We specify that the number of inspections is calculated according to the organigramme presented in Figure 5.

Procedure for calculating the number of inspections.
Maintenance policy
Certainly, PM in at pre-determined times n·T with (n = 1,…, θ), the PM actions are supposed to be perfect (as good as new). In addition, a minimum repair is carried out if an unplanned failure occurs between two successive PM actions (see Figure 6). We consider that the PM action time is negligible compared to the minimum repair time.
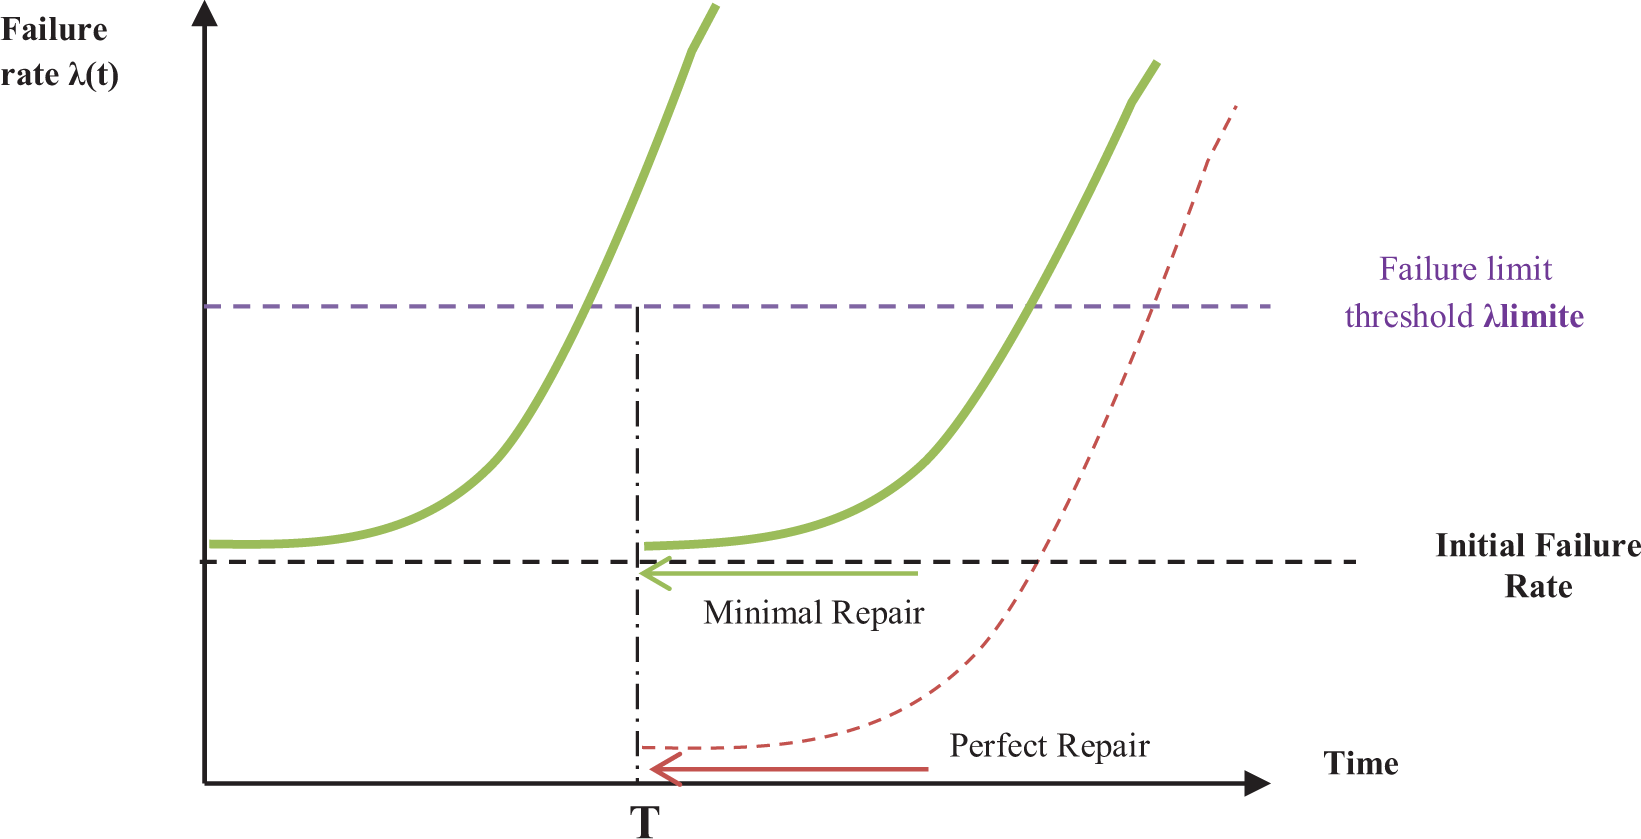
Evolution of the failure rate over time.
Indeed, the optimization of the maintenance strategy consists in determining the optimal PM rate

We consider that the degradation of the machine depends on time and production rate. Thereafter, the failure rate is expressed as following 1 :
We assumed that our production system produces multiple item (p = 1,…, P). Therefore, the failure rate can be expressed as follows:

We sum up all the equations, we get:

In other to say:

Therefore, the failure rate can be expressed as follows:

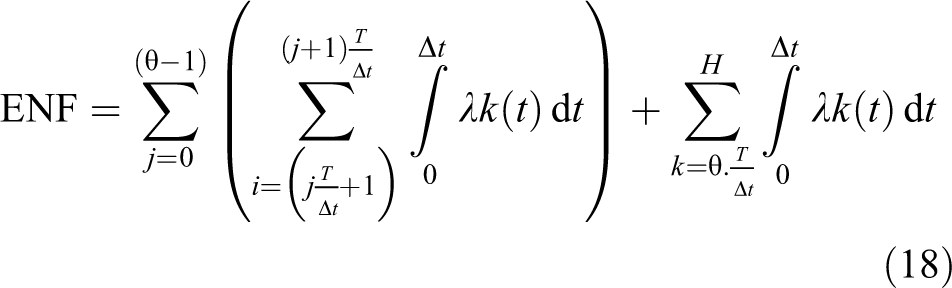
Then the number of failures is
Thus, the average number of ENF failures depends on the production rate at each period k and the PM rate θ.
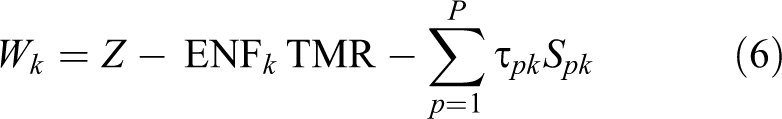
Consequently, the cost of the maintenance strategy is the sum of the PM cost and the corrective maintenance cost given by the following expression:

The total cost of the integrated approach is the sum of the cost of production, quality, maintenance and subcontracting.
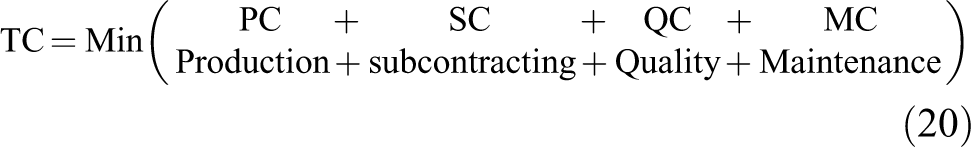
Minimize:

Subject to:


Optimization procedure
To solve our problem, we use an approximate method, since solving our model with an exact method is a little difficult. We applied the GAs to effectively solve our proposed mathematical model. In order to choose the parameters of the GAs, the experimental designs are implemented. The following section presents the Taguchi method to simplify the experimental design in order to highlight the influences of various factors on the response. We note that Taguchi’s method is characterized by a considerable reduction in the number of tests, while preserving a reasonable accuracy.
Taguchi method
Taguchi 22 developed statistical methods known as Taguchi methods to improve product and process quality. The methods consist of a number of experimental design approaches. The method aims to deliver as much information as possible with a minimum of testing, exploiting the factors that influence process performance. In addition, population size, maximum number of iterations, probability of crossing and probability of mutation are all critical factors that influence the optimization approach. Indeed, we use Minitab to obtain an orthogonal table where each column corresponds to the level of effects we want to analyse. We assume 27 sets of experiments from the distribution of the orthogonal table, and three levels have been assigned to each factor, as given in Table 1.
The levels of each parameter of the GAs.

GA: genetic algorithm.
Figure 7 shows the main effects generated by Minitab. The four factors considered must be adjusted, so that population size = 3000, number of iterations = 1100, mutation probability = 0.1 and crossover probability = 0.5.
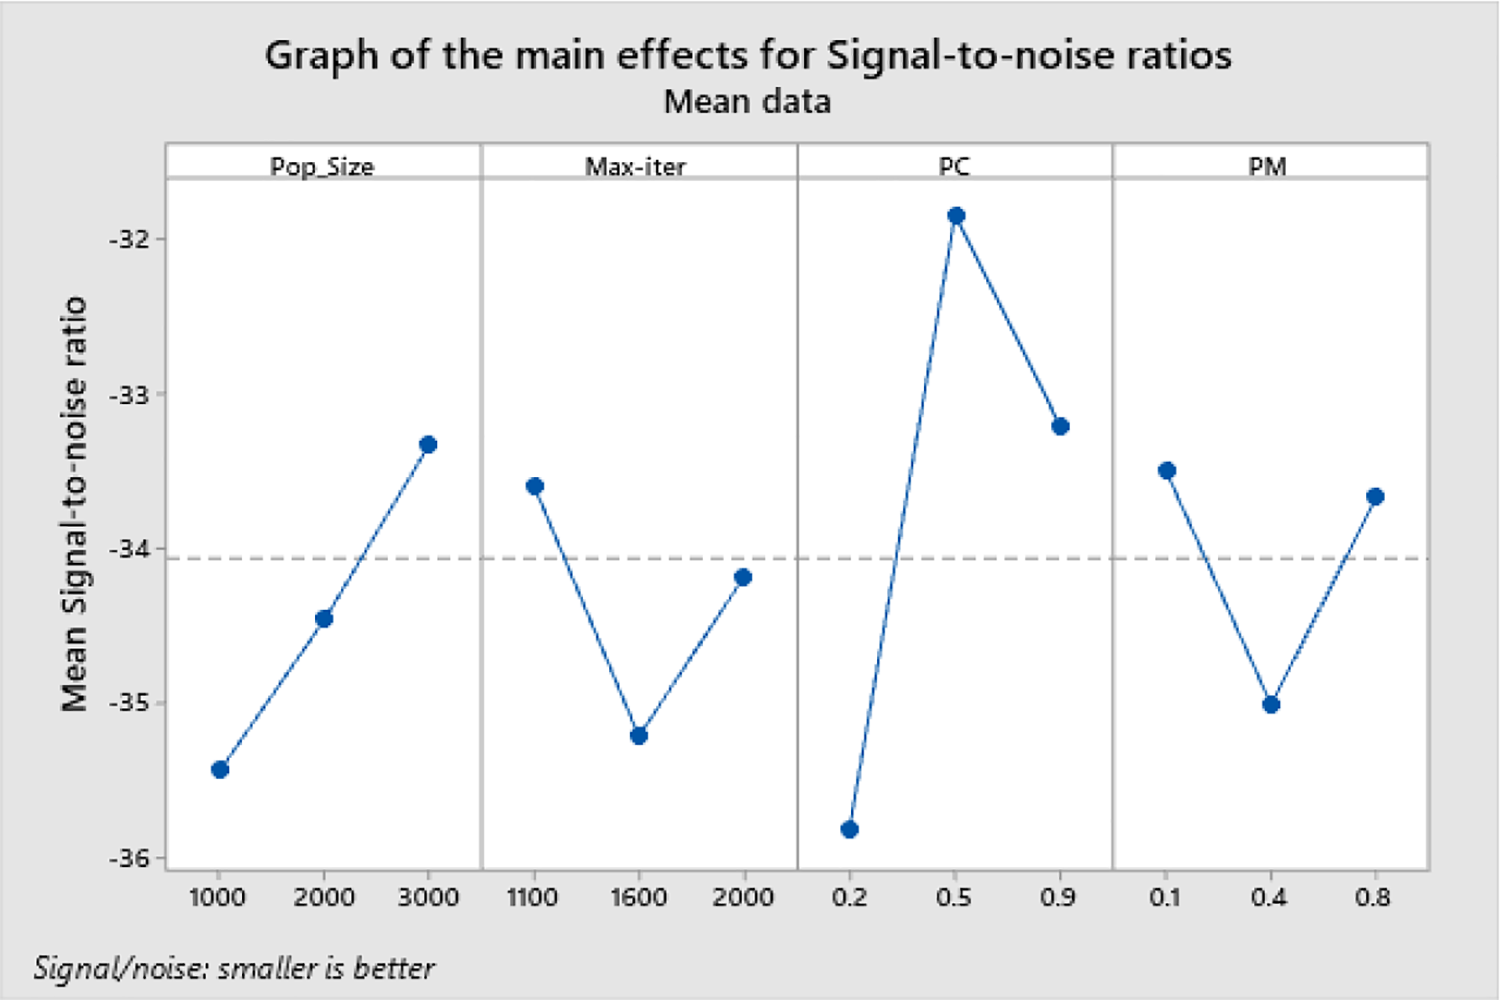
Graphical representation of the main effects of the ratio (S/B).
Table 2 presents the level of each selected factor in the optimization method adopted for system resolution.
Optimal parameters of GAs.

GA: genetic algorithm.
Integrated production control, maintenance and quality plan using subcontracting: numerical example
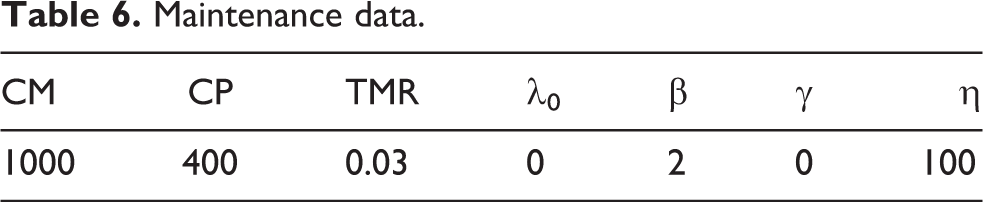
The input data are selected in relation to the study by Beheshti Fakher. 19 We consider a machine manufacturing two items P = 2 during 6 months H = 6). Our unit costs used in our approach are the average costs of Hossein Beheshti Fakher, in 2016, since the latter considered three machines manufacturing two types of items. It is assumed that the failure rate is represented by the Weibull probability law, with β, α and γ being respectively scale parameter, shape parameter and position parameter. The main data on the problem are presented in Tables 3 to 7.
Item demand.

Production data.

Quality data.

Maintenance data.
Subcontracting data.

Analysis and discussions
The best solution found using GAs is given in Table 8. The optimal cost value is equal to CAD $353,982, whose PC is equal to CAD $264,581, the quality cost is equal to CAD $1147, the maintenance cost is equal to CAD $1200.7 and, finally, the subcontracting cost is equal to CAD $86,963. Concerning the maintenance strategy adopted, the PM rate is equal to 4.
Results obtained by the GAs.

GA: genetic algorithm.
Integrated modelling is not simple, as it is usually multi-criteria and multi-objective. Through our model, we have shown a significant interaction between the three functions: production, maintenance and quality, taking into account the subcontracting constraint. First of all, we notice that the number of inspections increases over time. Indeed, during the two periods k = 1 and k = 2, the number of inspections is zero, since the failure rate does not exceed the value of the limit failure rate. Then, in the third period, the number of inspections increases from 1 to 4 and then from 4 to 11, as the failure rate is considered cumulative. Although the quality cost QC is considerably noticeable, the quality control strategy, in turn, allows the company to avoid the delivery of non-conforming items to these customers in order to maintain the good image of the ordering company.
In Figure 8(a), we present the variation of quality cost as a function of time, as well as the variation of the number of inspections during each period for three values of limit failure rate such as: λ limite2 < λ limite1 < λ limite3 (Figure 8(b)). Afterwards, we note that the smaller the λ limite, the lower the number of inspections and the lower the cost of quality and vice versa. Therefore, it is necessary to reduce the degradation of the machines by carrying out maintenance actions to prevent the increase of the cost of quality. It is also important to determine the limit failure rate λ limite, this parameter makes it possible to detect defects at the right time and thus avoid wasting the surplus cost of quality.
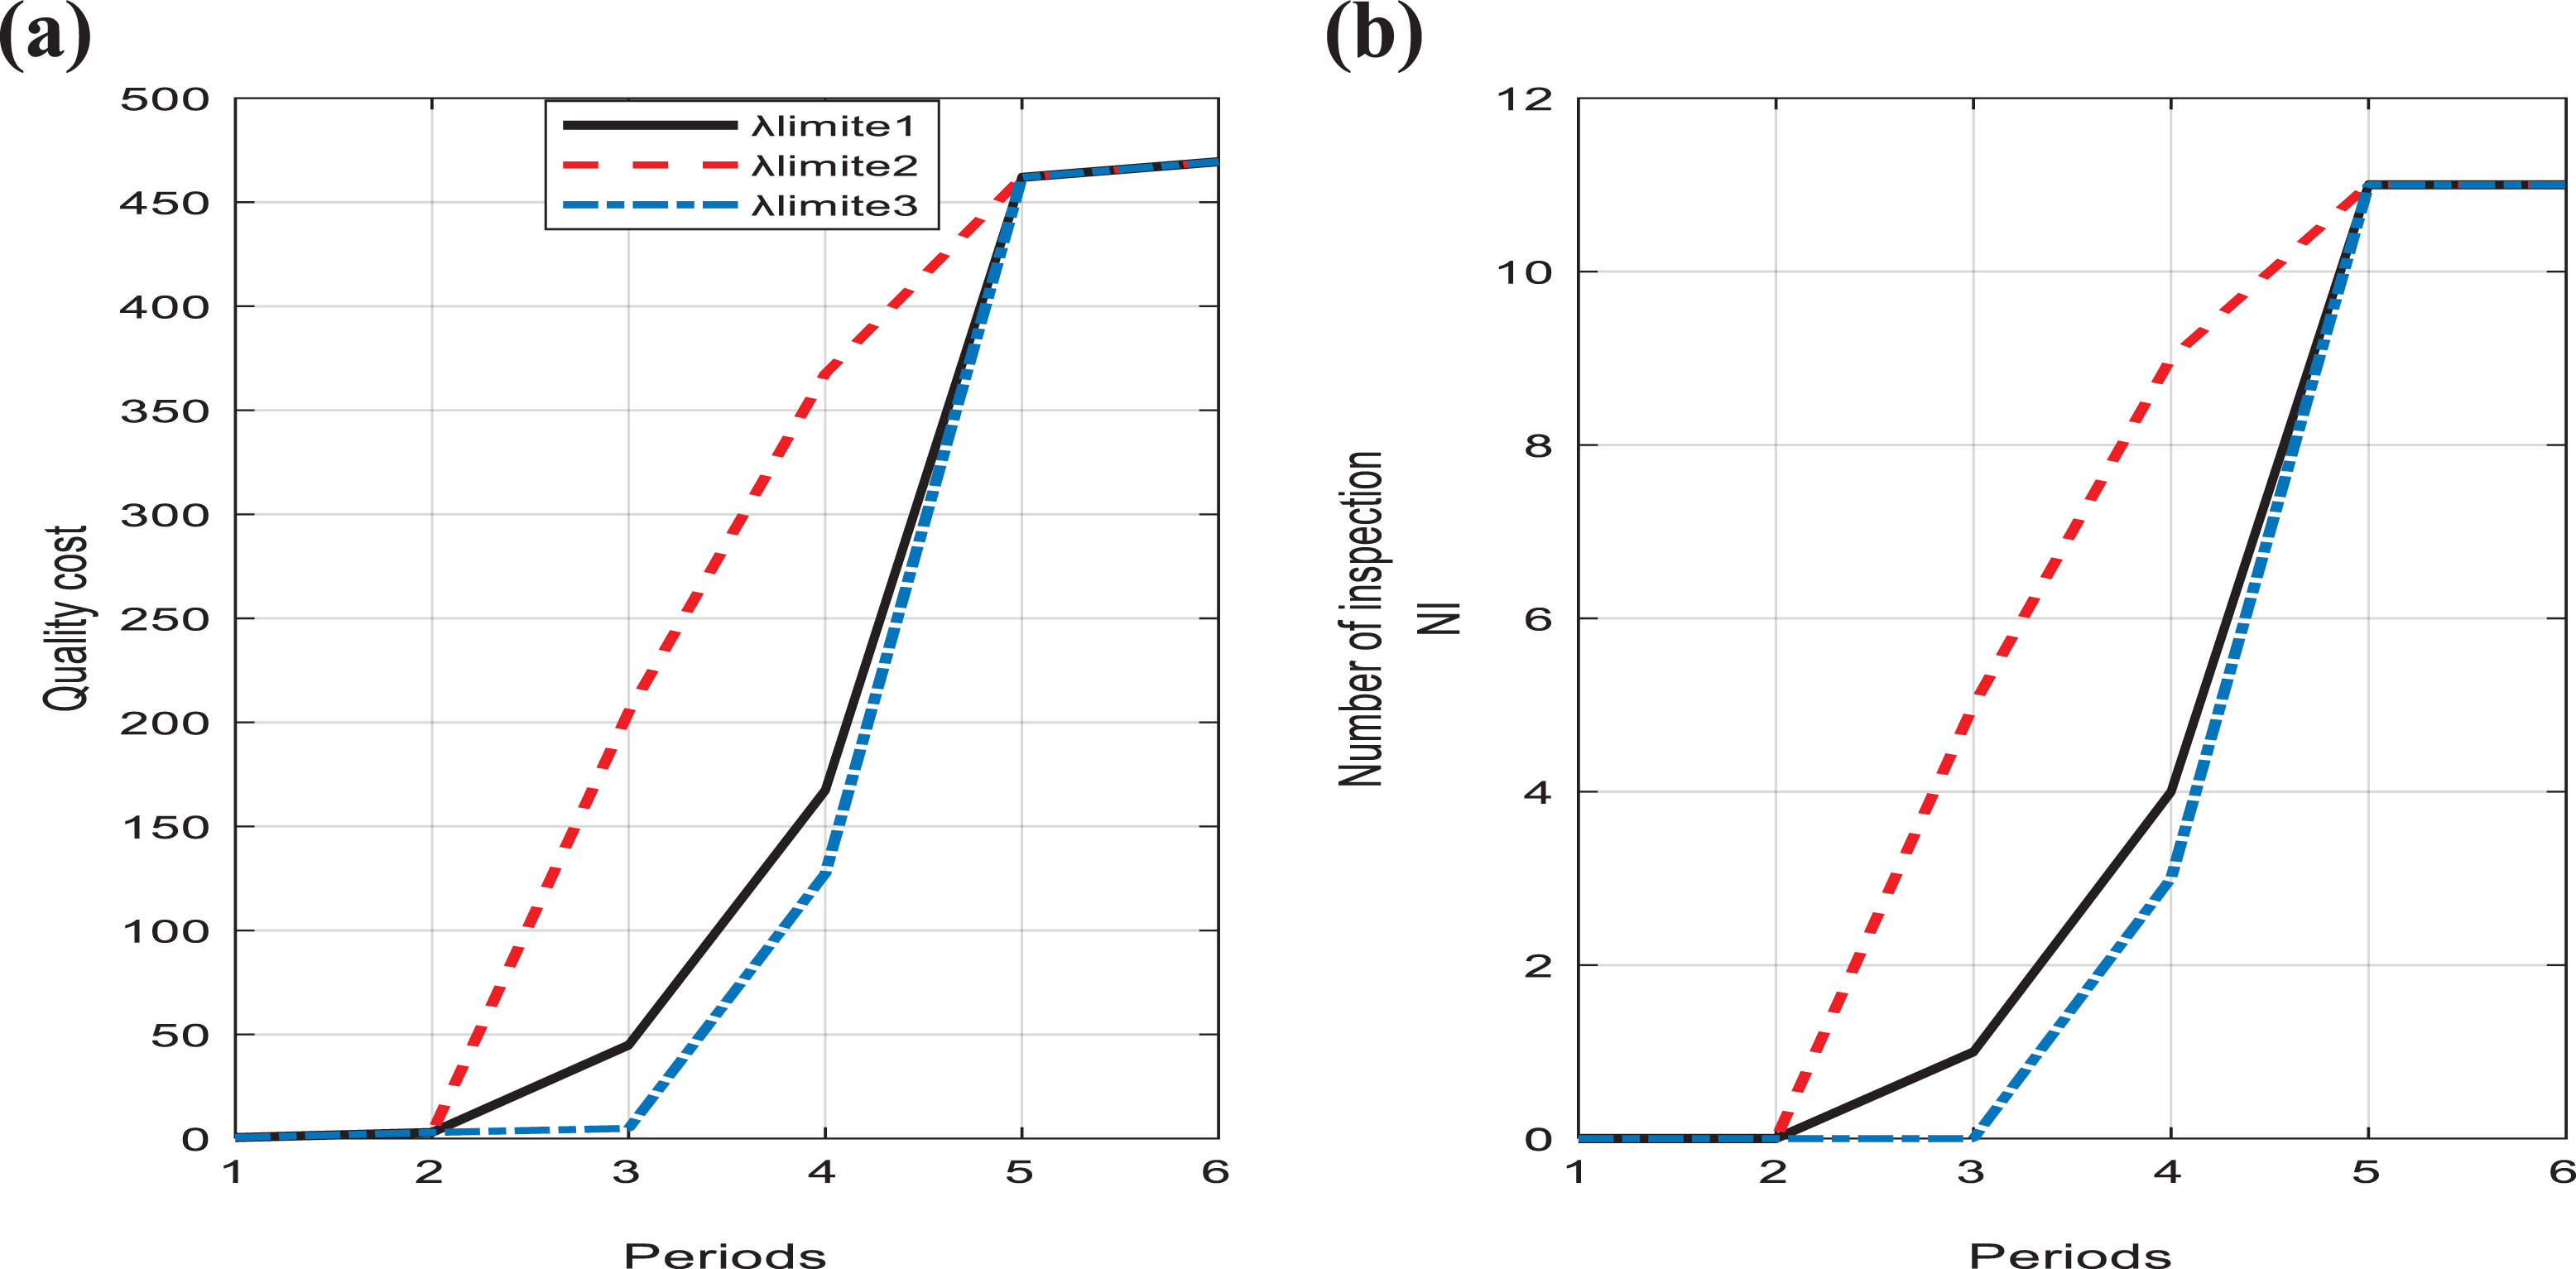
Influence of limit failure rates on (a) quality cost and (b) number of inspections.
With regards to the production strategy, we indicate that the production rate is variable over the six production periods according to customer demand, as shown in Figure 9.

Variation in the production rate and subcontracting rate.
In other words, the production rate for both products did not reach the maximum or minimum production rate.
Figure 10 mentions that the cumulative total cost when the production rate fluctuates is minimal with regard to the cumulative total cost when the production rate is maximal. This favours manufacturing with a variable rate. This is because the ordering company can manufacture at maximum capacity and subcontracting is used if regular production is at full capacity. However, the cumulative use of ordering company manufacturing machines can precipitate machine degradation and thus increase the risk of failures, defects, delays, and so on. As a result, maintenance costs, the risk of production line downtime and the number of defective items increase.

Comparison of the cumulative total cost of production rate when the variable and maximum production rate.
Subcontracting has made it possible to bridge the gap between internal production and customer demand. In addition, the constraint of subcontracting provides items without defects. However, subcontracting is not always justified by the inability to produce, but also by the need to consider the issue of cost minimization. This is justified in a period when demand is lower than the maximum production capacity (period 3), demand is met through internal production and subcontracting (see Table 8). Despite the high costs generally offered by subcontractors, in-house manufacturing also generates production, quality and maintenance costs. In other words, the criterion of subcontracting cost indicates that the minimum unit cost of sale should be set to be profitable for the ordering company. Thereafter, among the three subcontractors, the second subcontractor is the most optimal. Because, despite the fact that the second subcontractor charges a high transport cost, the unit cost of subcontracting is minimal. As a result, the ordering company must expand the geographical area of selection of subcontractors, as sometimes subcontractors far away geographically may offer minimum rates.
Certainly, our model is based on the principle that degradation influences several machine performance indicators, mainly focused on the quality of the items produced and the reliability of the machine. Maintenance actions can reduce machine deterioration as well as improve product quality and machine reliability.
We note that, to compare our results with, 19 we used average unit cost values. Since our production system is composed of a single machine producing two types of items, using subcontracting. While, the production system is composed of three machines manufacturing two types of items. 19 To compare the results, we take into account the budgetary limitation of PM actions as well as the cost of PM achieved by our approach.
We note that the optimal total cost found using our approach is minimal, by comparing it with the optimal total cost of the reference 19 (see Table 9). This shows that subcontracting is a solution for manufacturing industry to meet the missing demand and to minimize the total cost.
Results comparison.

Sensitivity analysis
In this section, we conduct a succession of experiments using numerical examples. Indeed, the proposed sensitivity analysis indicates a policy for controlling production costs, quality maintenance and subcontracting. The results presented in Table 10 indicate the different configurations present and compared to the reference state. In the following, we present the impact of each unit cost on the decision variables and on the total cost.
Sensitivity analysis and control policy setting.

Bold values represent costs where unit costs vary.
Variation of production parameters
We note that the increase in the unit cost of manufacturing leads to a decrease in production rates, which favours the use of subcontracting. The PM rate and quality cost are decreasing, which justifies that quality costs are strongly linked to production and maintenance costs. Conversely, when the unit cost of internal production decreases. Moreover, the variation in the unit cost of the set-up does not influence the decision variables, since the ordering party is obliged to produce to satisfy customer demand at the end of each period of the planning horizon. With regard to the increase in the unit cost of inventory. Ordering company reduces in-house manufacturing, which reduces the number of inspections and the rate of PM. Because the decrease in the internal production rate delays the degradation of the machine. Then, we find that the increase in the unit cost of backorder, the ordering company manufactures more to avoid delay costs, as well as to keep the good image of the company. The contribution of subcontracting is also important. On the other hand, the maintenance rate and the number of inspections decrease so that the machine is more operational.
Variation of quality parameters
We find that when we increase the unit costs of quality (inspection, adjustment and quality control), the number of inspections is reduced, hence the decrease in the production rate because the company can achieve high costs in the event of manufacturing with maximum in-house production rate. Indeed, the contribution of externalization is also important, since the subcontractor produces items of conforming quality. PM actions are delayed in order to make the machine group as operational as possible. The PM rate increases, so that the machine is kept in a controlled state.
Variation of subcontracting parameters
We note that the increase in the unit cost of externalization as well as the unit cost of transport reduces the subcontracting rate and increases the internal production rate. Indeed, the machine is more used, which increases the PM rate to reduce the deterioration of the machine. Then, the increase in the production rate leads to an increase in the number of inspections in order to avoid delivering non-conforming items to the customer. Conversely, when the unit cost of externalization and transport decreases.
Variation of maintenance parameters
We notice that the increase in the unit cost of PM reduces the PM rate. In order to avoid machine degradation, the production rate decreases, resulting in a decrease in the number of inspections. To satisfy customer demand, the subcontracting rate increases. Then, increasing the unit cost of corrective maintenance leads to an increase in the PM rate, in order to avoid frequent machine breakdowns.
In addition, the production rate decreases to avoid machine degradation, resulting in a decrease in the number of quality inspections. In order to satisfy customer demand, subcontracting is favoured, hence the increase in the subcontracting rate.
Conclusion and perspectives
The proposed control policy consists in optimizing subcontracting as part of an integrated approach to maintenance, production and quality. In other words, the determination for each item of the production rate, the subcontracting rate, the PM rate, the number of inspections during each period. In addition, we proposed an optimal strategy for choosing a permanent subcontractor. The choice is based on three criteria: the unit cost of subcontracting, the maximum subcontractor capacity and the distance between the subcontractor and the stock. Then, we treated the influence of the variation in the production rate on the machine degradation considered by the failure rate as a function of time and production rate. Finally, we proposed a quality control strategy that allows us to inspect, adjust and control the process, based on limit failure rates λ limite provided from the machine history. In perspective, it would be useful to conduct studies on more complex cases to deal with multi-item and multi-machines production systems, as well as to study the switching between several subcontractors.
Footnotes
Acknowledgements
The authors would like to thank the editors and anonymous reviewers for their useful comments and their constructive suggestions, which helped to improve this article, in order to make it appropriate for publication in International Journal of Engineering Business Management.
Declaration of conflicting interests
The author(s) declared no potential conflicts of interest with respect to the research, authorship, and/or publication of this article.
Funding
The author(s) received no financial support for the research, authorship, and/or publication of this article.