
Abstract
This study explores the connection between oil price, stock prices, and exchange rate in Kazakhstan employing a monthly data from October 2007 to December 2017. Time series data were collected from National Bank of Kazakhstan, Kazakhstan Stock Exchange, and Energy Information Administration. Both bivariate and multivariate cases were employed. At the same time, the Johansen and Juselius cointegration procedures were employed in the study. The analysis was conducted for bivariate as well as multivariate cases. Empirical tests demonstrate that all the series are nonstationary in levels but stationary in differences. Results of this analysis do not find long-run correlation between the variables in a bivariate model, however, detect one in a multivariable model. Results demonstrate that stock prices and exchange rate are affected by oil price in Kazakhstan based on Granger causality test. Our findings imply that policy wise, monetary authorities in Kazakhstan in attaining their exchange rate policy objective should be considering the implications for financial market. These results are important to regulatory exchange authorities when deciding on policy to improve the market conditions.
Introduction
Based on the International Monetary Fund Report, starting the early 2000, the Kazakhstani economy was growing rapidly with the average growth rate of 9% annually with the most of this growth attributed to the oil export. Indeed, Kazakhstan possesses substantial oil reserves and relies heavily on revenues from their export. However, Kazakhstan’s dependence on these export revenues makes its economy vulnerable to external oil price fluctuations. With sharp spikes and drops, oil prices fluctuations could have substantial destabilizing effect on Kazakhstani economic activity. Destabilization of economy might be happening through equity and currency markets that play an important role in economic development. With fluctuating oil prices, both markets would be affected and, in turn, have adverse impact on economic activity in the country. As a result, questions of how foreign exchange markets and stock markets are affected by oil prices, whether these markets are related, and what is the direction of the relationship have been receiving extensive attention. Yet, there is no empirical and theoretical agreement on these issues. Despite the existing fields of literature on relations between oil prices and stock prices, and interactions between oil prices and exchange rates, there is a lack of research on relationships between these two fields, especially in the framework of emerging markets. 1,2
It is popularized and discussed that one transmission channel for oil price to affect the economy of the country is through its influence on the exchange rate. In general, an increase in the oil price leads to appreciation of domestic currency. Though, Chen and Chen 3 and Lizardo and Mollick 4 propose different interactions between oil prices and exchange rate, in particular, their results imply that in the long run, an increase in real prices of oil results in a depreciation of the real exchange rate. (These contradicting results might explain ambiguity of the existing empirical research on the effect of oil prices on Kazakhstani exchange rate. While Kutan and Wyzan 5 show that oil price changes significantly affect the real exchange rate, specifically, increase in oil price results in appreciation of the real exchange rate, Kohronen and Mehrotra 6 claim that oil price shocks do not explain movement in real exchange rate.) Turning to the influence of oil prices on stock market, many studies demonstrate that fluctuations in oil prices have considerable impact on economic activity and, as a consequence, it can be expected that oil price fluctuations have an impact on stock markets. At the same time, impacts of oil prices on economic situation are expected to be dissimilar for oil-producing and oil-importing countries. While a rise in oil price could be considered as positive for oil-exporting countries, it is considered detrimental for oil-importing economies. Moreover, Sadorsky 7 and Park and Ratti 8 show for oil-importing countries that increasing oil prices have a tendency to decrease the stock market index, while Nandha and Faff 9 and El-Sharif et al. 10 demonstrate positive correlation between oil prices and equity values for oil and gas sectors.
Since export earnings contribute extensively to the growth rate of the Kazakhstani economy, it is of great interest how depreciation or appreciation of the exchange rate resulted by oil export revenues would affect stock prices. For Kazakhstani economy to continue grow and prosper, it is crucial to understand the interactions between oil prices, stock market prices, and exchange rates. Unlike other markets in North America, Europe, and Asia, the Kazakhstani stock market lacks the depth and liquidity. As a result, increases of stock prices in Kazakhstan would not be expected to lead to an appreciation in the value of the Kazakhstani tenge. The results of this study therefore have practical value for policymaking as it provides insights into the specifics of the co-movement between stock prices and the exchange rate. For economies that are engaged into development of their financial markets while moving toward more flexible exchange rate (see e.g. Abdalla and Murinde 11 who investigated the issue for India, Korea, Pakistan, and the Phillipines), as a case of Kazakhstan, understanding of this issue is particularly crucial.
For policymakers, the relationship between stock prices and exchange rate is of big importance since swings in foreign exchange and equity returns cause significant fluctuations in international investment positions. 12,13 The results of this research also matter to international equity investors since investors holding foreign stocks are usually exposed to exchange rate fluctuations. For investors, decision-making related to hedging foreign exchange risk will depend, along with investment decision, on the relationship between equity and currency returns.
Still, despite the importance of interaction between stock market and exchange rate for economic development, there is a lack of empirical research on the nature of this relationship in Kazakhstan. This study aims at contributing to closing this gap in the literature and explaining the nature of the interaction between stock and currency returns. Given the Kazakhstan’s dependence on oil revenues, it is also of big importance to investigate whether both stock and currency markets are affected by oil price fluctuations.
Our results demonstrate that there is a causality running from exchange rates to stock prices and vice versa in Kazakhstan, demonstrating that exchange rate and stock prices mutually affect each other in the short run. This short-run bidirectional causality might be explained by the fact that both exchange rate and stock market in Kazakhstan are Granger caused by oil prices. These short-run results also hold over the long-run horizon. Indeed, there is a long-run relationship between oil prices and real effective exchange rate in Kazakhstan. At the same time, there is a long-run interaction between oil prices and stock market in Kazakhstan.
The aims of this study, therefore, are threefold. The first objective of this research is to extend the empirical evidence and establish the strength and direction of the impact of Kazakhstani exchange rate on the Kazakhstani stock price movements. Second, we add to scarce empirical research on the effect of oil prices for Kazakhstani economy by examining the importance of oil price for Kazakhstani stock market. Third, we investigate the vulnerability of Kazakhstani economy to Dutch disease by analyzing the effect of oil prices on Kazakhstani exchange rate. For this purpose, data were collected from the website of Kazakhstan Stock Exchange (KASE), National Bank Statistical Bulletin, and US Energy Information Administration. The main variables employed are oil price, Index KASE, and exchange rate between US$ and Kazakhstani tenge.
This article is organized in the following way: The second section is a literature review. The third section reviews the data analysis. The fourth section explains methodology. The fifth section reports and discusses the empirical results and the last section concludes the study.
Literature review
There are several literature strands related to the relationship between oil prices, exchange rate, and stock markets. First strand of literature investigates the nature of link between oil price and stock market. 8,14 –18
Some research has shown that the oil prices influence stock prices in an asymmetric way so that the correlation between oil prices and stock market activity is not linear. While some research demonstrates that increases in the oil price have a greater impact on stock prices compared to the effect of price declines, 19 the other research concludes that decreases in oil price affect stock prices stronger. 20 –24 Moreover, when examining the long-term relationships between oil prices and stock markets, El Hedi Arouri et al. 19 show that the responses of stock prices vary substantially from sector to sector. Particularly, responses of stock prices to changes in oil prices are greater for oil-intensive industries compared to other industries.
Previous studies related to the influence of oil prices on stock market have found different results for oil-importing and oil-producing countries. In general, for major oil producers, research establishes a positive interaction between oil price and equity prices . 10,25 While El-Sharif et al. 10 inspected this relationship for United Kingdom, Bjørnland, 25 using a structural VAR framework for Norway, demonstrated that oil price changes influence stock market only in the short run but has no significant effect in the long run. At the same time, for oil-importing countries, this relationship is negative. 7,9,18 Sadorsky, 7 estimating VAR model for the United States over the period 1947–1996, found that changes in oil price have a statistically significant negative impact on stock returns. At the same time, Huang et al. 18 found that oil price shocks do not significantly affect broad-based stock return indices. Results of Nandha and Faff, 9 who have investigated the influence of oil prices on various equity prices, demonstrate that increases in oil price negatively affect equity returns for all industries except the mining and oil and gas sectors.
The second strand of literature is related to the interaction between oil prices and real exchange rate. Golub 26 offers clarification for the nature of relationship between oil price and exchange rate, arguing that oil price affects all types of macroeconomic flows including current-account balances. While an increase in the price of oil creates a current-account surplus in Organization of the Petroleum Exporting Countries countries, it causes current-account deficit in oil-importing countries. Then, the subsequent reallocation of wealth between oil-importing and oil-producing countries may influence exchange rate. In general, an increase in the oil price results in the appreciation of domestic currency. 5,27 –33 However, Chen and Chen 3 claim that the interaction between oil prices and real exchange rate is opposite in nature and that in the long run an increase in oil prices results in a depreciation of the exchange rate. Similar results were found by Lizardo and Mollick. 4 Lizardo and Mollick 4 argue that increases in oil prices lead to depreciation of the exchange rate against net oil exporter currencies, such as Mexico, Canada, and Russia. Additionally, some studies failed to find a statistically significant interaction between oil prices and exchange rate. 34 Habib et al. 34 provide explanations of their results, claiming that oil exporters either accumulate foreign exchange reserves or peg their exchange rate, even when they have floating exchange rate system. Korhonen and Mehrotra 6 have found that a rise in oil prices results in appreciation of the exchange rate only in Iran and Venezuela. For countries such as Kazakhstan and Russia, the effect of oil price changes on real exchange rate was found to be insignificant. Akram 35 focusing on the Norwegian exchange rate found a statistically insignificant interaction between oil prices and the krone.
Some research focused on investigating the linearity of the interaction between oil price and the real exchange rate, that is, how the strength of the interaction between the exchange rate and the oil price varies across different levels of oil prices. 36 –39 Akram 36 demonstrates a negative nonlinear interaction between the oil price and the value of the Norwegian krone. The effect of oil prices on exchange rate has a strong impact on the exchange rate only for particularly low oil prices. Additionally, the strength of this interaction grows when oil prices follow a falling tendency.
The sharp increase in oil prices might lead to “Dutch disease” when resources are shifted from one sector of economy to another one. 40 As discussed by Jahan-Parvar and Mohammadi 41 and Kutan and Wyzan, 5 the inflow of oil revenues into exporting country would improve oil exporting country’s terms-of-trade. This results in higher spending of all goods, which consequently increases domestic prices compared to foreign prices, bringing a rise in the real exchange rate. As a result, oil price increase causes appreciation of local currency and reduces competitiveness in the non-oil exporting sector. Consequently, resources would be reallocated from the non-oil traded industry into the nontraded industry.
Finally, the last strand of literature is related to analyzing the interaction between exchange rates and stock prices. The traditional approach 42 states that exchange rate changes cause movements in stock prices, whereas the portfolio approach 43 argues that movements in stock prices cause movements in exchange rate. Moreover, the empirical research on the interaction between exchange rate and stock prices is also mixed providing support to both models. 2,44 –53 These studies have employed a variety of methods such as standard Granger causality, 54 error correction model, 55 Johansen cointegration approach, 56 Sims’ version of Granger causality test, 57 and the Toda and Yamamoto’s 58 causality testing method. Some studied utilized cointegration techniques to investigate the long-run interaction. The other studies employed impulse response functions and causality tests to investigate the short-run dynamics.
Asian financial crisis of the late 1990s renewed the importance of association between currency and stock markets in developing markets producing quite extensive research in this region. 59 –61 Ramasamy and Yeung 62 explain observed variability in the relationship between stock and currency markets to the developments and changes in market structures as well as to the stage of the economy’s business cycle.
Methodology
This section outlines the model employed to investigate the interaction between oil prices, stock prices, and the exchange rate. It also presents the unit root test for stationarity of time series, cointegration test of variables under consideration, and Granger causality tests.
Unit root
As a first step, consistent with most recent vector autoregressive (VAR) studies, we transform all time-series data into natural logarithm values. Usually first differences represent the growth rates. The following VAR model of order p (or simply, VAR (p)) is employed to investigate the dynamics between exchange rate and stock prices:

where yt is a (n × 1) vector of endogenous variables, c is the (2× 1) intercept vector of the VAR, Φ i is the i-th (2 × 2) matrix of coefficients, and εt =(ε 1t , ε 2t )′ is the (2 × 1) white noise process.
First, we check the stationarity properties of time series using the unit root test which is performed utilizing two standard procedures: the augmented Dickey–Fuller (ADF) and Phillips–Perron (PP) tests. These tests for stationarity are conducted as follows:

Cointegration test
After establishing the stationarity properties of the data series, the next step in analysis is to perform the cointegration test which checks the existence of long-run interaction between the variables. If the variables are stationary, but their first differences are non-stationary, then a vector error correction model (VECM) could be employed. For testing a cointegration among variables, cointegrating methodology of Johansen 56 is employed. Johansen 56 suggests testing cointegration through building a VECM:

where
Estimates of this model provide details of both short-run and long-run adjustments to any changes in yt . Estimates of Γi present information on the short-run, while estimates of Π contain information on the long-run adjustments. In VECM, the number of cointegrating vectors is given by the cointegration rank. Two different test statistics, the trace test statistic and the maximum eigenvalue test statistic, could be employed to test the cointegrating rank, r. Presence of cointegration implies a long-term interaction among the variables in question. In the presence of cointegration, any deviations from this equilibrium must be corrected. Moreover, if variables are cointegrated, noncausality between variables can be statistically excluded. The presence of cointegration implies the existence of temporal causality in the Granger sense between two variables in at least one direction. 63 This proposes two important channels that can explain changes in variables. One channel takes into account a short-term interaction between variables and shows the reaction of one variable to changes in another variable. The second channel specifies the adjustment process of variables to correct any deviations from the long-term equilibrium path. However, in the absence of cointegration between variables, there can only be a short-term interaction. In this case, to avoid spurious results, all variables must be expressed in the first differences.
Granger causality test
This section examines the short-run relationships among the variables under consideration employing Granger causality tests and combining the results of integration and cointegration tests. The direction of the causality may be examined based on the following equations:


where sp is the price of stock and er is the real exchange rate. Since variables sp and er are nonstationary I
1
series, they are expressed in differences. The null hypothesis of no causality from er to sp would imply Granger causality from sp to er. Granger causality from er to sp. Bidirectional causality from sp to er and from er to sp.
No causality
The causality model for the multivariate case is expressed as

where op is the oil price. If cointegration among variables is present, the model includes the error correction term. In multivariate case, more channels of causality could be determined.
Data
This analysis uses both the bivariate and multivariate frameworks generally employed in existing studies. 11,48 The bivariate framework incorporates stock price and exchange rate variables while the multivariate framework in this analysis includes the oil prices. Monthly data for the period from January 2007 to December 2017 are utilized for this analysis. End-of-the-month values of Kazakhstani Stock Exchange index (KASE) are employed as stock price. The exchange rate is measured using values of real effective exchange rate which is calculated as a weighted average of the foreign exchange value of tenge against a basket of the most traded currencies. Data for stock price were obtained from official website of KASE, while exchange rate data were obtained from official website of Kazakhstani National Bank. Oil price data comes from the US Energy Information Administration.
The data demonstrate a moderate increase in the KASE index until 2004. The huge change in the index was occurring toward the end of 2008, the most significant one happening in the February 2009. This is attributed to the devaluation of domestic currency that took place on February 9, 2009. This coincided with all changes happening in the global financial markets as a result of financial crisis. We implemented Chow test to check the presence of a structural change in data around that time and revealed the existence of a structural break. A dummy variable is included to capture this structural change, it takes the value of one from February 2009, and zero otherwise. The data of the real effective exchange are less cyclical because of the regime of intervention by the Central Bank of Kazakhstan into the determination of the exchange rate. As for oil prices, data demonstrate big volatility of commodity prices over the period 2007–2018.
Results
This section describes main results of integration and cointegration tests that were performed for analyzing the stationarity properties of data and Granger causality tests to investigate the direction of causation among variables.
Unit root tests
The unit root test was performed before the estimation of the model as a prior diagnostic test to inspect the time series properties of stock price and exchange rate in Kazakhstan. The main reason to perform unit root tests is to see whether data suffer from being nonstationary or not. This enables research to avoid the spurious result problems that are related to nonstationary time series models and makes unit root test a mandatory procedure before any regression. Two standard unit root tests such as the ADF and PP are employed to perform the unit root test.
There are three commonly used criteria for defining appropriate lag level in unit root test: the Schwarz’s Bayesian information criterion (SBIC), Akaike’s information criterion (AIC), and the Hannan-Quinn information criterion (HQIC). The one employed in the unit root test and thereafter in further analysis follows the AIC criterion. (Ivanov and Kilian 64 argue that for VAR models, that AIC is preferable for monthly data, while HQIC performs better with quarterly data on samples over 120 and SBIC is preferable for quarterly data of any sample size (on VEC models).)
The estimation results are presented in Table 1. In Table 1, panel (a) demonstrates the test statistics for the levels and determines that the null hypothesis of unit roots cannot be rejected in all log-level cases. Thus, the test statistics for first differences of series are calculated and presented in panel (b). From results in panel (b), the null hypothesis of nonstationarity in the first differences is rejected in all first log-differences cases. Therefore, these results confirm that data suffer from being nonstationary at levels but is stationary at the first difference.
Unit root tests.a

ADF: Augmented Dickey Fuller; ER: Exchange Rate; OP: Oil Price; PP: Phillips-Perron; SP: Stock Price.
aResults of two standard unit root tests, ADF and PP, to check the stationarity of time series.
*Significance at 10%.
**Significance at 5%.
***Significance at 1%.
Cointegration tests
Now, after confirming nonstationarity of series in differences, the cointegration test could be performed to check whether variables are cointegrated. Table 2 demonstrates the results for cointegration test. Panel (a) presents the results for bivariate case, while panel (b) presents results of multivariate case. The null hypothesis of the absence of cointegration between exchange rate and stock price cannot be rejected based on results in panel (a). However, according to the results in panel (b) for multivariate case, cointegration test confirms the presence of cointegration among the three variables under consideration. The null hypothesis of cointegrating vector absence is rejected at 95% level.
Cointegration tests.a

aResults of cointegration tests to check the long-run co-movement of time series.
*Significance at 10%.
The results from Table 2 demonstrate the lack of cointegration between exchange rates and stock prices in a bivariate case. The absence of cointegration in bivariate case may be the result of omission of some important variables from the model. However, there seem to be two long-run relationships between stock prices, exchange rates, and the oil prices in a multivariate case. Existence of long-run relationship among variables rules out the noncausality between the series, as the presence of cointegration implies that there should be at least two directions of causality in the Granger sense.
Granger causality tests
Tables 3 and 4 present results of Granger causality tests for both bivariate and multivariate cases. Results for bivariate case are presented in Table 3, while Table 4 presents results for multivariate case.
Granger causality tests (bivariate case).a

ER: Exchange Rate; SP: Stock Price.
aResults of Granger Causality Todo-Yamamoto test for bivariate case.
***Significance at 1%.
Granger causality tests (multivariate case).a

ER: Exchange Rate; OP: Oil Price; SP: Stock Price.
aResults of Granger Causality Todo-Yamamoto test for multivariate case.
**Significance at 5%.
***Significance at 1%.
Based on results from Table 3, we can reject the null hypothesis of no causality from the exchange rates to stock prices. Similarly, we reject the null hypothesis of no causality from stock prices to the exchange rates. These findings, though, may not be conclusive since regressions may suffer from the omitted variables bias.
For multivariate case, the results from Table 4 confirm previous findings that there is bidirectional causally between stock prices and real effective exchange rates in the Granger sense. Additionally, there is no sign of causality from exchange rate to oil prices; however, the oil prices are found to Granger cause the exchange rates. This result contradicts results of Fratzscher et al. 65 who identified bidirectional causality between the US dollar and oil prices. At the same time, this result support results of Bouoiyour et al. 27 who found a causal relationship running from oil price to real exchange rate in Russia and failed to support the reverse causal interaction from real exchange rate to oil price.
In the presence of cointegration among variables, VECM, where cointegration is considered explicitly, is more efficient as compared to Toda–Yamamoto test. Moreover, Toda–Yamamoto test fails to differentiate between short-run and long-run causality. Because of cointegration among variables in the long run, for multivariate case the VECM is also performed and its results are presented in Table 5.
Vector error correction model.
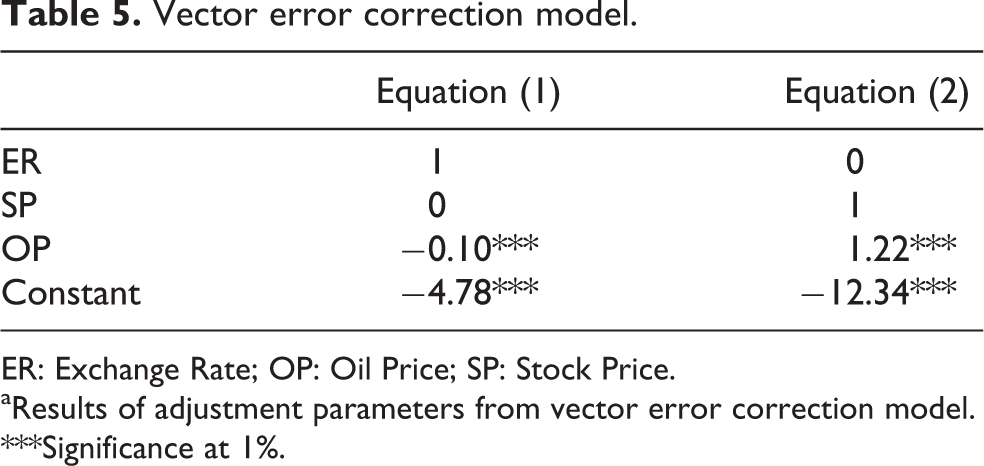
ER: Exchange Rate; OP: Oil Price; SP: Stock Price.
aResults of adjustment parameters from vector error correction model.
***Significance at 1%.
Table 5 presents the most valuable results of VECM and conveys the long-term relationship among variables. Results show that in the long run, there is an interaction between oil prices and exchange rate such that rises in oil price lead to appreciation of the real exchange rate. This result is in line with most of empirical research on the nature of relationship between oil prices and exchange rate. 5,27 –33 However, it contradicts results of Lizardo and Mollick 4 who claim that increases in oil prices lead to depreciation of the exchange rate. Also, results demonstrate that there is a long-run interaction between oil prices and stock index. In particular, higher oil prices result in lower stock market index. This result supports results of negative relationship between oil prices and stock market found for oil-importing countries 7,9,18 At the same time, it contradicts results of Bjornland 25 who demonstrated that an oil price changes influence stock market only in the short run but has no significant effect in the long run.
Conclusions
This study investigates the relationship between the oil price and real exchange rate of Kazakhstani tenge and interaction between oil price and stock prices. Additionally, the research studies whether there is any correlation between the exchange rate and stock prices in Kazakhstan. The research applies cointegration and Granger causality tests to investigate the relationships between variables under consideration. The data were collected from National Bank of Kazakhstan, KASE, and Energy Information Administration. Both bivariate and multivariate cases were employed. Including the oil prices variable into the model is important since Kazakhstani economy heavily relies on oil export revenues. It follows that extended model is an advance over the bivariate case.
For multivariate case, results could be summarized as follows. First, there is a causality running from exchange rates to stock prices. More interestingly, there is a causality running from stock prices to exchange rates, demonstrating that exchange rate and stock prices mutually affect each other in the short run. Second result is that both the exchange rates and stock prices are Granger caused by oil prices in Kazakhstani market. In simple words, both of them are affected by oil prices in Kazakhstan. Because of Kazakhstan’s dependence on revenues from the export of petroleum and natural gas, higher oil export revenues would result in the exchange rate appreciation. This exchange rate appreciation would negatively affect the competitiveness of Kazakhstani goods and services in the world arena. Consequently, worse economic situation in the country will result in lower stock index. This fact may explain the presence of a short-run causality between exchange rate and stock prices.
Additionally, empirical findings show that in the long run, higher oil prices increase the real effective exchange rate and force Kazakhstani currency to appreciate. As a result, rising oil prices would negatively affect Kazakhstani economy by making it more vulnerable to Dutch disease and thus slowly destroying the Kazakhstani economy in the long run.
To conclude, the fluctuations in the real exchange rate of tenge will lead to fluctuations in KASE index to a certain extent. When tenge appreciates, KASE index will fall. On the other hand, KASE index does Granger-cause the real exchange rate of tenge. As a result, fluctuations of KASE index will bring up changes in the exchange rate. For policymakers, the relationship between stock prices and exchange rate is of big importance since fluctuations in foreign exchange and equity returns cause significant fluctuations in international investment positions. Our findings imply that policy wise, monetary authorities in Kazakhstan in attaining their exchange rate policy objective should be considering the implications for financial market. These results are important to regulatory exchange authorities when deciding on policy to improve the market conditions. The results of this research also matter to international equity investors since investors holding foreign stocks are usually exposed to exchange rate fluctuations. For investors, decision-making related to hedging foreign exchange risk will depend, along with investment decision, on the relationship between equity and currency returns.
The study opens possible avenue for further research. New variables possibly can be included or the same study can be done in other emerging countries such as Russia, Belarus, or Kyrgyzstan. The practical implication is that regulator in Kazakhstan should be informed about such a correlation among oil price, exchange rate, and stock prices in a local market.
Footnotes
Declaration of conflicting interests
The author(s) declared no potential conflicts of interest with respect to the research, authorship, and/or publication of this article.
Funding
The author(s) received no financial support for the research, authorship, and/or publication of this article.