
Abstract
With the introduction of information technology (IT), a lot of organizations are making significant investment on them. These organizations see IT as a tool for having a competitive advantage. This increasing dependence on IT by organizations has generated the debate to assess its impact on organization’s performance. The results of previous studies on IT and firms’ performance are consistently attributed to the lack of valid quantitative measures. Non-parametric models like data envelopment analysis (DEA) have been suggested to be a good qualitative measure of IT impact on organizations performance compared to parametric methods. This current study applied a two-stage DEA model on 444 Ghanaian bank branches. The efficiencies were determined using the Robust DEA package in R programming. The results suggested that IT had significant impact on the banks’ overall performance as a good number of them (78.82%) were efficient in their entire operations, even though their respective efficiencies in deposit and investment were not good. In conclusion, further studies can combine DEA with machine learning algorithms to study the impact of IT on firms’ performances using the study’s data.
Keywords
Introduction
Since the introduction of information technology (IT) and its other related new technologies like computers and the Internet, a good number of organizations are making significant investments on them. Organizations such as banks continue to pursue any available opportunity such as IT to improve their competitive advantage. 1 According to Chen et al., 2 IT is redesigning the fundamentals of firms and has made most business operations to a large extent dependent on it. This increasing dependence on IT by organizations has generated the debate to assess its impact on firm’s performance. Initial studies, such as Wong and Dow, 3 have been based on analysis on traditional measures of organization’s performance. Thus productivity and profitability as it best suits the requirements of management. Unfortunately, the conclusions drawn by these studies are inconsistent and some authors such as Brynjolfsson 4 attributed it to the lack of good quantitative measures. Non-parametric models like data envelopment analysis (DEA) have been suggested to be a good qualitative measure of IT impact on organization’s performance.
For instance, Chen et al., Cao and Yang, Madjid et al., and Wang et al. 2,5 –7 all applied DEA to assess the impact of IT on firms’ performance and suggested a positive impact of IT on the firms’ performance. According to Dash et al., 8 compared to other methods, DEA is a strong technique in terms of systematizing and determining productivity since it enables efficiency to change after some time. It also requires no previous hypothesis on the details of the best-practice frontier. 8
In this study, the authors adopted a two-stage DEA model proposed by Wu 9 with the main aim to empirically validate Wu’s model 9 using a data set of 444 decision making units (DMUs).This study differs from Wu’s 9 previous work because of the following.
Firstly, the number of DMUs used in this current study is over 90% bigger than that of Wu. 9 Secondly, the economic indicators of the country where the current data set emanated from are completely different from where Wu 9 gathered his data. This study also used percentage of performing loans (%PL) as an output in both stage 2 (investment stage) and overall stage. Finally, this study only adopted the Charnes, Cooper, and Rhodes (CCR) model proposed by Charnes et al. 10 as compared to Wu 9 model.
After this introductory section, the study continues in “Review of related works” section with a review of literature followed by the methodology and explanation of the CCR DEA model which was implemented using Ghanaian banks as a case study. This section also talks about the adapted Wu’s model 9 used in the study. The next section will present a case study illustration of the two-stage DEA model using 444 universal bank branches called DMUs. The fifth section also presents the results and its discussions, and the final section deals with the conclusions drawn from the study and potential further studies.
Review of related works
There has been a number of studies such as Melville et al. 11 and Mahmood and Mann 12 that have attempted to analyze IT impact on productivity at every level of performance measures such as using the entire country’s economic data (Dewan and Kraemer 13 ), industry level data (O’Mahony and Timmer 14 ), and firm level data (Mendonça et al. 15 ), and the conclusions suggested by these studies are inconsistent. 4,16 –18 For instance, Hitt and Brynjolfsson 19 used firm-level data on IT expenditure by 370 big companies and suggested that IT had increased productivity and created substantial value for consumers. However, Loveman 18 also used the Cobb–Douglas production function suggested that there was no evidence of a productivity increase from IT investment.
Few recent studies Lichtenberg 20 and Brynjolfsson and Hitt 21 have suggested the opposite, thus the link between IT and productivity is positive and strong. This controversy among the literatures bequeathed birth to “The Productivity Paradox.” 22 –31 Per the review of the previous literature, one can say that the IT performance relationship begins from sturdily positive, too weak, and finally to no connection at all. As suggested by Brynjolfsson 4 and Hitt and Brynjolfsson, 17 the inconsistency in the conclusion drawn by various authors in the IT productivity was the lack of good measuring tools, which was mostly parametric models. Non-parametric models like DEA have been suggested to be a good measuring tool for measuring IT impact on organizational efficiency and performance. Traditionally, DEA has been one of the most popular tools to assess the impact of IT on firm’s performance, some of which have been discussed in this study. For instance, Sigala 32 conducted a study for measuring Information and Communication Technology (ICT) productivity impact with a unique non-parametric DEA approach.
This approach was intended to overcome the limitations of previous studies such as measurement errors, redistribution of impacts, and mismanagement of ICT identified by Brynjolfsson. 4 The author tested this approach using data from hotel restaurants in the United Kingdom. The results of the study suggest that productivity improvements do not ensue just from ICT investments but using the ICT “informate” and telecommunication infrastructure for business processes reengineering. 32 Using data from Iranian manufacturing businesses during 2002–2006, Abri and Mahmoudzadeh 33 applied DEA to study the subject matter. Results show that IT has a positive and significant impact on the productivity of manufacturing companies and that this positive impact is likely to be experienced in high IT-intensive businesses as compared to others. 33
Ngwenyama and Morawczynski 34 also in a study demonstrated that deregulation was not sufficient to affect effective ICT growth and contended that current conditions such as economic factors, human capital, geography, and political structure must be taken into consideration. The authors concluded with emphasis that policy makers can easily apprehend socioeconomic progress via ICTs if they think through these conditions while employing their technology strategies. 34
Fuzzy logic was implemented into DEA model to take care of the various environmental factors (variable), so that the efficiency of the various bank branches from a distinct region can be calculated. 35 The inner-province and outer-province comparisons were presented based on the results of the fuzzy DEA. The authors suggested that because of the different economic conditions such as salary level, population size, and other economic indicators, the results of the branch performance were not equal. As bank branches in the Ontario Province outnumbered that of the other two, its branch performance also showed a great variation as compared to the other two. The authors finally compared their results with other traditional DEA analyses.
Banker et al. 36 combined DEA and non-parametric production frontier to measure the productivity achievements from IT in complex managerial environment. The authors suggested that functioning productivity measures developed to have provided managers the prospect to device deployment approaches for new ITs to capitalize on value improvement.
Wang et al. 7 through their DEA model and methodology also evaluated the marginal benefits of IT using 36 DMUs financial institution’s data. The study suggested that for a collection of IT investment, IT impacted substantially on organizations’ revenues. Nevertheless, they were quick to contest their own results due to their belief that there was no relapse between IT investment and profits to performance and that IT was exclusively used in stage one.
Madjid et al. 6 used data on 20 Iranian conventional power plants to assess the impact of IT on their productivity. For that purpose, they suggested a DEA model that permits the incorporation of production and investment performance. Their study suggested that only four of their power plants were efficient. Madjid et al. 6 also did a correlation analysis to ascertain the impact of the IT budget, fuel costs, and employee’s number on availability, production, and average efficiencies. The result of the correlation shows that IT budget has the maximum impact on availability and production efficiencies and subsequently on the average efficiency. This strong correlation backs the idea that there was a direct impact of IT investment on productivity and efficiency within the Iranian conventional power plants. They finally concluded that IT impact on electrical power generation in conventional power plants was positive. 6
In 2004, Chen and Zhu 37 also used DEA model on 27 banks and suggested a positive impact of IT on the bank’s efficiency and performance. Chen et al. 2 in a study used 27 DMUs of banks suggested only three firm units as efficient in the two efficient calculation phases. Their results suggest that the bank’s investment in IT, assets, and employee should be assigned to only one specific stage.
Bank’s operations are always in a constant changing atmosphere and increasingly adjust their products and services to their customers. 38 Thanassoulis 38 in a study focused on the use of DEA in the banking industry by drawing on available reports and survey he conducted on two large banks based in Britain and Finland. The main DEA inputs for his study were labor and floor space while transaction handled was the output. The author suggested that banks were gradually adopting DEA as a tool for evaluating, monitoring, and enhancing efficiency and performance. Thanassoulis 38 in his study also provided new areas where DEA can make meaningful contributions. The areas suggested by the author include the assessment of efficiency based on the prices of resources; budget allocation to operating units; evaluation of efficiency in reducing fiscal risk at a branch; usage of cross-bank data to allow distinct banks and branches to check their efficiency and performance in the context of the industry; and last but not the least the evaluation of the impact of change initiatives such as IT on productivity. 38 To him, such applications do not establish a comprehensive list but just specify the scope for improving the role of DEA in banking. 38
Having a clear knowledge and understanding of a financial institution such as bank’s relative efficiency and performance equated to the market between periods of time is imperative for experts, practitioners, and policymakers. 39
Jemric and Vujcic, 39 Titko et al., 40 and Grmanová and Ivanová 41 applied DEA in their respective studies to assess the efficiency of banks. In the case of Jemric and Vujcic, 39 they examined bank efficiency in Croatia using DEA between 1995 and 2000 and suggested that the alien banks were the most efficient. According to the authors Jemric and Vujcic, 39 there was a robust equalization with respect to average efficiency in the Croatian banking market, both between peer groups and within peer groups of banks. 39
Titko et al. 40 also applied the same DEA approach in analyzing the efficiencies of Latvian banks. To validate the variable’s choice for DEA model, the collected data were analyzed using statistical methods as correlation analysis, linear regression analysis, analysis of mean values, and two-sample Kolmogorov–Smirnov test. 40 The authors suggested there was no significant evidence to support that the Deposits by customers have a significant impact on DEA score. 40
According to Grmanová and Ivanová, 41 one of the most common and efficient method of measuring efficiency and performance in the banking sector is the non-parametric DEA models. It endorses examining the efficiency of transforming several inputs into multiple outputs with the help of efficiency score. In their study, Grmanová and Ivanová 41 adopted DEA models to assess the efficiency of Slovak banking sector. According to the study results, three major banks at Slovak national banking market were noted to be efficient in both years analyzed. Thus, a bank like Slovenská sporitel’ňa was efficient in all the models with different combinations of inputs and outputs. Sheng and Mykytyn 42 also employed DEA and proposed a framework that can be used to measure the productivity of organizational IT investment.
Finally, other authors like Nand and Archana, 43 Yumanita et al., 44 Sarifuddin et al., 45 Halkos and Salamouris, 46 Aggelopoulos and Georgopoulos, 47 Dalgleish et al. 48 Saka et al., 49 and Adusei 50 have applied DEA approach in the measurement of efficiency within the banking sector and have reported positively about the use of the non-parametric DEA as an efficient method of determining the efficiency and performance of banks.
The methodology of the study
The research methodology used for the study consisted of the following: using the two-stage DEA model proposed by Wu 9 to analyze the various inputs and outputs at each stage, including the overall efficiency. To determine the individual efficiencies of each DMU (bank), the DEA algorithm that has its package Robust DEA (rDEA) Version 1.2-5 51 in R studio was used and codes were written in R language. The result of the efficiencies generated by the R was also analyzed and presented. The study gave a brief background and basics of DEA as an efficiency measurement and followed it with the explanation of the adapted two-stage DEA model depicted in Figure 1. Finally, a case study illustration was done using data from the Ghanaian banking sector.

A two-stage DEA model for efficiency computing adapted from (Madjid et al. 6 ). DEA: data envelopment analysis.
The basics of DEA
DEA is considered as a non-parametric method that produces a comparative ratio of weighted outputs to inputs for each DMU under consideration, that is, relative efficiency.
10,52
The study presumed that there are n DMUs to be evaluated and in this case (n = 444). Each DMU consumes m different inputs.
For stage I, the m different inputs are IT expenditure, the bank’s Fixed Asset, and number of employees to produce s different outputs.
For stage II, the only input is a deposit which is also the main output of stage I. Finally, for the overall stage, the profits made from investing the deposits in stage II and also %PL are also the two main outputs.
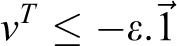
Specifically, DMU j consumes amount, xij of input, i and generates quantity yrj of output r. The further adopts that xij > 0 and yrj > 0. The input-oriented efficiency of a specific DMU0 under the postulation of variable returns to scale (VRS) can be deduced from the following primal-dual linear programs, Banker, Charnes, and Cooper (BCC) model proposed by Banker et al. 52
The BCC envelopment model
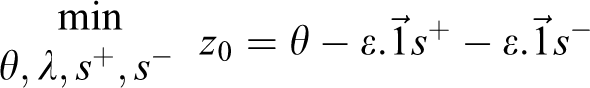
Subject to


BCC multiplier form

This is also subject to


Determining a DEA involves the solving of n linear programming tasks of the above model, one for each DMU. The ideal estimation of the variable θ determines the corresponding diminishing of all inputs for DMU0 that will transfer it onto the frontier, which is the envelopment surface defined by the efficient DMUs in the sample. DMU0 is DEA efficient as far as there exists an ideal solution

where
From this end and beyond, the optimal value is denoted by *. The condition on
If the convexity constraint
The two-stage DEA model for efficiency analysis
In this DEA model, the various units under consideration were bank branches in Ghana whose performance or productivity measures were grouped into inputs and outputs. Using the bank as an example to derive our model shown in Figure 1, the banks business process and activities are viewed as a dual role process.
The first stage (deposits stage) of the model consists of collection of funds (deposits) in Ghana Cedi as an intermediate measure from customers using their fixed asset, number of workers (employees at each unit), and IT facilities (thus IT expenditure). In the next stage (investment stage), these banks use the deposits accumulated in stage I and invest it in securities and also give loans to its customers. Returns (profits) generated from the investment in securities and fractions of performing loans, 53 –55 which is a good indicator of risk status, are used as two outputs in stage II.
DEA model used at the deposit stage, I produces stage I efficiency for each DUM and the DEA applied at the investment stage, II also gives stage II efficiency for each DMU. DEA models employed at overall stage finally give the overall efficiency for each DMU. The proposed DEA framework for the banks dual role operation is depicted in the Figure 1 below.
The various variables used at the deposit stage, investment stage, and the final stage are stated as follows: Deposit Stage, Investment Stage, Overall Stage,
Case study illustration using the two-stage DEA model
At this point, of the study, the authors demonstrated how DEA can be used to assess the efficiency of firms using bank branches in Ghana (DMUs) as a case study. This data set collected for the study contains 444 bank branches (DMUs). The Cedi values of the banks’ IT Expenditure, fixed assets, number of staff at each branch, profits generated from investing deposits, percentage of performing loans on the various bank branches, and the total deposits were obtained from the various DMUs. Specifically, the audited 2016 financial statements were used.
Alignment of organization’s IT investment and its business goals and operation is important whenever one is assessing the impact of IT on the organization performance and efficiency. 56 As stated earlier, the operations of the various bank branches were considered to be a dual operation (two main value-added events as shown in Figure 1). In this case, the banks used IT infrastructure, number of staff, and their fixed asset to collect money from their customers called deposit in the stage 1.
The Cedi values of the total deposits were used as the output variable while the Cedi equivalents of their IT (IT expenditure), number of employees, and fixed assets were used as the input variables. IT facilities such as computers installed with software, mobile phones, automated teller machines (ATMs), and Internet facilities are vital tools that banks use to collect deposit and also use it to invest their deposits into securities through electronic transfers and process loans for their customers. The study, therefore, noted both stages I and II as IT-related value-added events and considered the efficiency of both stages important.
A bank’s profit after all the various deductions, including tax, is centered on the revenues accrued from the investments and the loans given out in stage II. In this case, it will be totally unacceptable to only asses a bank’s performance and productivity only on their profit margins without looking at how their loans given out are performing, %PL. This is because a bank with a weak %PL stands a high probability of losing net profit and can also threaten the bank’s existence. We, therefore, denoted this situation by the variable percentage of performing loans.
For each DMU, the technical efficiencies in both stages and their corresponding overall efficiencies were analyzed using CCR DEA model. The efficiency of stage I was calculated using IT expenditure (GH ¢), fixed asset (GH ¢), and number of employees at each DMU as inputs with deposit as the main output. With respect to stage II, the deposit (GH¢) realized from stage I was used as input with banks profit after all the necessary deductions and the %PL as outputs.
The efficiency of the overall stage was also calculated using fixed Assets, number of employees, and IT budget, while their output was the banks profit after all the necessary deductions and the %PL. The efficiency of each DMU at each stage was calculated using the rDEA package implemented in R miner Version 1.2-5. 51
Presentation of results and discussions
Using the results of the study, the efficiency of each DMU at each stage was analyzed using the following scenarios:
Case 1: When an efficient unit is defined as a unit with an efficiency score of 1 unit or 100%.
For bank’s branches efficiencies in terms of utilizing IT to collect deposits from customers, only 14 (3.15%) banks were efficient. Thus with an efficiency value of 100%. Only 33 (7.43%) had an efficiency score between 80% and 99%, 19 (4.28%) also had between 70 and 79, 22 (4.95%) had between 60 and 69, 27(6.08%) had between 50 and 59, and finally 329 (74.09%) had an efficiency score below 50%.
The 329 (74.09%) number of bank branches suggest that a lot of Ghanaian banks are not efficient in using IT to collect deposits from customers. According to Addison, 57 –59 most banks in Ghana were struggling to meet the minimum capital requirements set by the central bank (Bank of Ghana) in 2017. 57 –59 The results of the deposit stage efficiency are also shown in Figure 2 below.

A graph showing the banks’ efficiencies in collecting deposits (Authors’ construct). DMU: decision making unit.
For banks efficiency with respect to investing customer’s deposits shown in Figure 3, only 1 bank (DMU200) was efficient in investing the deposit to generate profit for the banks, while only 1 bank (DMU219) had an efficiency score between 80% and 100%.
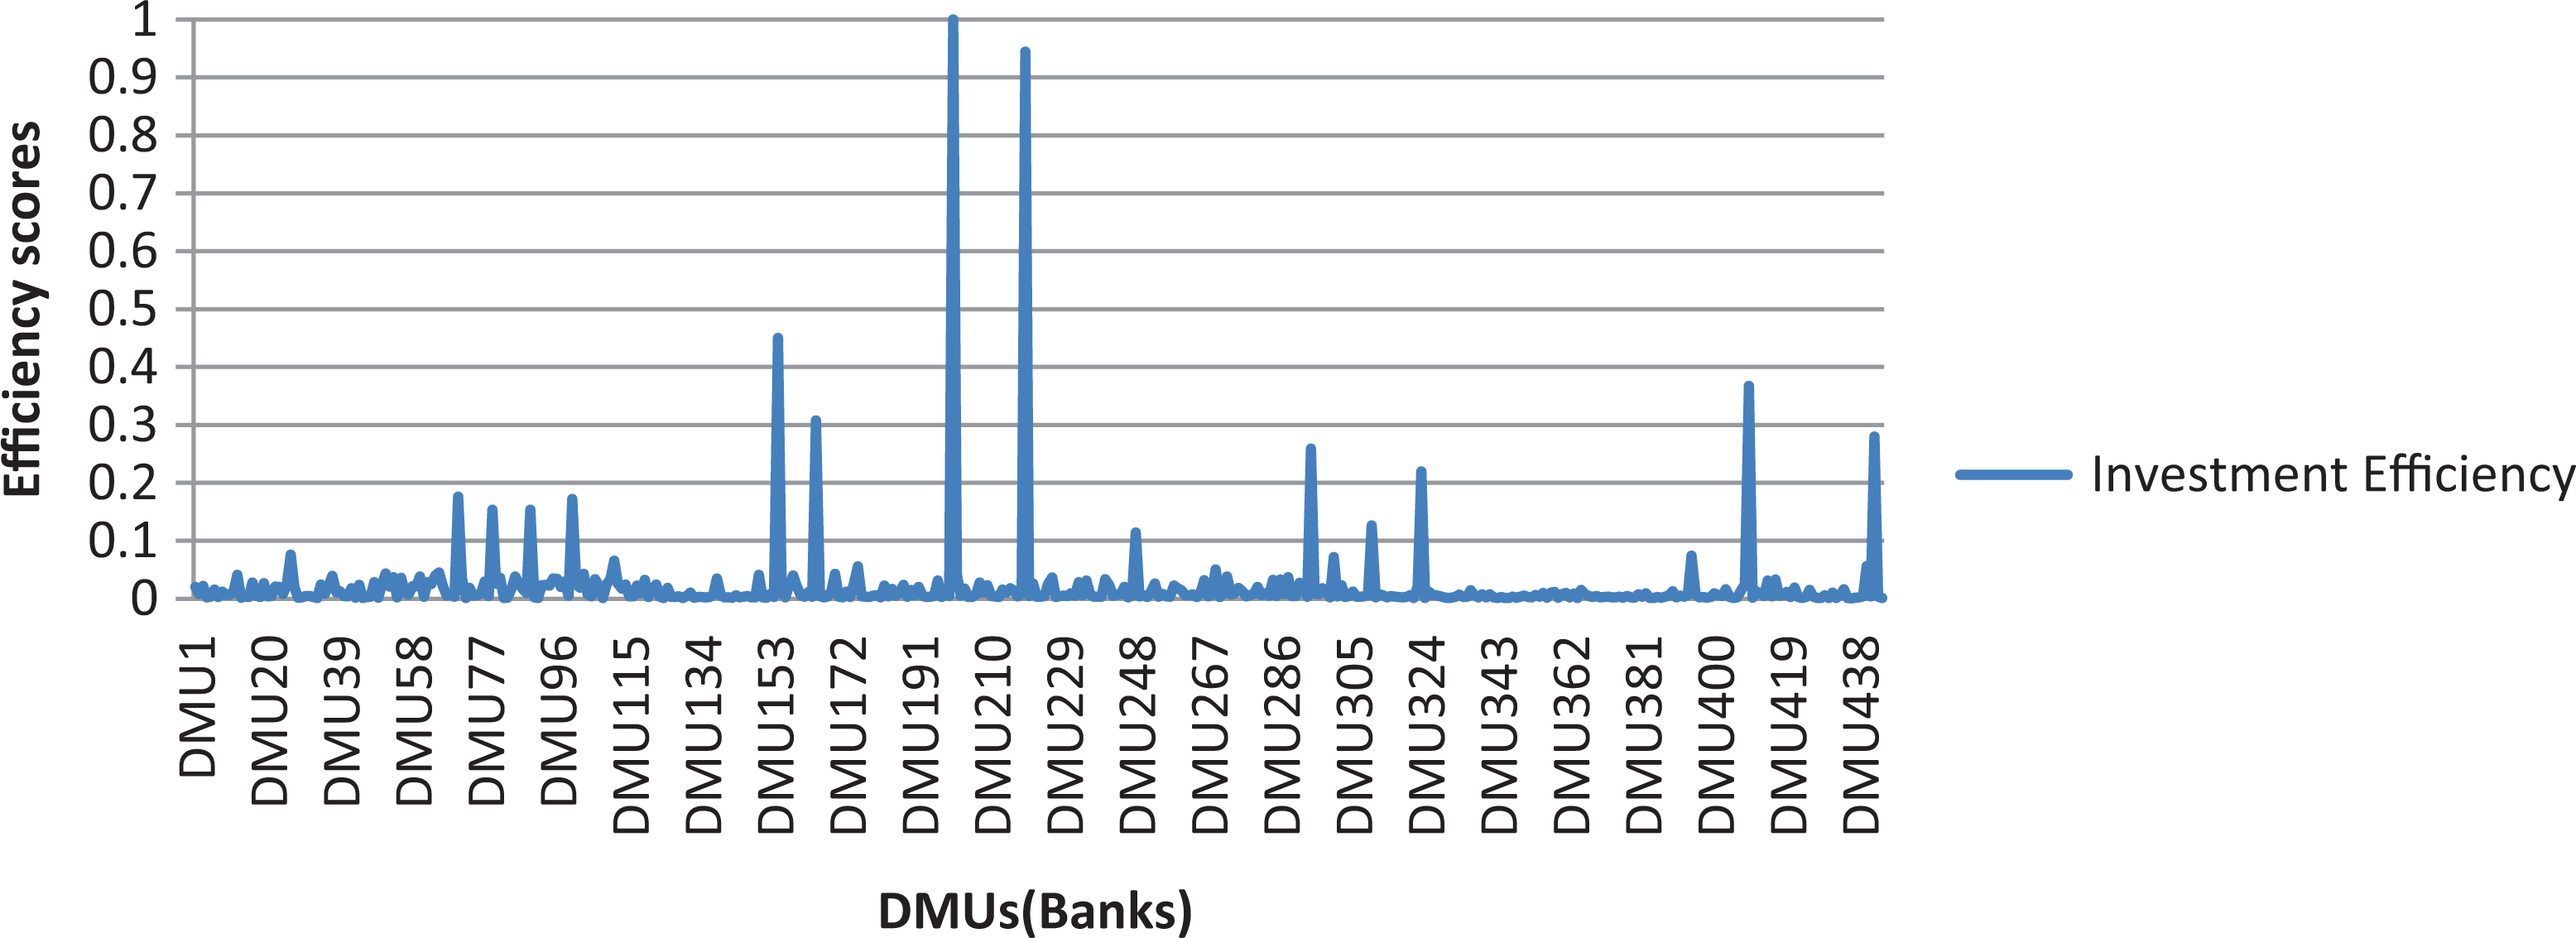
A graph showing the banks’ efficiencies in investing deposits (Authors’ construct). DMU: decision making unit.
This result suggests that close to 99.5% of Ghanaian bank branches that were considered for the study were not efficient in investing. This also confirms reports of crises that have hit the Ghanaian banking industry with its issues such as alleged managers and board of directors squandering depositors’ money without investing them. 60 This has also lead to about seven universal banks collapsing in 2017 and 2018. 61,62
For overall bank branch’s efficiencies in the entire banking operations, also shown in Figure 4, 39(8.78%) were efficient (100%) with majority, 311 (70.04%) of them having an efficiency score between 80% and 99%.

A graph showing the banks’ overall efficiencies in the entire banks operations (Authors’ construct). DMU: decision making unit.
Fifty bank branches had an efficiency score between 70% and 79%, and finally 44 branches had between 60% and 69%. In terms of overall efficiency, there was no bank branch that had less than 60% efficiency score. This analysis means that even though most bank branches in Ghana do not experience a higher percentage of efficiency in collecting deposit and investing the deposit; they still enjoy higher overall efficiency. The results suggest that banks in Ghana should identify ways of improving their efficiencies in both the deposit stage and investment stage and should not only rely on their overall efficiency scores as means of measuring their performance and success.
In real-life situation, it is difficult to have units or departments attaining 100% efficiency and bank branches in Ghana are not an exception. Normally, in grading of a system in terms of their efficiency, systems with efficiency value between 80% and 100% are also considered to be excellent (efficient) with respect to its performance. This is also evident in the Ghanaian banking sector where the central bank (Bank of Ghana) always has a minimum capital requirement for banks and other financial institutions operating in Ghana.
57
–59
This means that there is always a “cutoff point” for banks to meet to be efficient and remain competitive in the banking sector. Based on this, the authors also inferred and considered banks with an efficient value of 80% or more as efficient. The study, therefore, adopted and used the efficiency “cutoff point” (DMU efficiency ≥ 0.8) suggested by Wu
9
and discussed the efficiency scores in all the stages as follows:
Case 2: When an efficient unit is defined as a unit with an efficiency score of 0.8 or more (80–100%).
Under this scenario, 47 (10.59%) banks were efficient in collecting a deposit from customers, while only 2 banks (bank with DMU200 and bank with DMU219) were efficient in investing the collected deposit to generate profit. A good number of banks’ branches 350 (78.82%) were efficient at the entire banking operation (overall stage). The 44 (9.9%) DMUs efficient in the collection of deposit were also efficient in the overall stage. Only 3 DMUs were efficient in collecting deposit but still could not achieve overall efficiency.
Conclusion
The increasing dependence on IT by organizations has generated the debate to assess its impact on firm’s performance. Initial studies such as Wong and Dow 3 have been based on analysis on traditional measures of organizations’ performance and efficiency, and conclusions drawn by these studies are inconsistent. Non-parametric models like DEA have been suggested to be a good qualitative measure of IT impact on organizations efficiency and performance. The main purpose of the study was to empirically validate the two-stage DEA model proposed by Wu 9 using a large data set of 444 DMUs which represent Ghanaian bank branches. In this article, the authors started by introducing the IT and productivity concept and followed it with a review of related literature available from previous similar studies. In the third section, methodology explained the basics and background of DEA model and its suitability over others to measure efficiency of firms. The two-stage DEA model was also presented using the bank as a case study scenario. The fourth section discussed a case study illustration using 444 Ghanaian bank branches (DMUs) and how the DEA algorithm with it packages in R studio was used to evaluate the efficiencies scores of each bank at each stage of the DEA model using DEA CCR model. Lastly, the discussion of the findings of the research and possible implications for the stakeholders within the banking sector in Ghana was done. The results of the numerical illustration suggest that IT has a significant impact on Ghanaian banks’ overall performance as majority (350) of the firms had over 80% efficiency in their entire banking operations when the efficiency “cut-off point” of 80% or more was introduced. The results also suggest that most of the DMUs were not efficient in collecting deposits and also investing the deposits, and therefore, it was incumbent on management to engage in activities that can promote their performance in investment. The results suggest that IT impact on banks performance was positive which is also consistent with previous studies such as Chen et al., 2 Chen and Zhu, 37 and Wang et al. 7
The research in terms of the number of DMUs used was bigger than that of previous studies like Wu 9 , Chen et al., 2 Chen and Zhu, 37 and Wang et al. 7 Compared with previous studies, the authors used data from a developing country where the economic indicators are completely different.
This study, therefore, attempted to close the IT and productivity literature gap between developed and developing countries suggested by Appiahene et al. 1 The study also used %PL as an output in stage II and the overall stage compared to previous studies like Wu. 9 The study only used the DEA CCR model proposed by Charnes et al. 10 as compared to Wu 9 works that used both CCR and BCC models.
In terms of practical implications, the banks management board and other stakeholders may detect new ways to better their efficiency either in the deposit stage or investment through the use of innovative technologies like IT using the result of this study.
To improve bank’s efficiency and performance to remain competitive in the current banking crisis in Ghana, managers, and stakeholders should not over rely on their overall efficiency or performance as means of measuring growth. Managers should rather critically find ways of improving their efficiency in deposit collections from customers and also investing the deposits.
The general Ghanaian banking industry and other firms may benefit from the results of this study as they may have a better understanding of relationship between IT investment and bank’s performance and efficiency. Customers’ and investors may benefit from the findings of this study as the findings would add value to their knowledge of how efficient their various bank branches are, in terms of managing their investments.
Determining the precincts of any research work helps improve its reliability and the generalizability applications of the findings. There are some possible limitations that should be borne in mind in the analysis and generalization of the study findings. The focus of the study was entirely based on the Ghanaian banking industry experience. Given that practically various economic indicators may differ across countries, geographic region or even continent, it is completely possible that there may be substantial differences and disparities in the findings if this study is simulated in other countries or geographic regions. It is to acknowledge the limitation of the relatively few population samples considered in the study imposes as the study only considered 444 commercial (universal banks) branches in Ghana. Expanding the sampling data to include other bank branches and even rural banks can enrich the findings and increased its potential generalization. The data set used in this study can be analyzed using a different methodology in terms of how the DEA scores were determined, and the results compared with this study. Future studies can also consider the liquidity ratio on banks as an output variable in the determination of the bank’s efficiency. As suggested by Dash et al., 8 it is hardly impossible to use the scores of DEA to predict the performance or efficiency of new DMUs (banks). As a result, DEA is limited in terms of using it to predict the performance or efficiency of new banks in the face of their IT. Future studies can combine DEA model and machine learning algorithms like random forest, decision trees, and even artificial neural network to develop models for predicting future bank’s efficiency and performance using the study data.
Footnotes
Declaration of conflicting interests
The author(s) declared no potential conflicts of interest with respect to the research, authorship, and/or publication of this article.
Funding
The author(s) received no financial support for the research, authorship, and/or publication of this article.