
Abstract
Companies have to deal with many different challenges in their environment every day. In this article, focus is given to inspecting the impact of the economic costs of violence on 119 countries worldwide. In the analysis, the CAGE model, which consists of four complex domains: Cultural, Administrative, Geographic, and Economic differences, is used to group countries according to their development level and the level of violence costs. However, in the clustering analysis, except the CAGE variable, 10 additional variables describing development level and the economic costs of violence are used as well. According to the conducted nonhierarchical cluster analysis, in which a k-means approach was used, six groups of countries are recognized. Most countries can be found in the cluster of developing countries with low economic costs of violence. So, the results pointed out that, despite the low economic costs of violence, a large number of countries are still struggling with other key environmental challenges that prevent them from achieving their full economic development potential.
Introduction
The ingratitude of crisis situations is growing with the scope that prudent circumstances take. Often, crisis interventions in a specific industry, usually the capital-intensive one, and the effects chained spread to related economic sectors and national economies. Therefore, in today’s affiliated society and on a single but heterogeneous international market, it is most commonly referred to a global economic crisis. Turbulent time, that is not, and often cannot be, preplanned or anticipated, usually lasts for an uncertain period and has an ambivalent outcome. 1
During crisis, the focus is solely on financial indicators and the cost side of the business. 2 Namely, capital-intensive companies are particularly sensitive as raw material costs account for almost 70% of the total cost of product being placed on the market. 3 However, cost reduction is an insufficient determinant of success, especially in times of global economic crisis. Indeed, much more savings are achieved through a consistent and well-defined strategy. The reason is that the crisis is most frequently a result of badly guided politics, inadequate strategies, and misguided and unsettled decisions. Ultimately, it is the result of numerous unmanned, through time accumulated, adverse changes in the internal and subsequently external environment. 4 Therefore, an additional overwhelming circumstance is the fact that the crisis does not disturb one enterprise but mostly affects the entire industry and the market.
Every business entity is a part of a complex system and its business depends on market events, terms of supply and demand, attractiveness and competitiveness of products or services, and the comparative advantages that can be built in relation to the present competitors. However, by the occurrence of unlucky events in the environment, the economy of transition countries is most vulnerable because market forces often do not provide a self-regulating effect but additionally encourage existing inequalities in space. Economic activities are fading and the vicious circle of multiplying effects is launched. Namely, the reduction and shutdown of certain business activities leads to a decline in employment and the start of the economic emigration process, and national economics remains primarily without qualifying employment. Reduction in the purchasing power of citizens, local production, and local demand is present. Consequently, tax revenues are also reduced, which is why there is no investment in infrastructure.
The attractiveness of a certain location for the potential new companies and foreign investments does not exist. The absence of a prospective economic hub significantly weakens competitiveness on the international market and disables companies’ readiness to take risks, and thus to export. Therefore, for such a collapsed economy, it is important to know how to successfully grow up with the right knowledge that can be achieved using the CAGE model that is based on Cultural, Administrative, Geographic, and Economic differences. 5 Videlicet, the specified and systematized content of the main components of the CAGE model greatly contributes to a quality analysis of its own characteristics as well as the analysis of numerous market circumstances. Hence, the CAGE model allows all entities the same starting point and equal market competition, enabling a better understanding of international trade relations, the flow of capital and information, as well as human behavior patterns. 6 Because they have a profound understanding of the internal and external environment through CAGE model components, they can develop viable strategic engagements, recognize and thus reduce market risks. 7,8
Cultural differences are the basis as they represent the mind software that defines ingrained values, behaviors, and societal norms. 9 Informal institutions, which are reflected in culture, brace the operations of formal institutions. 10 The legislation defines the degree of stability and the intensity of activity on the international market through the barriers it poses. Therefore, many economies segregate significant financial resources, trying to overcome regulatory and administrative differences. 11,12 Geographic differences are cost-reduced proportionally to the greater proximity of business entities. 13 Economic differences complicate the implementation of streamlined business practices and require devising new strategies according to changed conditions. 14
Brauer and Tepper Marlin 15 argued that some economic activities may not occur at all due to violence or even the fear of violence. In our work, we focus on countries worldwide, with the presumption that there are countries that share common characteristics regarding economic development level and the economic costs of violence. In order to make homogeneous groups of countries, the cluster analysis as a multivariate statistical method was applied. 16 The cluster analysis is often used in economics. For example, the cluster analysis is very useful in market segmentation to recognize groups of consumers with different characteristics and then different marketing strategies are applied to them. 17,18
Our research is conducted on a sample of a large number of countries worldwide. For the purpose of the analysis for each country, 11 variables describing economic development level and the economic cost of violence are collected. Unfortunately, not for all countries data for all selected variables were available. Furthermore, the United States was omitted on purpose because it is assumed that they would have a too large effect on the clustering results. Finally, in this article, 119 countries were observed. Those countries are going to be classified into homogeneous groups by applying a k-means clustering procedure. On that way, patterns and rules between economic development level and the economic cost of violence in countries will be recognized.
The article is organized as follows. After a brief introduction in the first section, in the second section the CAGE framework is explained in detail and the economic costs of violence are discussed. In the third section, sources of variables, used in the analysis, are provided and the k-means clustering procedure is described. The fourth section is dedicated to the empirical results that were obtained using descriptive statistics, correlation analysis, and nonhierarchical cluster analysis. In the final section, concluding remarks along with limitations and recommendations for further research are given.
Literature review
CAGE framework
Companies are faced on a daily basis with many challenges in their environment. Given that the globalization and internationalization of the environment is gaining an increasing scope, differences in diversified markets, and thus potential risks, increase proportionally. The complexity of these differences can be understood by the use of a systematically constructed model in which all the features that appear as difference factors are logically combined. CAGE represents a model of that kind that integrates all the features of business entities, its environment, and the international diversity of the environment in which businesses dominate. It consisted of four complex domains: Cultural, Administrative, Geographic, and Economic differences. 19
The starting basis is always a culture as it implies the internal character of the business entity and its most immediate environment in which it has been developing for years. Culture represents a universal phenomenon at various levels of social relations that unites many values and unprovoked beliefs, accepted moral principles, pervasive thinking, and learned patterns of behavior acquired in the community they belong to. 20 In international relations, culture represents a departure from the individual level of action and places emphasis on learned corporate patterns within a national cultural foundation. According to Ghemawat, 5,21 cultural differences include bilateral and unilateral measures. It is confirmed that understanding the culture foundation represents the basis for achieving economic success abroad. 22,23 Two identical markets, with the existence of only significant linguistic diversity, will have large difficulties to achieve successful business cooperation. 24 Further, religion, much more explicit than the language, links expressive values. 25 Since cultural specificities, apart from the visible features (language and religion), also imply invisible, unobservable characteristics, it is crucial to investigate how interactions are attenuated within cultural distance.
The heterogenization of the market continues through administrative differences that combine the broader context in which a business individual resides. The legislative framework is formed by state authorities, is periodically changing, and as such is imposed on the business world. Bureaucracy, political structure, and established legal regulation reflect the historical and current relations between trade partners. Administrative and political differences can significantly affect the time frame and material intensity of international cooperation because national prosperity is at the center of every administrative and political framework.
Depreciation of internationalization takes place through instability within national boundaries 26,27 and non-systematically established regulations and rules. 28 On the other hand, decentralized, restructured, and consolidated world sought to fade away after the Second World War. Namely, the capitalist world economy was increasingly trying to organize itself as an open system without economic obstacles to the established trade secrets. The European Union is a prime example of the conscious removal of administrative and political diversity with a view to facilitating and intensifying cooperation within the Union. 29
Ambos and Håkanson 30 find that geographic distance is more than three times as strong as the usual measures of cultural distance as a predictor of psychic distance. Geography implies transportation costs and most importantly communication–information barriers. Companies that are struggling with poor coordination are unable to overcome the geographical segment. 31 However, as the growth of the business volume in the international market is more evident, the geographic distance of the foreign market is less important. 32 –34
Economic distance inhibits most types of international interactions. Economic diversity and international interaction determine the degree of trade (merchandise and services exports), capital flow (foreign direct investments (FDI) outward stocks, portfolio equity assets, and long-term debt stocks), information availability (outgoing phone calls, printed publications exports, patent applications), and the attraction of a particular location through the human factor (emigrant stocks, tertiary students inbound, tourist arrivals). 35 The positive correlation between gross domestic product (GDP) per capita and trade flows implies a more intensive international cooperation. 36 Nevertheless, the complexity of economic nature points to the absence of universal rules when the economic characteristics are concerned. The applicability of their own international strategy in a similar market 37 ; the substitution of various forms of natural, financial, human resources and intermediate inputs 38 ; and strengthening their own market positions by supporting an economically more stable market 39 reflect on the intensity and success of cooperation. Furthermore, limited infrastructure, unavailability of information and knowledge base, and low level of monetization represent potential complex export obstacle. 40,41
CAGE is a modern model that has been perfected and used in practice over the last few years. In the published professional and scientific literature, CAGE has been used in a dozen research papers. In one research segment, CAGE has been used to compare home and host countries and the effects of greater distance in each segment of models and constructs. 6,42 –44 On the other hand, it has been used to monitor the effects the national economies globalization and the export performance toward selected countries. 45 –49
Economic costs of violence
It is economically efficient when expenditure on containing violence spends the least amount and still effectively prevents violence. However, it is to be noted that spending beyond the optimal level can potentially constrain a nation’s economic growth. Thus, it is important to achieve the right levels of spending on violence for the most productive use of capital.
The variables related to the economic costs of violence are represented as follows: (i) security services and prevention-orientated costs: military expenditure, internal security expenditure, security agency, private security, UN peacekeeping, and official development assistance peacebuilding expenditure; (ii) armed conflict and related costs: direct cost of deaths from internal violent conflict, direct cost of deaths from external violent conflict, indirect costs of violent conflict (GDP losses due to conflict), and losses from status as refugees and internally displaced persons, small arms imports, and terrorism; (iii) interpersonal violence: homicide, violent assault, sexual assault, fears of crime, and indirect costs of incarceration.
Global military expenditure, internal security spending (spending on prison and police systems as well as indirect costs associated with incarceration), and homicide were the three largest components, ranked respectively, contributing to military expenditure.
The economic impact of violence in billion PPP in 2015 and 2016 is shown in Figure 1. The economic impact of violence is estimated to be 14,781 billion purchasing power parity (PPP) in 2015 and 14,350 billion PPP in 2016. So, it is estimated that the economic impact of violence decreased about 2.5% in 2016 compared to 2015. If the economic impacts of violence indicators are observed, it can be concluded that in both years military expenditure, internal security, and homicide have the highest impact.

Economic impact of violence in 2015 and 2016, in billion PPP. Source: Institute for Economics and Peace. 51
Figure 2 shows the composition of the global economic impact of violence in 2016. The highest impacts estimated through direct costs with multiplier effect have indicators military expenditure and internal security and homicide. On the other hand, indicators homicide and violent crime have the highest indirect costs as contribution to the total economic costs of violence.

Composition of the global economic impact of violence, 2016, in billion PPP. Source: Institute for Economics and Peace. 51
Each region is impacted by different types of violence; the largest disparity between them is violent crimes and homicides. The least peaceful countries are affected disproportionately by the economic cost of violence, on average. In the 10 least peaceful countries, the average economic cost of violence was equivalent to 37% of GDP, whereas the 10 most peaceful countries lie at only 3%. Depending on the scale and intensity, armed conflict can affect economic activities through various channels. 50
Methodology
Data
In order to inspect the impact of the economic cost of violence on internationalization overall, 11 variables are observed. The variables are carefully selected according to the previous research which is shown in the literature review. The list of used variables and their brief descriptions are given in Table 1.
Observed variables.

Source: Authors’ work, based on Institute for Economics and Peace, 2017; Ghemawat, 2001; World Bank, 2017. FDI: foreign direct investments.
Different publications and online sources from relevant institutions were used for the data sources (World Bank, 2017). 19,50 The data have been collected for 119 countries worldwide. Unfortunately, for some countries there were no available data and because of that they were omitted from the analysis. On the other hand, the United States was not included in the analysis because this country would have a strong impact on the results due to its leading economic position in the world, and such represents an outlier.
K-means clustering procedure
After applying basic descriptive statistics methods and correlation analysis to get familiar with variables, the cluster analysis, as a suitable technique for classifying similar groups of statistical units, 16 will be applied to make groups of countries with similar characteristics. On the one hand, the cluster analysis will result in groups of countries with similar characteristics, but on the other hand countries in different groups will have quite different characteristics. Despite the fact that, according to the thumb rule, the sample size should be at least equal to 2 k , 52 the advantage should be given to the theory and researchers’ choice. Consequently, in the cluster analysis, all 11 observed variables are going to be used.
From the variety of different clustering procedure approaches, 17,18,53 it has been decided that the nonhierarchical (portioning) cluster analysis will be conducted. In the nonhierarchical cluster analysis, a within-cluster variation is used to make clusters. However, the number of clusters should be defined before the clustering process is started. The final number of clusters will be defined using the v-fold cross-validation approach. It is believed that on that way, the classifier parameters will be optimized, with improved performance. 54
After the stable cluster solution is achieved and if the solution can be validated through a theoretical perspective, 16 the clusters can be observed and interpreted. The interpretation of a cluster is conducted by observing which countries are in that cluster. Accordingly, a cluster can be entitled according to the countries’ characteristics in that cluster.
In order to conduct the cluster analysis, statistical software Statistica (version 13.1) will be used. The number of clusters is going to be determined by observing a graph of the cost sequence. Afterward, the analysis of variance (ANOVA) will be applied to check if all used variables really improved the classification of countries in clusters. If the ANOVA shows that all variables are statistically significant, the cluster means will be observed. Furthermore, the distribution of variables across clusters will be observed to make insight into the variability level of countries in different clusters at each observed variable. Finally, the contents of clusters are discussed and the clusters are named according to the characteristics of countries that are classified in the certain cluster.
Results
Descriptive statistics analysis
Overall, 10 descriptive statistics measures are selected to describe the observed variables. There are three measures of central tendency (mean, median, mode), two variability measures (standard deviation, coefficient of variation), and two measures that describe distributions’ shape (skewness, kurtosis). In addition, minimum and maximum values are used to calculate data ranges. Basic descriptive statistics measures of the 11 observed variables are calculated and shown in Table 2.
Descriptive statistics results of the 11 observed variables, n = 119 countries.

Source: Authors’ work.
The economic cost of violence is observed using three variables. The highest economic cost of violence of 741,906 million in PPP had India in 2016, whereas the lowest economic cost of violence of 276 million in PPP had Guinea-Bissau. That is a huge difference. Consequently, the variability level, as shown by standard deviation and coefficient of variation, is also very high. If the economic cost of violence per capita is observed, the variability level seems to be lower. However, the difference between Malawi, a country with the lowest economic cost of violence per capita, and Saudi Arabia, a country with the highest economic cost of violence per capita, is still remarkable. Despite the share of the economic cost of violence in GDP is lower than 1% in all observed countries, the variability level at this variable can also be considered as high.
Variable CAGE distance has shown, measured by coefficient of variation, the lowest variability level among all observed variables. However, there is a spread of 1,236,234 points in CAGE distance between the countries with the lowest CAGE distance (Greece) and the highest CAGE distance (Australia).
The following four international trade variables are all given as percentages of GDP. In some countries, import and export shares are higher than 1% of GDP, whereas in other countries foreign direct investments outflow and foreign direct investments inflow shares go below 0%. Among the four international trade variables, the highest variability level has foreign direct investments outflow.
Descriptive statistics results for variables GDP per capita in 2015 and 2016 are quite similar. The differences in GDP per capita between countries are especially obvious if ranges are observed. Coefficients of variations just confirmed great inequalities in economic development levels between the observed countries. If the relative changes in GDP per capita values in 2016 compared to 2015 values are observed, it can be concluded that the differences in GDP per capita growth are also very different between the countries.
In Table 3, Pearson’s correlation matrix is given. The highest positive statistically significant correlations can be found between variables GDP per capita in 2015 and 2016 (0.996) and between variables export 2016 (% GDP) and import 2016 (% GDP) (0.903). On the other hand, the lowest negative statistically significant correlations are between variables economic cost of violence (2016, % GDP) and GDP, USD/per capita (2015) (−0.303), variables economic cost of violence (2016, % GDP) and GDP, USD/per capita (2016) (−0.312), and between variables economic cost of violence (millions, 2016 PPP) and import 2016 (% GDP) (−0.306). Variable CAGE distance has a statistically significant correlation only with variable import 2016 (% GDP) (−0.181). Similarly, variable GDP change (2016–2015) has a statistically significant correlation only with variable economic cost of violence (2016, % GDP). It turned out that other variables have statistically significant correlations with more variables than the two mentioned variables.
Pearson’s correlation matrix, h = 11 variables, n = 119 countries.

Source: Authors’ work. FDI: foreign direct investments.
*Statistically significant correlations at the 5% significance level.
K-means cluster analysis
The K-means clustering procedure was applied to group the observed countries according to the values of the 11 observed variables. In this statistical nonhierarchical approach to the cluster analysis, the maximum average distance approach was used to estimate initial centroids. 55 Based on the Euclidean distances, which were used as a distance measure, countries were assigned to certain clusters. Because that was an iterative process where the final solution was not found in the first step, the contents of clusters were changed.
Before the clustering procedure was started, all variables were normalized. The normalization was conducted by taking into account the smallest and the largest values of each variable. Linear transformation was used to convert variables data into a specific range. 56
In order to find the best solution or solution with the lowest estimated error rate, the v-fold cross-validation approach was applied. 57 According to previous research, it is enough to draw 10 (v = 10) random subsamples to estimate error rates and compare them between different cluster solutions. 54 In order to easily determine the most appropriate number of clusters, the graph of sequence is drawn and it is shown in Figure 3. The cost sequence graph shows the error function for different number of clusters. Error function presents average distances of observations in subsamples to the assigned cluster centroids. 56,58

Graph of the cost sequence.
According to Figure 3, the error function is significantly decreasing up to the cluster solution with six clusters. The cluster solution in which seven clusters are formed has a higher error function value than the solution with six clusters. Consequently, the solution with six clusters is selected as the most optimal one and it will be observed in the further analysis.
In Table 4, the results of the ANOVA of the variables used in the cluster analysis are shown. All results in the ANOVA table are suggesting that the null hypothesis, where it is stated that the means between the analyzed variables are equal, can be rejected. On that way, the given results confirmed that the decision to use six clusters in the cluster analysis is justified.
ANOVA table, k-means clustering, h = 11 variables, k = 6 clusters, n = 119 countries.
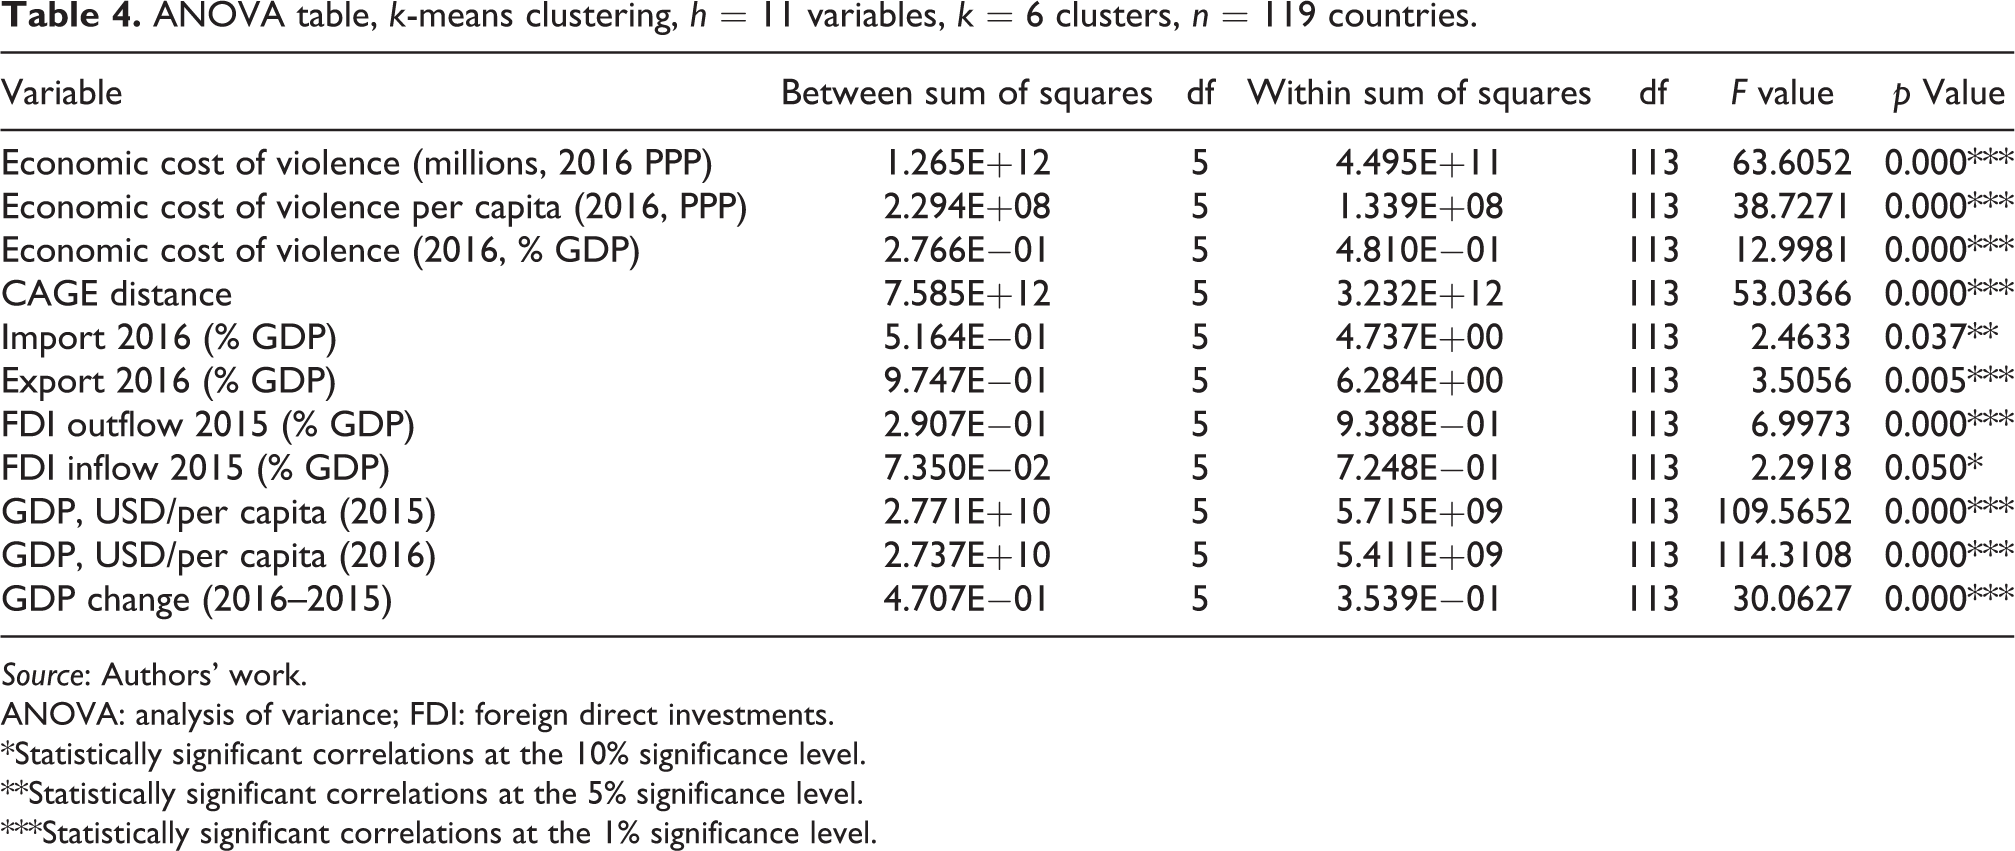
Source: Authors’ work.
ANOVA: analysis of variance; FDI: foreign direct investments.
*Statistically significant correlations at the 10% significance level.
**Statistically significant correlations at the 5% significance level.
***Statistically significant correlations at the 1% significance level.
According to Table 5, the largest cluster contains 45 countries, whereas the smallest cluster consisted of only three countries. Furthermore, in Table 5 and Figure 4, cluster means for each of the 11 observed variables are shown. By comparing cluster means, some interesting conclusions about countries in clusters can be brought. According to Table 5 and Figure 4, it can be concluded that the highest average economic cost of violence per capita (2016, PPP) and economic cost of violence (2016, % GDP) have countries from cluster 1, whereas the lowest average economic costs of violence have countries from cluster 3. The lowest average CAGE distances have countries from cluster 1. On the other hand, the highest average CAGE distances have countries from cluster 5. The highest average import shares in GDP in 2016, but average export share in GDP in 2016, have countries from cluster 3. On the other side, regarding import and export share in GDP in 2016, countries from cluster 2 can be found. In average, the highest foreign direct investments outflow and foreign direct investments inflow had countries from cluster 1. Convincingly, in average, the highest GDP per capita in 2015 and 2016 had countries from cluster 3. Countries from cluster 4 had in average the lowest GDP per capita in 2015 and 2016. It is worrying that countries in cluster 4 have in average the highest negative GDP change or GDP growth rate also.
Cluster means, k-means clustering, h = 6 variables, n = 119 countries.
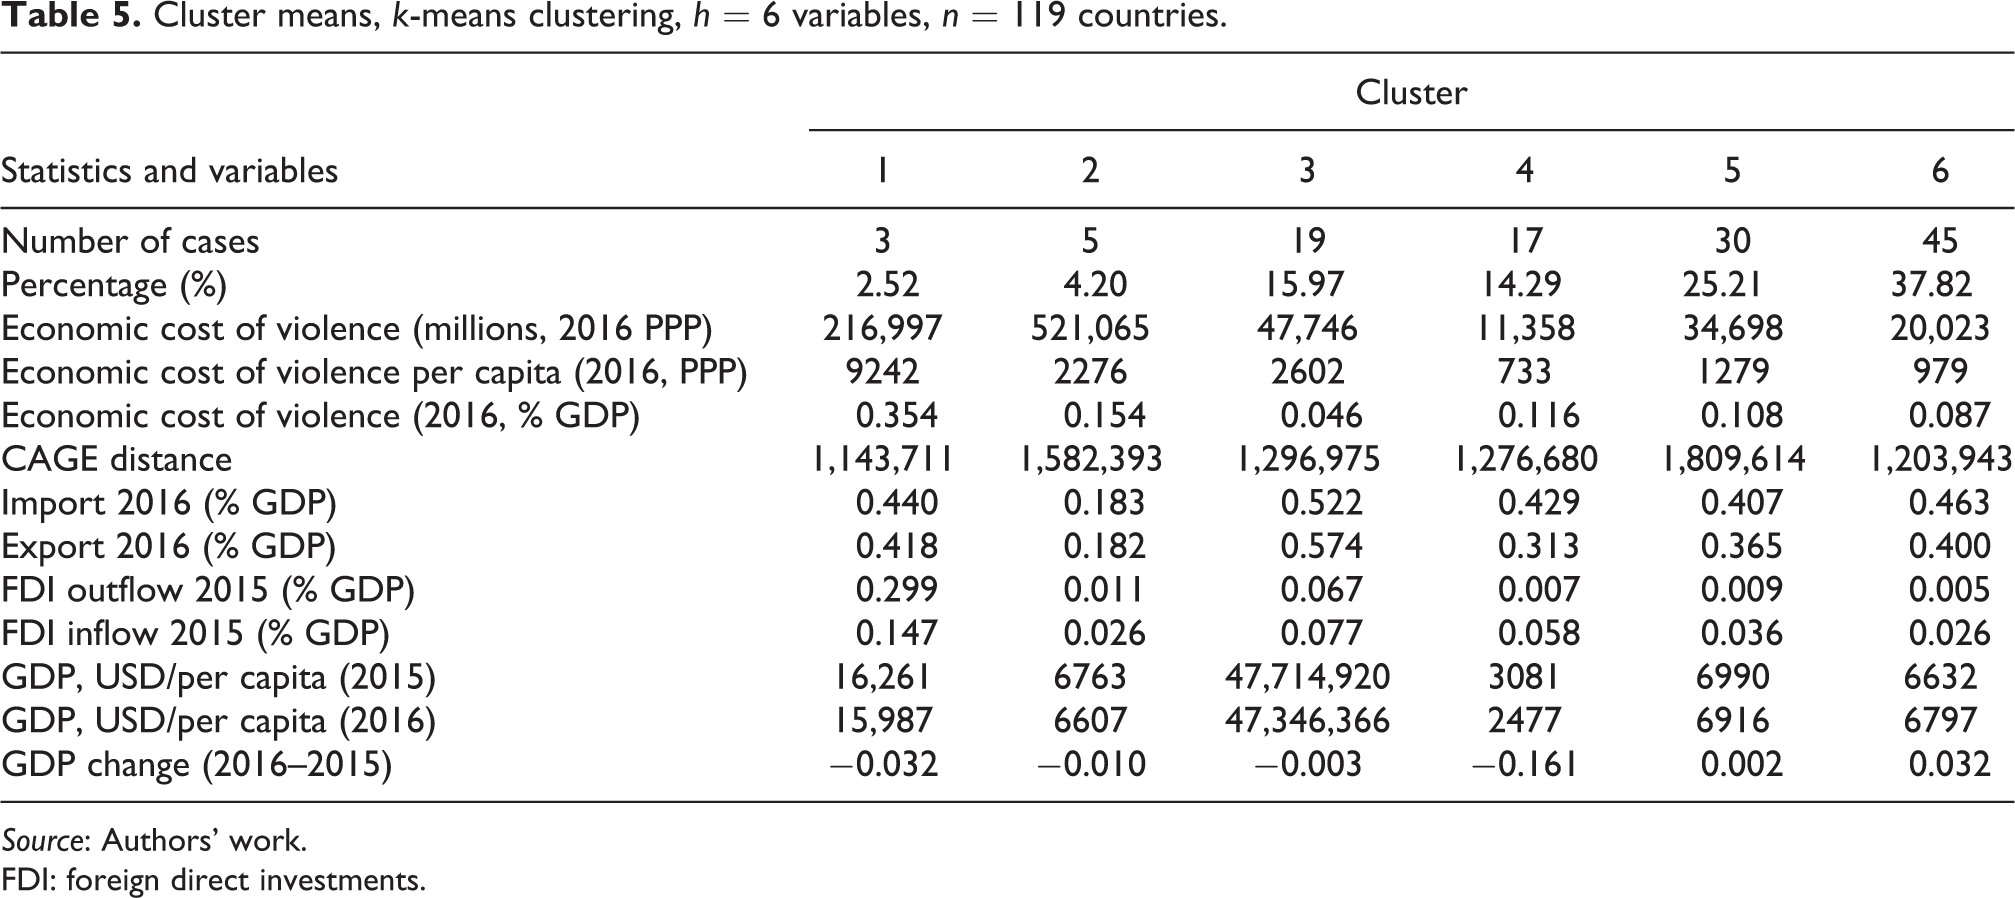
Source: Authors’ work. FDI: foreign direct investments.

Graph of the clusters means.
In Figures 5 and 6, distributions of the observed variables across clusters are given. The more distributions narrow is; the more similar variable values have countries in the same cluster. For example, if the graph of distributions for variable economic cost of violence per capita (2016, PPP) in Figure 5(b) is observed, it can be concluded that countries in cluster 1 have more different values of the observed variable than countries in cluster 4. That conclusion can be brought because cluster 1 has a higher standard deviation and wider distribution than cluster 4. However, at the same time, it can be concluded that countries in cluster 1 have statistically significant higher economic cost of violence per capita (2016, PPP) than countries in cluster 4. In a similar way, other parts of Figures 5 and 6 can be commented also.

Distributions of variables across clusters, (a) economic cost of violence (millions, 2016 PPP); (b) economic cost of violence per capita (2016, PPP); (c) economic cost of violence (2016, % GDP); (d) CAGE distance; (e) import 2016 (% GDP); and (f) export 2016 (% GDP).

Distributions of variables across clusters, (a) FDI outflow 2015 (% GDP); (b) FDI inflow 2015 (% GDP); (c) GDP, USD/per capita (2015); (d) GDP, USD/per capita (2016); (e) GDP change (2016–2015).
Figure 7 represents the distribution of clusters according to their geographical positions on the world map. It can be noted that in most cases, countries that are geographically relatively near are classified in the same cluster. Furthermore, Figure 5 reveals that some countries were not observed in the analysis. The largest country that was omitted from the analysis was the United States.
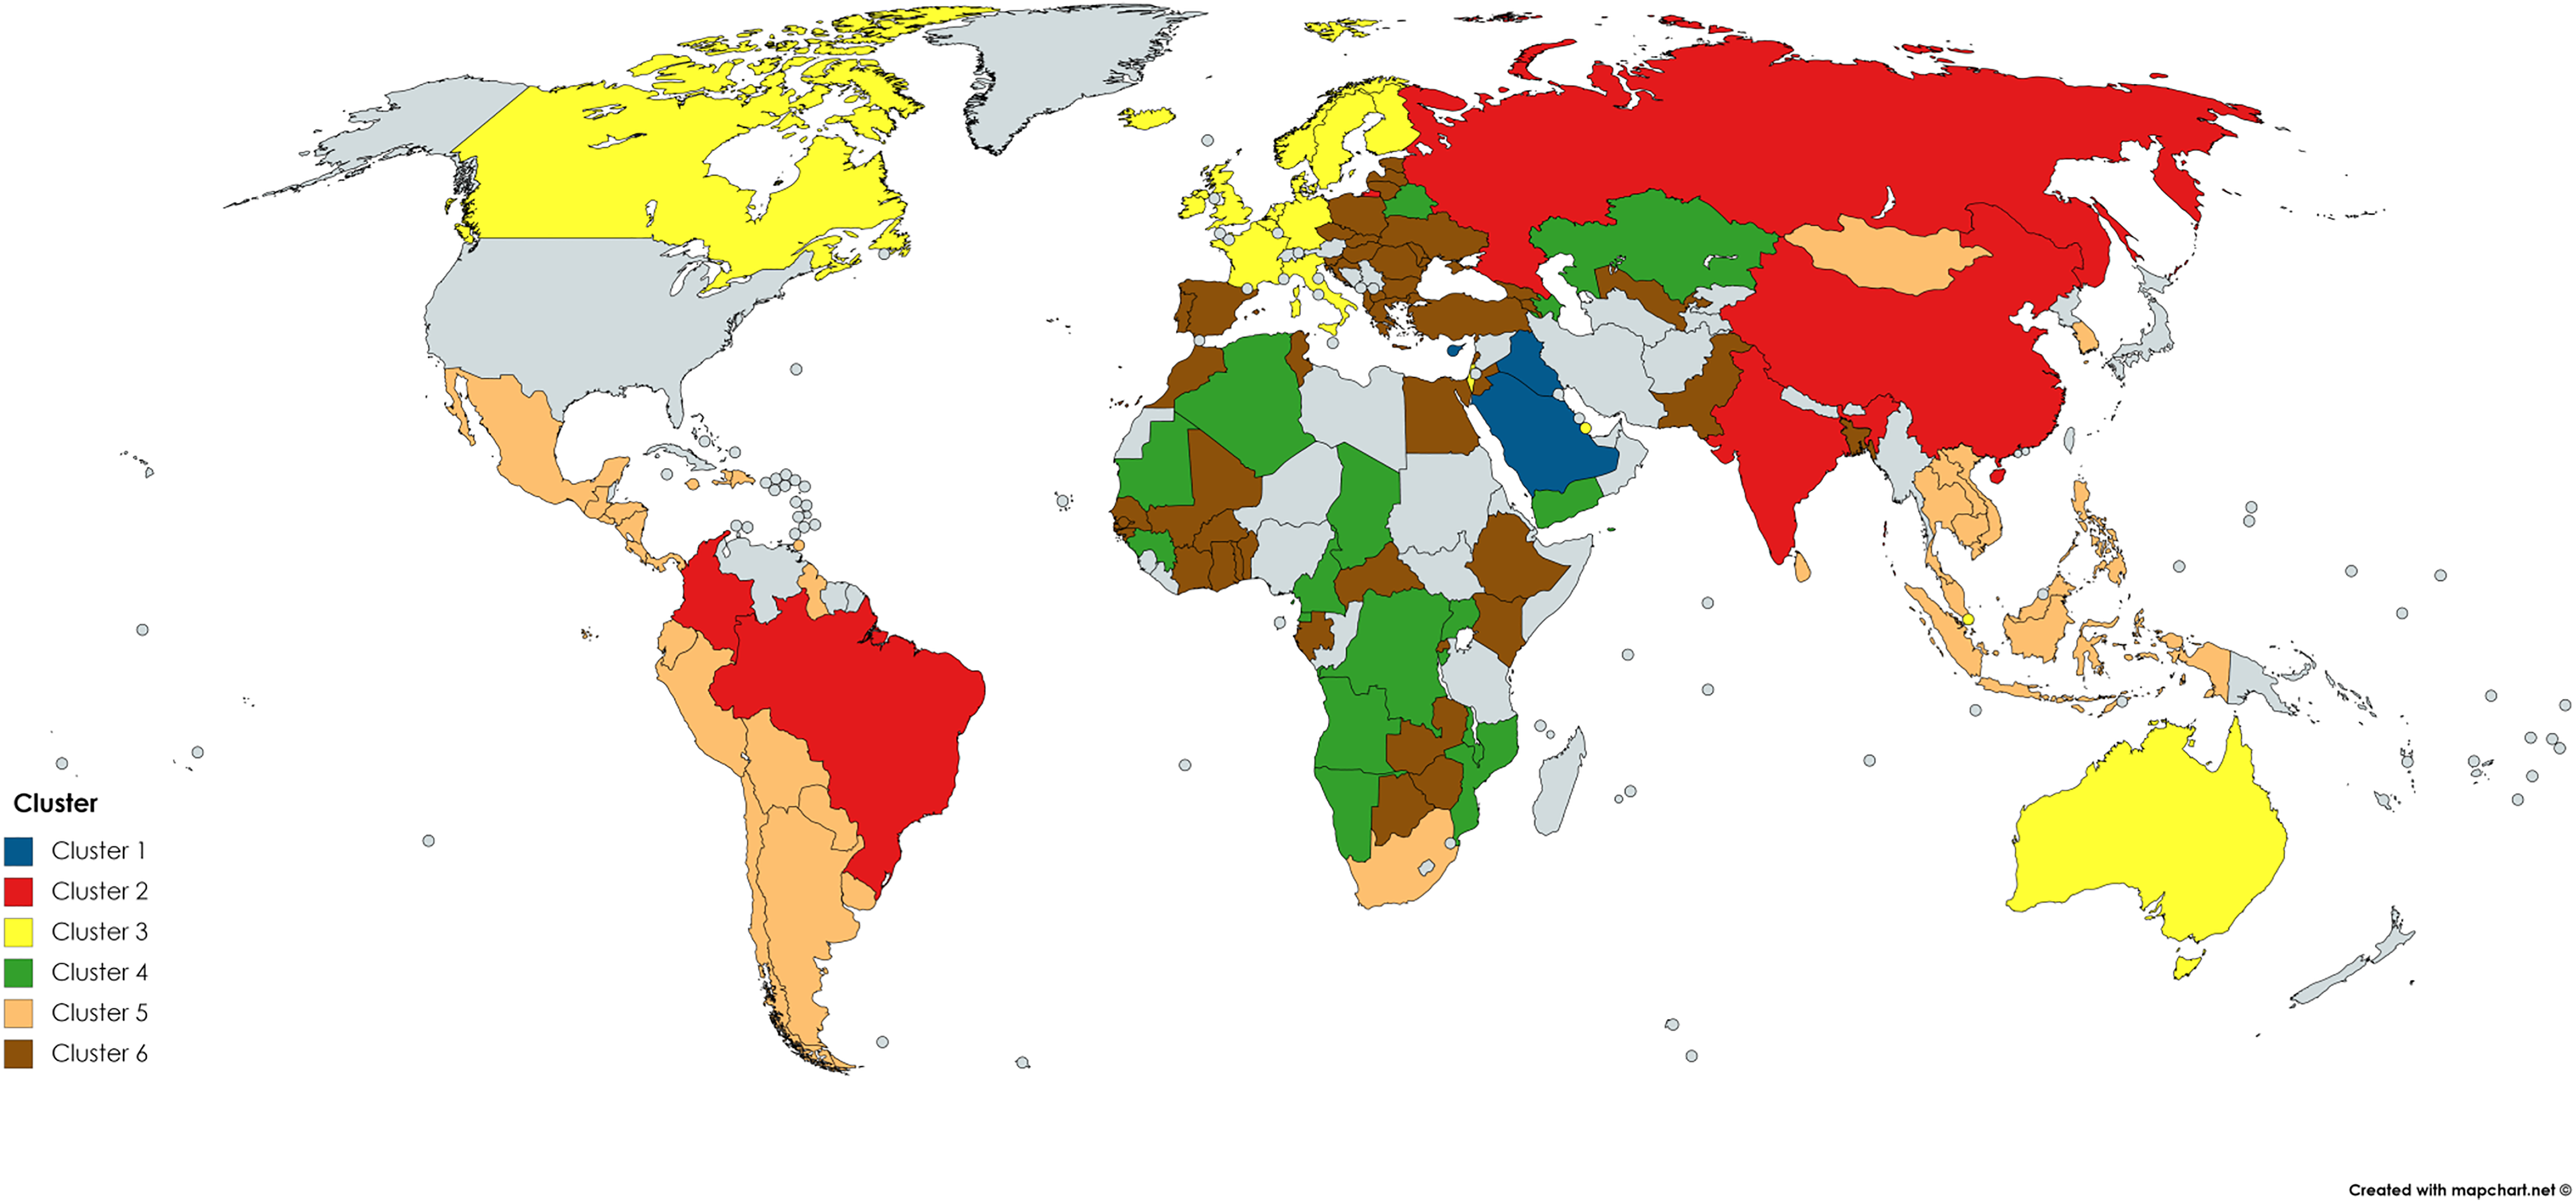
World countries according to clusters. Note: Grey color indicates countries that were not included in the analysis. Source: MapChart, 59 authors’ work.
The first cluster is made up of one European country (Cyprus) and two Asian countries (Iraq and Saudi Arabia).
The second cluster consists of Latin American countries, namely Colombia and Brazil, then Eurasian Russia, as well as two Asian countries—India and China.
The countries of four continents are in the third cluster: Asia (Israel, Qatar, United Arab Emirates, and Singapore), Europe (United Kingdom, Germany, France, Sweden, Belgium, Italy, Finland, Netherlands, Norway, Ireland, Denmark, Austria, and Iceland), Canada in North America, and Australia.
The fourth cluster shares three Asian countries (Yemen, Azerbaijan, and Kazakhstan), one European country (Belarus), and Mauritania, Namibia, Burundi, Chad, Democratic Republic of the Congo, Uganda, Algeria, Angola, Cameroon, Guinea, Mozambique, Malawi, and Equatorial Guinea from Africa.
Fifth cluster contains developed countries with low conflict costs. These are Honduras, El Salvador, Jamaica, Guatemala, Trinidad and Tobago, Mexico, Panama, Dominican Republic, Nicaragua, Haiti, and Costa Rica from North America, South Africa, Guyana, Bolivia, Peru, Paraguay, Ecuador, Argentina, Chile, and Uruguay from South America, and Mongolia, Philippines, Cambodia, Sri Lanka, Vietnam, Laos, Thailand, South Korea, Malaysia, and Indonesia from Asia.
The sixth cluster is associated with developing countries and less developed European countries. More precisely, these are Central African Republic, Botswana, Mali, Gambia, Rwanda, Côte d’Ivoire, Guinea-Bissau, Zimbabwe, Egypt, Gabon, Ethiopia, Tunisia, Senegal, Benin, Kenya, Togo, Morocco, Burkina Faso, and Ghana located in Africa; Ukraine, Georgia, Armenia, Macedonia, Bulgaria, Albania, Lithuania, Moldova, Estonia, Portugal, Croatia, Latvia, Poland, Greece, Hungary, Romania, Slovakia, Czech Republic, Spain, and Slovenia located in Europe, and Pakistan, Turkey, Jordan, Lebanon, Uzbekistan, and Bangladesh from Asia. Appendix 1 contains an overview of all countries by clusters.
Conclusions
In addition to the challenges inside a company, companies have to deal with the challenges that come from their near or further environment. All those challenges in the environment have certain negative effects on companies and their successfulness. Moreover, those negative effects keep companies and, at the same time, countries away from reaching their full potential and possible economic development level. The stronger are and the longer those negative effects last, the higher the negative impact on the whole economy of a country is.
In this article, the impact of the economic costs of violence, as just one challenge from the environment, on economic development level is observed. In the analysis, 119 countries worldwide were observed. The impact analysis is based on the CAGE model, which consisted of four complex domains: Cultural, Administrative, Geographic and Economic differences. In addition, 10 additional variables are carefully selected to include the additional measures of the economic costs of violence and of economic development levels of the observed countries.
Despite the fact that the economic costs of violence in average in 2016 were 0.1% of GDP, the correlation analysis has shown that there is a statistically significant moderate positive correlation between the economic costs of violence per capita and GDP per capita. Accordingly, the more developed countries should have higher costs of violence. In order to group the observed countries according to their economic costs of violence and economic development levels, the k-means clustering procedure is applied. The graph of the cost sequence suggested that six clusters of countries are the most optimal solution. Accordingly, six clusters of countries are recognized and their characteristics were discussed. It turned out that in a large number of countries, the economic costs of violence are not the key obstacle to achieving high economic development levels. Namely, despite low economic costs of violence, there is a large number of countries with rather low economic development level. On the other side, there are a relatively small number of developed countries with large economic costs of violence (countries from clusters 1 and 2), but there are also some undeveloped countries with large economic costs of violence (countries from cluster 4).
The main limitation of the article can be found in the choice of variables that are used in the analyses. In the further research, variables oriented to the same period should be used.
Footnotes
Declaration of Conflicting Interests
The author(s) declared no potential conflicts of interest with respect to the research, authorship, and/or publication of this article.
Funding
The author(s) received no financial support for the research, authorship, and/or publication of this article.
Appendix 1
Country membership according to clusters.

| Cluster | Continent/Country |
|---|---|
| 1 | Europe: Cyprus Asia: Iraq, Saudi Arabia |
| 2 | Colombia, Russia, Brazil, India, China |
| 3 | Israel, Qatar, United Arab Emirates, France, Sweden, Belgium, United Kingdom, Germany, Australia, Singapore, Italy, Finland, Netherlands, Norway, Ireland, Denmark, Austria, Canada, Iceland |
| 4 | Yemen, Azerbaijan, Mauritania, Namibia, Burundi, Chad, Democratic Republic of the Congo, Uganda, Algeria, Angola, Kazakhstan, Belarus, Cameroon, Guinea, Mozambique, Malawi, Equatorial Guinea |
| 5 | Honduras, El Salvador, South Africa, Jamaica, Guatemala, Trinidad and Tobago, Mexico, Guyana, Panama, Dominican Republic, Mongolia, Philippines, Bolivia, Nicaragua, Haiti, Peru, Paraguay, Costa Rica, Ecuador, Cambodia, Sri Lanka, Vietnam, Laos, Argentina, Chile, Thailand, Uruguay, South Korea, Malaysia, Indonesia |
| 6 | Central African Republic, Botswana, Ukraine, Pakistan, Mali, Georgia, Turkey, Gambia, Rwanda, Côte d’Ivoire, Jordan, Guinea-Bissau, Zimbabwe, Egypt, Lebanon, Gabon, Armenia, Uzbekistan, Ethiopia, Tunisia, Senegal, Benin, Macedonia, Kenya, Bulgaria, Togo, Albania, Lithuania, Morocco, Moldova, Estonia, Portugal, Croatia, Latvia, Poland, Greece, Hungary, Burkina Faso, Romania, Slovakia, Czech Republic, Spain, Bangladesh, Slovenia, Ghana |