
Abstract
Actual economic crisis initiated numerous debates on fiscal policy of the European Union (EU) and unrealistic convergence demands placed upon the Member States, where the emphasis is on fiscal criteria: The budget deficit should not exceed 3% of Gross Domestic Product (GDP) and the public debt must be less than 60% of GDP. The aim of this article is to analyze the impact of the crisis on fiscal variables in selected European countries and to examine the efficacy of conducted reforms through comparing forecasted values, obtained by the least absolute deviation method, with actual values. Analyzed countries are Portugal, Ireland, Greece, Spain, and the Republic of Croatia, the EU countries that were the most exposed to the impact of the crisis and have problems with economic instability. Values were forecasted on the quarter basis for the period 2015 and 2016 using data from 2000 until 2014, and the results show that the proposed method is useful in predicting under unchanged conditions. This leads to the conclusion that analyzed countries did not carry out all the necessary reforms.
Introduction
Members of the European Monetary Union (EMU), as well as accessing countries, are required to meet Maastricht (convergence) criteria. There are four convergence criteria 1 which need to be satisfied if a country wants to become participating country. They are related to general government budget deficit, state debt, exchange rate, and long-term interest rate. Budgetary discipline is examined on the basis of the budget deficit and state debt criteria. General government budget deficit criteria state that the share of the annual general government budget deficit in the GDP must not exceed 3% at the end of the preceding fiscal year. Also, this limit must not be violated in one of the next 2 years. The other fiscal criterion is related to government debt-to-GDP ratio. According to this criterion, gross debt of general government in GDP at market prices must not be higher than 60% at the end of the previous fiscal year. If this is not the case, the share must show a significant reduction trend and must approach the reference values with satisfactory dynamics. In order to ensure that fiscal discipline would be maintained and enforced in the EMU, the Stability and Growth Pact was signed among 28 European Union (EU) countries.
In the article, we focus on five EU countries on which the crisis had the prevalent economic, political, and social impact. They are Portugal, Ireland, Greece, Spain, and the Republic of Croatia. These countries together, except Croatia, were mainly analyzed through the effects of the crisis. 2 –4 Different authors see the origins of the crisis in diverse factors. Some consider that the problem was mainly in banking sector 5 and others incorporate fragility of monetary union into their analysis. 6 Also, reforms that these countries were conducting were under the surveillance of many authors 7,8 and organizations like IMF, ECB, and European Commission. During the global economic crisis, the question of applicability and fulfillment of EU fiscal rules, especially in the Eurozone, arose. Despite the aspirations of the Lisbon Strategy, whose aim was to make the EU the most competitive economy in the world, in a time of global crisis that all countries added new pressure on public finances, it became clear that rules adopted from convergence of Maastricht Treaty and the Stability Pact and growth are unsustainable for EU countries. With the global economic crisis, there has been shown a failure to comply with fiscal rules, which additionally emphasized all the disadvantages of the fiscal system of the EU, initiating many discussions about the future of the Union’s future. Before the crisis, the largest number of EU countries had a relatively stable fiscal position in which many of them had high tax revenues, which allowed them the growth of public expenditures without compromising fiscal discipline. The crisis has stopped the trend of government revenue growth. This happened at the same time when measures for economy stimulation were brought into force. All of this led to a worsening in the budget balance and the crisis has shown all the disadvantages of such fiscal policy of the EU.
The aim of this article is to examine how the financial crisis influenced main fiscal variables (public debt, budget deficit, government revenue, and government expenditure) and what was the effect of reforms requested by IMF, ECB, and European Commission in order to meet Maastricht criteria. The empirical part of the article consists of forecasting fiscal variables for the period 2015 and 2016 using least absolute deviation (LAD) method and comparing them with actual values in these periods. Forecasting will be made using solely past values, without including the influence of external dynamics. Doing so, we can predict how fiscal variables will variate if the situation stays unchanged and no reforms are conducted. On the other hand, if the reforms were properly managed and the implementation goes smoothly, the prediction will be inaccurate.
Forecasting became an interesting and important tool after the Maastricht Treaty and the Stability and Growth Pact were put into the force. Nowadays, it has a significant role in the fulfillment of the European budgetary discipline. 9 There are many papers examining forecasting methods and their accuracy 10,11 since planning in the economy is of great importance for future development. Numerous articles use different econometric and mathematic models for forecasting economic variables. For example, Botric and Vizek used econometric models to forecast seven revenue sources, 12 Dumicic et al. evaluated forecasting model for unemployment rates, 13 Pejić-Bach and Gogala 14 forecasted tourism demand, and Favero and Marcellino used five different types of forecasts for growth and fiscal variables. 15 LAD method was developed as an alternative to the least squares method. LAD is commonly used for the estimation of the parameters of the model 16,17 and its advantage is that it is not sensitive to outliers and produces robust estimates. 18 Due to this characteristic, this method has numerous applications in empirical researches, 19 –22 where it was recognized as is very suitable and efficient method for estimating the parameters and regression analysis. 23
Different forecasting methods have been used to predict some of the fiscal variables, but to the best of our knowledge, there are no papers which use LAD method in predicting fiscal variables on the sample of these four countries. LAD method will be used as a purely mathematical method. The method is robust to sudden changes and outliers in data. Using the method, fiscal variables for next eight quarters will be estimated.
This article consists of four parts. After the introduction, the second section gives a review of the impact of the crisis and conducted reforms in Portugal, Ireland, Greece, Spain, and the Republic of Croatia. The third part is divided into three sections. The first subsection gives the description of used variables, the second explicates LAD method in the analysis of fiscal variables, and the third clarifies four accuracy measures. The fourth part gives the results of forecasting fiscal variables using the LAD method for selected European countries and comparison of outcomes from the naïve model and LAD method. The fifth part of the article brings the conclusion.
Background
In the period of the global economic crisis, the issue of enforceability and fulfillment of fiscal rules of the EU, especially within the Eurozone, was imposed. Despite the Lisbon Strategy’s aspirations for the EU to become the most competitive economy in the world, in times of global crisis that added new pressures on public finances to all countries, it became clear that the convergence rules adopted by the Maastricht Treaty and the Stability and Growth Pact are unsustainable for EU countries.
With the emergence of the global economic crisis, there has been a failure to comply with fiscal rules, which has further highlighted all the shortcomings of the EU fiscal system, triggering many discussions about the future fate and future of the Union. Prior to the crisis, most of the EU countries were characterized by a relatively stable fiscal position, where many of them had high tax revenues, enabling growth of budget expenditures without endangering fiscal discipline. The crisis has stopped the trend of government revenue growth, which, simultaneously with measures to stimulate the economy, has led to deteriorating budget balance sheet. 24 The crisis has shown all the shortcomings of this fiscal policy of the EU, and it was time for new budgetary reforms of the Union and the Member states. Given that the EU is founded with the aim of reducing the differences between the Member states and achieving a level of growth and prosperity for all the inhabitants of the European continent, and because of the constant expansion of the Union, budget reforms are constantly needed. There have been some major reforms at the EU level, such as the first and second Delor’s package and all the multiannual financial frameworks, but all EU countries did not manage to carry out all the necessary reforms in order to maintain economic stability. This article focuses on the reforms of the countries that were highly indebted, with a high budget deficit, public debt, and unemployment rates, and they were the first to experience the impact of the crisis. They are Portugal, Ireland, Greece, Spain, and the Republic of Croatia.
Impact of the crisis to the selected European countries
Portugal, the poorest country in Western Europe, has significantly lagged behind the other Eurozone countries in the growth rates of the last decade. As a result of the uncompetitive and rigid labor market, Portugal has experienced strong effects of the economic crisis on its economy. The crisis in the economy in Portugal had the strongest impact on the budget deficit, which was on the permitted level of 2.8% of GDP in 2007, and in 2009 it grew to 10.2%. This trend, like in all other countries, had the same epilogue: Because of reduced economic activity, there was an increase in government spending, and finally, the public debt has grown to unacceptable level toward convergence requirements.
Ireland, “Celtic Tiger”, was one of the promptest developing economies in the world in the 90s, but skipping a few steps of the transition led Ireland to the position of one of the most indebted countries which was most impacted by the global economic crisis. Ireland based the most prosperous period of its development on attracting foreign investments, mainly American multinational companies, which found Ireland attractive due to the low rate of corporate tax of only 12.5%. In that period, American multinational companies invested in Ireland 25% of all their investments to the EU, which in absolute terms amounted to slightly more than 165 billion dollars. Most of the foreign investments were greenfield investments, which include the construction of new facilities and subsidiaries, what led to the expansion of the construction industry as a backbone of economic growth in Ireland. Investments in the construction industry caused a fourfold increase in the real estate prices, which resulted in a phenomenon known as “real estate bubble.” Real estate bubble has maintained a high growth rate of the debt of citizens, which in a short period of 5 years grew 200% and amounted to 157 billion euros in 2008, mainly due to the large increase in mortgage loans. Irish credit institutions increased lending from 1997 to 2008 to 466%, but the problem was that most of the lending was aimed at financing the construction and financial industries, instead of financing productive branches of the economy, such as health, transport, education, and communications, which remained low. This way of lending was enabled because of the liberalization of lending practices throughout the EU with lower variable interest rates of the ECB and weak cross-border regulation of the financial sector. Considering the dependency of the Irish economy toward the United States, the appearance of the crisis in the United States automatically affected Ireland. Reduction in the access to credit led the credit institutions to a difficult position, and the population has started a bank run—or withdrawing their deposits. In order to prevent uncontrolled withdrawal of deposits, the Irish government gave the state guarantee to all investors and bond owners. Given that the Irish government issued bonds to all those vulnerable institutions, it means that the Irish people became the guarantor for the loans to illiquid and possibly insolvent financial institutions. 25 The crisis in Ireland culminated in 2010 when it recorded the highest rate of the budget deficit in the EU of 30.6%, although by 2008 Ireland recorded budget surplus.
Greece was the first country, member of the EU, in which consequences of the global economic crisis culminated. The reason for that can be found in the fact that Greece had not fulfilled the basic requirements for entrance into the Union and therefore no convergence criteria, but it was admitted because of political and geographical reasons. Irresponsible conduction of fiscal policy in Greece and hiding the real situation in the global financial crisis began to provoke strong pressure on the euro, and there were thoughts about the expulsion of Greece from the Eurozone. The deficit and public debt in Greece in the last few years have a distinct tendency to increase, and nowadays very seriously exceed the limit of the convergence criteria which culminated in 2013 when the public debt stood at 175% of GDP, while the budget deficit began to fall, but it still was at 12.7% of GDP. In addition to the problems of high budget deficits and public debt, Greece from the very beginning of the crisis has high unemployment, which according to forecasts in 2013 has grown to alarming 27.5%. 26 It is obvious that the world economic crisis strongly affected the already vulnerable Greek economy, which led to a reduction in its economic activity, increased unemployment, reduction of inflation, reduction in GDP, and a negative impact on the current balance of the country.
Spain was also faced with large budget deficits, high levels of public debt, and a high unemployment rate of 18% in 2009, which was the highest unemployment rate in Europe at that time. At the very beginning of the crisis, the Spanish financial institutions were heavily affected, so in May 2010, when the Spanish central bank took overindebted CajaSur bank, it represented an additional burden on the public finances of Spain. In 2009, the budget deficit reached its maximum of 11.2%, until 2013, it was reduced to not so insignificant 7.1% of GDP. 24 The fact is that in 2008 the same figure was 4.5% of GDP, showing what negative effects the crisis has had on the Spanish budgetary policy. The sharp rise in the deficit was accompanied by higher government spending, which could not be financed by its own sources, which led to external borrowing, or a rise in a public debt. 27
Croatian economy was also influenced by the global economic crisis and the consequences were long-term. Unemployment rose, the fall of GDP in 2009 was 7.4%, public debt started to grow rapidly, and it rose from 39.6% of GDP in 2008 to 86.6% by the end of 2014. But, the crisis in the Republic of Croatia did not occur solely because of the global financial crisis. Namely, the domestic economy was in great trouble before the financial crisis. The great economic growth that the Republic of Croatia had before the crisis, which took place in 2008, has been halted suddenly. The decline was also felt by industrial production that lost the most, and a major drop was in the consumption of citizens. Domestic demand was one of the main drivers of the national economy. In the period from 2001 to 2008, it rose at a rate of more than 6% points, which was faster than GDP growth. As a result of the fall in real net incomes and a fall in the number of employees, during 2009 and 2010, real household spending fell by almost 10%.
The global financial crisis caused huge economic, political, and social problems in the analyzed countries. Every country tried to manage these problems according to their economic and political heritage, but, as member states, they had obligations toward the EU. In order to help the countries which were struggling to survive when the crisis started to take a roll, EU established an aid program conducted by the three integrations: the European Central Bank (ECB), the International Monetary Fund (IMF), and the European Commission. These three institutions are in charge of lending and monitoring countries that have serious economic obstacles.
Reforms in the selected European countries
Portugal, as well as other countries which have been strongly influenced by the economic crisis, had to implement reforms required by the EU to be eligible for additional financial assistance. The main requirement is to meet the convergence criteria. The previously mentioned problems of Portugal, such as slow growth and stagnation, have been accompanied by a high unemployment rate of 16.4% in 2013. 28 By orders of three integrations, Portugal had to implement certain reforms in order to continue to receive aid packages. Some of the implemented reforms were public sector wage reduction, reduction of public spending, social benefit allocation reduction, implementation of pension system reforms, an increase of value added tax (VAT) rate from 21% to 23%, abolishment of certain tax reliefs, and the introduction of new taxes on some of the financial transactions. A new program is developed to encourage entrepreneurship and increase competitiveness, and the corporate tax rate was reduced from 25% to 23%. The reform of the labor market started in 2010, and its main part consisted of a workers’ retraining program and also included salary reforms with greater participation of users in the special system of public health insurance for the purpose of self-financing of these systems. According to the recent reports, good savings measures and budgetary reforms were carried out in Portugal, as well as privatization of the banks and larger companies in the service sector and liberalization of the whole system. 29
Ireland was faced with an increase in public debt and unemployment during the period between 2008 and 2010, so the Irish government has requested assistance from the IMF and the EU, and took the assistance program. To obtain a loan, Ireland has had to meet certain requirements, for which it was necessary to make a lot of reforms. Upon entering the program of assistance in 2010, Ireland has received several key guidelines that had to be fulfilled in the 4-year period. The government has received a commitment to achieve fiscal consolidation of €15 billion and by the end of 2014, a budget deficit of 3%, which is in line with the convergence rules, was achieved. One of the conditions was the stabilization and control of the banking sector. 30 At the end of 2013, Ireland has left the assistance program because they had clearly set goals for further development: to achieve sustainability of the public system, reform the financial sector, and realize growth potentials; 290 different actions and reforms were carried out. There were reforms for sustainability and reduction of public debt and measures to foster competitiveness, stimulating small and medium-sized enterprises where the Government stimulates entrepreneurs financially. Also, a program aimed to reduce unemployment with retraining employees and reducing youth unemployment was adopted. There was a significant reform of the health system and measures that encourage competition, prevent corruption and irregularities, and protect customers. The programs were so far proven to be effective and it is evident that the Irish economy is recovering. 31
Greece was the biggest problem in the EU and the whole EU was included in rescuing Greece. By 2014, it received over 200 billion euros, for which it was obliged to conduct a series of reforms of its budgetary system. The main objections of three integrations, the ECB, the IMF, and the European Commission, are too high public spending, increasing the budget deficit and public debt, and also the inability for paying loans. All of that causes the greatest fear for the macroeconomic and overall stability of Greece and therefore the EU as monetary and economic integration. In 2013, Greece had to pay the first installment of the loan, so in 2009 has begun with rigorous reforms, which have sparked protests and riots across the country. In late March 2014, the Greek parliament passed a new law which includes over 100 reform measures to increase savings in public spending and reduce the number of employees in the public sector by about 20%, which is approximately by 150,000 people less with regard to 2010. Salaries in the public sector have been reduced by one-third, and new measures are introduced to encourage the development of small and medium entrepreneurship as a backbone of development and to increase competitiveness in the domestic and foreign markets. There are some triggered incentives for young entrepreneurs and also for sectors and some industries. The power of the unions and negotiating collective agreements enhanced, which led to the increase of the flexibility of labor. The new reforn increased minimum wage, but the Government has to increase taxes in order for a state to be able to repay received loans and to be qualified for another additional aid. 32 In December 2014, the IMF froze the disbursement of aid to Greece in the amount of 35 billion euros, due to early parliamentary elections in which the government could take over a radical leftist party, thus accepted fiscal reforms were brought into a question.
Spain was compelled to undertake emergency reforms according to the instructions of the three integrations. They include reducing budget spending that comprises wage cuts and jobs in the public sector, reducing allocations of the pension system and the suspension of public investment. Such saving reforms in the budget triggered massive riots all over Spain because of the Spanish government, at the request of integration, even changed some points of the Constitution. Spain has first started with fiscal consolidation, implementation of structural reforms in order to achieve greater competitiveness of the economy and achieve financial stability. 33 Consumption in public administration and health services are reduced, and the pension system was reformed in order to become sustainable. The conduction of reform of the tax system was aiming at strengthening the effectiveness. According to these tax reforms, the income tax rate increased from 18% to 21%, and the main goal was to repress corruption and the “grey economy” in order to increase the number of taxpayers. Reform measures to reduce unemployment have also proven to be successful because in 2014, the number of unemployed was reduced and 151,000 new working places have been opened. This program introduced a system of retraining employees leading to the strengthening of the worker’s union. Apart from these reforms, government started implementation and legal reforms of transport, energy, and educational system and also have passed a package of measures to stimulate further development. 34 Further improvement and implementation of the measures are planned to be done, and it is expected that the measures, with effective implementation, can contribute to the lasting reduction of Spanish debt and deficit.
The Republic of Croatia had spent 8 years in negotiations for the EU membership, so it is logical to conclude that during that period, a large number of reforms were requested by three integrations and made by the Croatian government. Reforms of the national budget are present in the Republic of Croatia every year because since 1991, there have been more revisions than years. Over the past several years for the Republic of Croatia is the typical constant growth of public debt, unemployment, and continuously present budget deficit, which clearly indicates that the Republic of Croatia doesn’t fulfill the conditions of convergence criteria. The EU through preaccession, the accession negotiations for membership in the EU, and even nowadays, in front of the Croatian government has placed a number of conditions and reforms which should be implemented. Apart from the convergence criteria, which are certainly a key requirement, the Croatian government should, by following three integrations, strive to maintain macroeconomic stability, accelerate structural reforms, and better use of EU funds. One of the key problems is enormous public administration and the full negligence of private sector. In such context, structural reforms are necessary, especially the release of the employees in the public sector. The Republic of Croatia has the third highest unemployment rate in the EU; in order to change that, it is necessary to stimulate economic growth, which requires investments which are currently on a really low level, primarily because of complicated and unnecessary bureaucratic actions. A major problem is a social system and unsustainable pension insurance system, which are a huge burden on the budget. Many reforms are made, but the European Commission and the World Bank require further improvements and reforms in order to achieve the required objectives and achieve economic growth in the Republic of Croatia, and therefore prosperity for all other countries, member states of the EU.
None of the analyzed countries had done their best in budget management since they all have high budget deficits and public debt. These countries are the countries that were the most affected by the crisis. Although they created high budget deficits and public debt, and unemployment rates are also high, it can be stated that they carried out some adequate reforms from the time they entered in aid program of financial and advisory help from European integration. All observed countries performed significant structural reforms and made an upturn in fiscal policy management. Accomplished reforms have consequences in short run but the question is will that be enough to make changes in the long run. The decrease of the budget deficit was achieved by an increase in public debt, and the main reasons are loans from three integrations. Such measures lead to relatively miserable living conditions for population, but if the reforms are well conducted, these conditions should affect only the short run. Hence, conducted reforms should bring prosperous future once economies restart.
Methodology
Data
In the article, five countries of members of the EU were observed: Portugal, Ireland, Greece, Spain, and the Republic of Croatia. All of the selected countries had problems in complying with the convergence criteria, and in order to avoid spillover effect on other countries, three EU countries were provided then with extensive loans through various aid schemes. In order for a country to have the right to aid packages, it had to implement many of the aforementioned reforms in order to achieve the required standards posed in front of them. Although numerous reforms were carried out and various measures were introduced, further reform and restructuring of the systems are necessary, especially in the public sector, since this is not an easy task, and it takes time for visible results to emerge in the long run.
Data on general government revenues, expenditures, budget deficit, and public debt for each of the observed countries in the period between 2000 and 2014 were used in order to analyze the efficacy of the reforms. Variables and their measurements are described in Table 1. Data for all countries included in the analysis were taken from the Eurostat.
Observed variables.

Source: Authors’ work according to Eurostat and Organization for Economic Cooperation and Development (OECD).
LAD method in the analysis of fiscal variables
Fiscal variables (government revenues and expenditures, public debt as percentage of GDP, and government deficit as percentage of GDP) can be forecasted by observing their values in the past
where y(n) is the value of the observed fiscal variable in quarter n. y(n − 1) is the value of the observed fiscal variable in last quarter (n − 1), y(n − 3) is the value of the fiscal variable in three quarters ago, and y(n − 4) four quarters ago. Last quarter (n − 1) is used because values y(n − 1) are initial for fiscal values in quarter n. Quarter n − 4 was exactly 1 year ago before observed n. Assuming the same quarter in consecutive years has similar behaviors in the meaning of the revenues and expenditures, use of quarter n − 4 is justified. Quarter n − 3 was right after n − 4, and consequences of the quarter n − 4 are directly visible in quarter n − 3. Using that assumption, consequences of the quarter n − 1 will be directly visible in observed quarter n. Quarter n − 2 is not considered since its impact on the result is not significant.
To calculate unknown parameters a, b, and c, several shifts of research data must be observed. Equation (1) is transformed into matrix equation
where matrices are
If estimated parameter is 
L2 norm or least square deviation (LSD) method-based cost function is

where 
Although the parameters are given straightforward using LSD and equation (3), in this article, LAD method is used. The LAD method is robust to sudden changes in the values of the fiscal data and to outliers that could appear in the fiscal data.
35,36
The LAD approach is convex, but an explicit solution does not exist, only iterative and numerical algorithms. The LAD method-based cost function is
35

First LAD solution is given by Bošković in 1757. 37 Nowadays, solutions based on iteratively reweighted least squares, 38,39 linear programming (LP), 40,41 and steepest descent 42 approaches are used.
Iteratively reweighted least squares method uses the solution given by weighted least squares method and further algorithm
35,36
as follows: Take some initial Calculate the elements of weight matrix Find estimated parameters If
The method slowly converges to the global minimum.
The second way for finding parameters by L1 norm is based on LP. The cost function can be stated as

where ti are nonnegative slack variables. 39 Modern approaches to solving LP problems are based on an interior point method. 43 The method gives a global minimum as a solution, but it could be memory demanding.
Widespread steepest descent method is introduced by Singleton. 44 The method is based on finding the steepest descent slope at some initial point and descent along the slope. 42,45 The method is fast, but unfortunately it does not necessarily converge to the global minimum. Which method will be used depends on a number of unknown parameters and number of last fiscal values. All methods should converge to the same results.
Once the parameter
Evaluating forecast accuracy
In order to evaluate the proposed method in predicting future values of fiscal variables, forecasting results of the naïve model and the LAD method (denoted by 


where n denotes observed quarter in time and T is the number of observed quarters, for example, the number of pairs of actual values and forecasts. 12 Each accuracy measure has benefits and weaknesses, and forecast is more accurate if the values of accuracy measures are smaller.
Results and discussion
Parameter estimation for fiscal variables using the LAD method for selected European countries (2000–2014)
The method of LAD minimization, specifically application of minimum LAD criterion, was applied to quarterly data for the period 2000 and 2014 for each country separately according to their availability. For parameter estimation and forecasting, software MATLAB was used. Estimated parameters for the observed variables by country are given in Table 2.
Estimated parameters using LAD method for public debt, deficit, government income, government revenue, and unemployment rates (2000–2014).
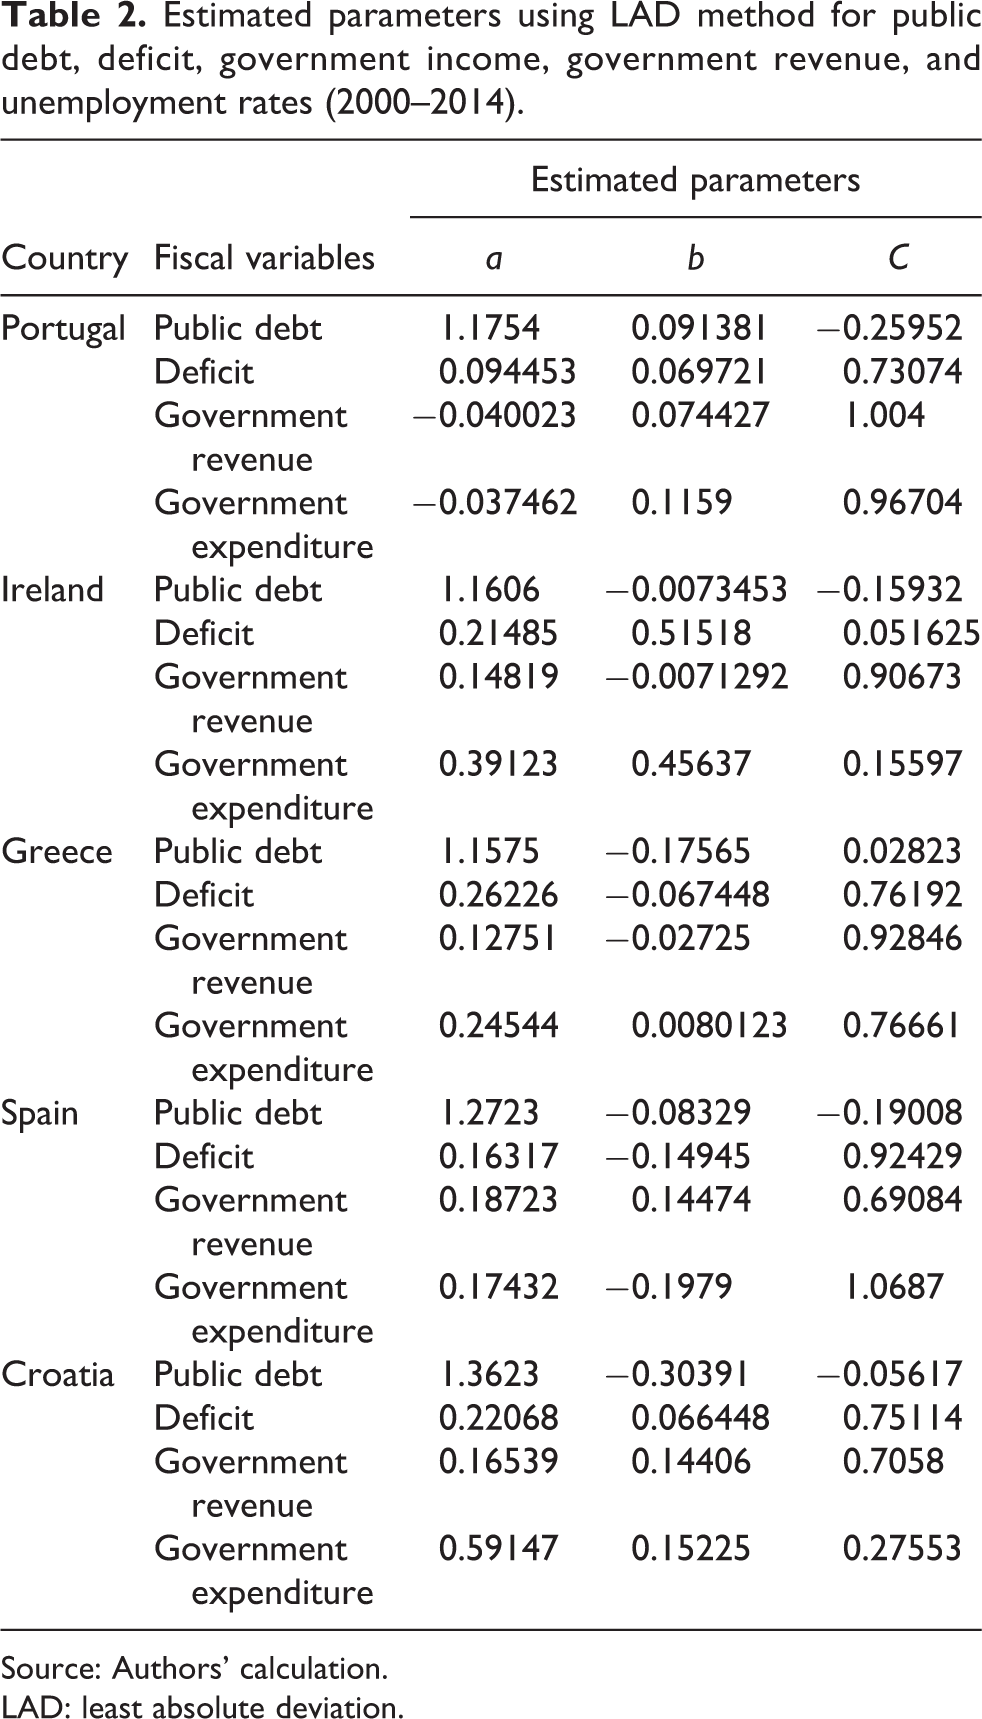
Source: Authors’ calculation.
LAD: least absolute deviation.
Estimated parameters are calculated for each fiscal variable (public debt, deficit, government revenue, and government expenditure) separately. Parameter a is connected to the value of the observed fiscal variable in last quarter, b to the value of the fiscal variable three quarters ago, and c to the value four quarters ago, as is given in equation (1).
Forecasting fiscal variables using the LAD method for selected European countries (2014–2016)
In this subchapter, obtained results for forecasted movements of the analyzed fiscal variables, government revenues and expenditures, public debt as percentage of GDP, and government deficit as percentage of GDP will be given and explained.
As stated in the previous sections, Portugal has significantly lagged behind the other Eurozone countries in the growth rates since it experienced strong effects of the economic crisis. Its public debt was around 60% of GDP in the period 2000 and 2007. After that, it started to grow rapidly, and in 2014, it reached the level of 129% of GDP. This was due to reduced economic activity, increase in government spending, high deposits, and euro depreciation. According to the calculations using LAD method, it can be seen in Figure 1A that this growth of public debt in GDP will continue in the next eight quarters. When comparing actual and forecasted data in Table 1A, it can be seen that this prediction was correct and the forecast error was the lowest in the last predicted quarter. The strongest impact of the crisis in Portugal was on the budget deficit, which was around −3% of GDP in the period 2000 and 2007 when it was −2.8% of GDP. In only 2 years, it grew to −10.2% of GDP. Portugal managed to decrease its deficit with pension fund revenues and in 2014, it was at the level of −4.9% of GDP. It was predicted that it will move around −3.5% in the predicted period. In Table 1, we can see that Portugal managed to put government deficit under control and even reach surplus in the last observed quarter which could hardly be predicted on the basis of the previous data. Government revenues and expenditures didn’t have severe oscillations. In 2009, Portugal had the lowest level of revenues, but since then until 2014, there has been a minor increase. General government expenditures were increasing until 2010 after which Portugal started to decrease their expenditures. Depending on the quality of conducted reforms and government’s ability to fight against tax fraud and evasion, revenues may increase significantly but according to the past data, they will move around the same level. Actual data show that government revenues and expenditures grew more than forecasted values, which is consistent with the theory about the size and growth of the state.
Among analyzed economies, Ireland had the biggest increase of public debt in the observed period and it grew more than five times. In 2005, it was around 25% and until 2013 it grew to 123%. Due to the fact that it grew so quickly and that it was mainly affected by assistance program from the IMF and the EU, it was predicted that it will decrease in the observed period (Figure 1B). This prediction was correct, and at the end of the observed period, the forecast error was the lowest (Table 1B). Ireland is also specific because of the fact that it recorded the highest rate of the budget deficit in the EU of 30.6%, although by 2008 Ireland recorded budget surplus. Since it managed to achieve sustainability of the public system, reform the financial sector, and realize growth potentials, it is predicted that budget deficit will remain under the convergence level. Not only that it persisted under that level, Ireland in fact reached surplus. The highest level of government revenues was in 2006 when they started to fall until 2009 when they recorded mild increase which was also predicted for the next eight periods. The actual increase was even higher than predicted. Government expenditures were increasing until 2010 and after that Ireland managed to significantly decrease its expenditures. It was expected that they will stay at the same level or slightly decrease in the future, but the reality was that they grew and were following revenues.
Since Greece is the country which accessed to the EU on the basis of political and geographical reasons and didn’t fulfill the convergence criteria, it is still the country with the severe economic situation. In 2013, it had the largest public debt at the level of 175.1% of GDP, a highest public deficit of −12.7% of GDP, the only one whose revenues decreased, expenditures remained at the same level with the slight tendency of decreasing, and the highest unemployment rate of 27.5%. Prediction is that trend of the analyzed variables will continue (Figure 1C) since the economic situation in Greece is uncertain due to the uncertainty on the direction of policy and their willingness to conduct reforms posed by the EU. Public debt continued to grow and was very close to predicted value (Table 1C). Government expenditures and revenues upsurge more than predicted and Greece managed to lower budget deficit and even reach surplus.
Spain was one of the countries which has received significant loans in a form of financial aid, and it is not surprising that its’ public debt grew to 93.9% of GDP although it was only 35.5% in 2007. The prediction was that it will grow but at smaller rates (Figure 1D). Unfortunately, actual data show that public debt grew to 100% of GDP in the observed period (Table 1D). This was due to the high budget deficit, caused by high government spending, which reached its maximum in 2009 at the level of 11.2% of GDP. It should be noted that Spain had the budget surplus of 8% in third quarter of 2007. Based on that data, it was predicted that budget deficit will reduce and will reach −3.25% at the end of eight predicted periods. From all of the selected countries, Spain has the highest revenue which was at the lowest point in 2009 when it started to increase and this trend should continue. The highest level of expenditures was also in 2009 after which they started to decrease but it was predicted that they will increase in the future period. Unfortunately, Spain didn’t manage to put expenditures under control and raised revenues were not enough to cover that difference so there was still a budget deficit of −6.3% at the end of the observed period.
The Republic of Croatia is the youngest and the smallest of the analyzed economies. From 2007, it has a constant growth of public debt and continuously present budget deficit. It has the lowest public debt at the level of 67.1% compared to selected countries and that is the closest to the convergence level of 60%. Public debt was increasing and the predictions were that it will further grow to almost 100% of GDP (Figure 1E). But the Republic of Croatia managed to put its’ growth under control and kept it under 90% of GDP. The budget deficit was the lowest among the observed countries with the value of −4.9% of GDP and it is expected that it will continue to decline. Actual data are even better than forecasted and show that in three quarters, there was budget surplus (Table 1E). Since public debt is predicted to increase, government expenditures will continue to be higher than revenues and it was expected that this trend will continue. Fortunately, actual data show that the revenues managed to exceed expenditures in certain quarters but the rising trend was present in both variables. Nevertheless, European Commission and the World Bank require further improvements and reforms in order to maintain macroeconomic stability, accelerate structural reforms, and better use of EU funds.
Comparison of naïve model and LAD method
In order to determine the lower limit of forecasting accuracy, we compared the results of LAD method with the naïve model for each of the fiscal variables.
For public debt, all of the four accuracy measures show that the naïve model is better in forecasting (Table 1F) since it predicts values in the subsequent period. These values are obtained on the basis of actual data from one previous quarter so they incorporate all measures and reforms taken by one country in order to minimize the share of public debt in GDP. The deficiency of this method is that it predicts only one period ahead so it is not so useful in predicting several periods into the future. Results shown in Tables 1F to 1I show that LAD method can predict farther data with smaller deviation from actual values. Predicting budget deficit solely on the basis of previous data is challenging mission since it heavily depends on the movements of government revenues and expenditures. Also LAD method cannot anticipate sudden economic or other unexpected events and changes since forecasting is made on the basis of data from previous 14 years. The naïve model was better for Spain since it predicted with more accuracy one period ahead, but LAD method was superior for other selected countries when the prediction was made for eight quarters in advance. In predicting government revenues and expenditures, LAD method has shown more accuracy with actual data than the naïve model (Tables 1H and 1I), so we can conclude that proposed method is a useful tool for predicting budget deficit, government revenues, and government expenditures.
Conclusion
Based on the presented facts, it can be concluded that in the period of economic crisis, policies of almost all EU countries have been inclined to budget deficit, which was the cause and the effect of poor public finance management. This ultimately led to endangering macroeconomic stability. The deficit was in all countries caused by economic crisis, and analyzed countries had and still have the biggest problems with its management. The budget deficit is especially caused by decreased public revenues and increased public expenditures which led to borrowing, which increased public debt. Many analysts have criticized ongoing EU fiscal policy during the crisis since most of the member states did not manage to satisfy fiscal boundaries imposed by convergence criteria. This brought to the violation of the credibility of EU as a system and had even caused polemics about the disintegration of the Eurozone. Reforms that are imposed by EU suggest decreasing of public debt, budget deficit which should push economy forward and attract necessary investments what should lead to opening new jobs.
The results of the forecasting show that LAD method is good for predicting on the basis of previous values without external influences. Naïve method exhibited results closer to actual values for public debt since countries were obligated to lower the share of public debt in GDP to satisfy convergence criteria. Conducted reforms in selected countries indicated certain movements so their economies are moving forward and, although still overburdened with debt, all countries except Spain, managed to reach convergence criteria with the public deficit. This leads to the conclusion that reforms were implemented but not in the scope as it was intended and past trends continued for government revenues and government expenditures. Ireland has become a bright example of how to quickly and efficiently lower difficulties and propels economy with their way of conducting reforms and with the help of its population. Even Greece recorded small shift but this is not so visible since this is the most indebted country in the EU. Also, uncertainty on the direction of new government policies is affecting confidence and this may slow down recovery. In order to accommodate EU requirements, the Republic of Croatia implemented the required reforms; however, the work was done poorly. Based on collected data, the Republic of Croatia seems to be doing an inadequate job in implementing reforms, which are conducted only in accordance with and because of EU requirement. Also, the Republic of Croatia’s budget is allocated to wrong and expensive projects that, in the long run, do not promise high returns.
Based on the conducted analysis of the fiscal variables between five selected countries, it can be concluded that balanced budgets have virtually disappeared and public debt has prevailed. Countries should strive to meet convergence criteria but, as can be seen on the example of Ireland, high public debt, if used in a proper manner and on investment projects, can lead to economic development and stabilization.
The main limitation of the LAD method is that it predicts on the basis of past values without incorporating external impetus. Credible results with minor accuracy measures could be obtained by increasing the number of observations. This could be done by including monthly data into the analysis or expanding the number of observed years.
In future research, the authors could get closer to actual values if using distinctive models (1) of the LAD method for every country and every variable which could better depict past movement and forecast future values.
Footnotes
Declaration of Conflicting Interests
The author(s) declared no potential conflicts of interest with respect to the research, authorship, and/or publication of this article.
Funding
The author(s) disclosed receipt of the following financial support for the research, authorship, and /or publication of this article: The publication of this paper was fully funded by University support for the project “Tax literacy in the Republic of Croatia and its impact on tax morality”. The research and authorship of this paper has been supported by Croatian Science Foundation under the project IP-2014-09-2625.
Appendix 1
Summary of accuracy measures for naïve model and LAD method for government expenditures in the selected countries (2015–2016).

| Forecast accuracy measures | |||||
|---|---|---|---|---|---|
| Country | Forecasting model | MAD | MSE | RMSE | MAPE |
| Portugal | Naïve |
|
|
|
|
| LAD | 3157.388 | 14060173.57 | 3749.69 | 14.80165 | |
| Ireland | Naïve | 1314.05 | 3401055.88 | 1844.195 | 6.769507 |
| LAD |
|
|
|
|
|
| Greece | Naïve | 4336.375 | 38949456.63 | 6240.95 | 18.41875 |
| LAD |
|
|
|
|
|
| Spain | Naïve | 22536 | 539805914.8 | 23233.72 | 19.16916 |
| LAD |
|
|
|
|
|
| Croatia | Naïve | 219.15 | 61377.98 | 247.7458 | 4.028519 |
| LAD |
|
|
|
|
|
Source: Authors’ calculation.
MAD: mean absolute deviation; MSE: mean squared error; RMSE: root mean squared error; MAPE: mean absolute percentage error; LAD: least absolute deviation.