
Abstract
Many existing studies have used hypothetical data to evaluate the performance of various metaheuristics in solving delivery route optimization. As empirical data impose characteristics of a particular problem, it is necessary to evaluate whether the problem characteristics may influence to the performance of metaheuristics. This article therefore attempts to compare the performance of metaheuristics, that is, genetic algorithm, ant colony optimization (ACO), particle swarm optimization, and simulated annealing (SA), to solve an empirical delivery problem in Yogyakarta, Indonesia. Two cases are developed to capture different characteristics of empirical data. The first case introduces delivery problem of one logistics operator and 58 retailers; the second case presents collaborative strategy in delivery problem, involving two logistics operators and 142 retailers. Results indicate that ACO and SA perform better with respect to less distance traveled for both cases and higher truck utility and lower number of routes for the second case.
Keywords
Introduction
Dantzig and Ramzer introduced vehicle routing problem (VRP) in 1959 to solve delivery problem from depots to customers by using vehicles with certain capacity. Many research have showed that VRP can be solved by using either exact methods or metaheuristics, each of which has its own benefits and drawbacks. Exact methods can produce global optimum solution but applicable for relatively small-scale problems. 1 Moreover, exact methods face difficulty in producing solution of complex problems in reasonable time. 2 Similar result was shown by Boole, 3 where branch and bound algorithm experienced problem in solving VRP with more than 25 nodes due to limited computation capability. Metaheuristics can accommodate large-scale problems, which cannot be handled by exact methods. 4 –6 On the other hand, metaheuristics are able to evaluate solution space thoroughly, which can be a help to step out of local optima and find global optima despite that the obtained solution is only an approximation toward global optimum.
While VRP is classified as nondeterministic polynomial time (NP)-hard optimization problem 2,7,8 with high complexity and wide solution space, exact method is no longer adequate to handle and hence metaheuristics are commonly chosen in practice. 4 Metaheuristics have been widely used to solve classical VRP 9 –14 and other VRP variants, for example, VRP with time windows, 15 two level vehicle routing with cross-docking, 16 green supply chain, 17 multi-depot VRP, 18,19 large-scale VRP with precedence constraints, 20 VRP with stochastic demand, 21 –23 VRP with split service, 24 VRP with simultaneous pickup delivery and time windows, 25 and two-dimensional loading VRP. 26
Many studies have evaluated the performance of various metaheuristics. Singhal et al. using meta-analysis has compared evolutionary algorithms, that is, ant colony optimization (ACO), particle swarm optimization (PSO), bee algorithm, and genetic algorithm (GA) in solving various problems including vehicle routing. 27 Kumbharana and Pandey also compared ACO, GA, and SA using hypothetical data taken from standard Traveling Salesman Problem Library (TSPLIB) instances. 28 Antosiewicz et al. used data from standard TSPLIB to compare GA, harmony search, PSO, quantum annealing, tabu search, greedy 2-opt heuristic, and optimal solution. 29 Results showed that SA and tabu search outperform others with respect to three criteria, that is, quality, uncertainty, and speed. Some of these previous studies also found that ACO is more suitable for combinatorial optimization problems or distributing computing, however, the selection of pheromone evaporation parameter should be carefully chosen as it may lead to local solution. On the other hand, GA in some cases can produce better solution and stable solution but worse performance on computation time. 17,29,30 The performance of SA was shown to have a trade-off between quality of solution and computation time 28,30 while PSO was found to have worse performance both in computation time and quality of solution for small and large instances. 29 These results indicate that there is no dominating approach for all cases. Each approach has its own advantages and disadvantages. This phenomenon is intensified when metaheuristic approaches are used for solving empirical problems, instead of hypothetical problems. For example, in city logistics, delivery routing problem will have its own characteristics depending on the condition of a particular city. Therefore, the results in one city might be different from other cities.
Some studies used empirical data in comparing metaheuristics especially in VRP. Fahimnia et al. used data from Australian clothing manufacturer to compare GA, SA, and cross-entropy. 17 D’souza et al. conducted empirical study for pickup and delivery problem to evaluate SA, GA, PSO, and artificial immune system. 31 As the number of research using empirical data to compare the performance of metaheuristics for solving logistic problem is still limited, this present article aims to compare the performance of GAs, PSO, ACO, and SA to solve a real delivery routing problem in Yogyakarta city, Indonesia.
Yogyakarta city is one of five districts in Special Region Province of Yogyakarta, located in south of Java island. This city has area of 32.5 km2, with population density of 12,322 people/km2, the most densely district among other four districts in the province. Population growth of Yogyakarta is around 1.04% per year for the last 5 years. The increasing population has hence caused escalation of demands. Therefore, the logistic activities in the city are also getting busier. The increasing of transport load within the city is about 10% per year for the last 5 years, whereas the growth of freight fleets inside the province is around 1% per year, 25.3% of which is located in Yogyakarta city. As more fleets operate in the city, many logistic problems arises, such as insufficient infrastructures, road congestion, pollution, and improper utilization of freight vehicles. One alternative solution to handle those problems is to establish urban distribution center (DC), 32 whereas optimizing freight routes of logistics operators is another alternative solution.
While each operator tries to optimize its delivery route, congestion issues cannot be resolved immediately. Currently, logistics operators in Yogyakarta still operate by using their own resources in fulfilling the demand. This has an impact on the number of fleets entering the city, resulting in increasing of transportation costs, low utilization of vehicles, and the aforementioned problems. Facing these problems, collaborative strategy has become another promising option. Several studies have mentioned the positive impact of the collaboration strategy on reducing transport costs and pollution disturbance. 33,34 Other studies 35,36 also mentioned the consolidation of transport and other resources, including information sharing became contributing factors to the achievement of the efficient logistics system.
Asih et al. has demonstrated that transport consolidation and warehouse sharing in Yogyakarta city has resulted less distance traveled and cost. 37 The study was carried out by using ACO metaheuristic to find the shortest path. Although the collaborative strategy appeared to be promising, the method to search for optimized routing has not been explored. Therefore, this article contributes to the evaluation of four metaheuristics, that is, GA, PSO, ACO, and SA to solve routing delivery problem in supporting the implementation collaborative strategy in Yogyakarta city.
The rest of the article is structured as the following. “Methodology” section describes the metaheuristics and mathematical formulation, followed by a description of the two case studies used in this article in “Case study” section. Results and discussion for both cases are presented in “Results and discussion” section. The last section concludes the findings.
Methodology
Metaheuristics
Metaheuristics have been commonly used to solve complex optimization problems due to its ability to deal with NP-hard problems. Development of heuristic concept have been established since 1945 by Polya followed by G Dantzig in 1947 by introducing local search algorithm for linear programming problems, known as simplex algorithm. 38 During its development, metaheuristic approaches categorized as population-based metaheuristics have emerged to find the finest solution through iterative process of generating new population through natural selection. According to Binitha and Sathya, 39 evolutionary algorithms and swarm-based algorithms are the two most leading approaches in population-based metaheuristics. GA is an example of evolutionary algorithms, while ACO and PSO are two approaches grouped in the swarm-based algorithms. Those three approaches are commonly used to solve traveling salesman problem as well as classical VRP. 13,14,39 Other category in metaheuristics is single-solution-based metaheuristics, which is based on a process of improving single solution. SA becomes an approach in this category commonly used in solving VRP. Both categories, that is, population-based metaheuristics and single-solution-based metaheuristics, perform differently in obtaining the best solution. Population-based metaheuristics do more on exploration of search space, hence, they allow diversification over the whole region. On the other hand, single-solution-based metaheuristics have the ability to exploit the local space by generating candidate solutions from a set of solution space and then go through a replacement procedure to decide whether a candidate solution can replace the existing solution or not. In order to evaluate both categories, this research used four approaches, that is, GA, ACO, and PSO to represent population-based metaheuristics and SA to represent single-solution-based metaheuristics. A brief description of each approach is discussed in the following.
Genetic algorithm
GA was developed in Michigan, USA, by JH Holland in 1960s 40,41 and categorized as one of evolutionary algorithms. This type of algorithm is based on evolution of genetics through natural selection. GA involves three main procedures, namely, selection, crossover, and mutation. This approach is initiated by generating population of solutions. Solutions with better fitness are selected and allowed to become parents. Two parents can generate one or two offspring through a mating process, known as crossover. Each generated offspring is then perturbed through a mutation process. Mutation is a process of modification to the new population, hence, allows diversification of population characteristics. While better solutions has larger probability to be chosen for crossover and the mutation process will still carry the parent’s features, the new generations are expected to give better results than the parents. This iteration is repeated through generations to find the best solution.
Some terminologies used in GA, such as chromosome, fitness, elitism, selection, crossover, and mutation can be found in many references. 28,38 There are three parameters used in GA, that is, population size (pop_size), crossover rate (cr), and mutation rate (mr). Details on GA procedures can be found in other literatures. 6,16,17,19,28
Ant colony optimization
Marco Dorigo introduced ACO algorithm in 1992. 42 This algorithm is a kind of swarm intelligence optimization algorithms, which is inspired by the ants’ behavior in selecting the shortest path of finding food. When the ants locate foods, each ant will try to find the shortest path and leaves chemical trail, known as pheromone, on the ground along the path, so that other ants can follow the track. If there are more ants passing a certain path, the larger the amount of pheromone left in that path. Consequently, the probability of the other ants select the path increases. On the contrary, if there are less ants passing the path, pheromone evaporates as time goes by which can cause less probability of ants selecting this path.
ACO is initiated with random movements of ants in searching the solution path. In every iteration, each ant builds solution based on certain procedures. Each ant will move from node i to the next node j based on certain probability. 10,43 After all ants complete their moves, the amount of pheromone will be updated by the influence of pheromone evaporation rate. Detail procedures of ACO algorithms can be found in many literatures. 10,28,38 Three parameters in this approach are α, β, and ρ, where the first two are parameters of relative influence of the pheromone values and heuristic values, and the third represents the pheromone evaporation rate.
Particle swarm optimization
PSO is a population-based metaheuristic approach
38
introduced by Kennedy and Eberhart in 1995.
44
This approach is inspired by behavior of schooling of organisms, such as birds and fish to search a place with enough food. Like ACO, this behavior is also known as swarm intelligence. In PSO, each particle in a population has their own position and speed. They share their best position to other particles, and therefore there will be adjustment of their position and speed based on the sharing information. Optimization process is conducted through particle adjustment based on their best individual position (P
best) and global best position (G
best). If Xi(t) and Vi(t) represent the position of particle


where
Xi
= position of particle i
Vi
= speed of particle i
i = particle index
t = iteration index
N = N-dimensional search space
P
best_i
= local best of particle i
Gbest = global best
c
1, c
2 = learning factor
r
1, r
2 = random value
Simulated annealing
SA introduced by Kirkpatrick et al. is a metaheuristic approach based on annealing process of solids. 45 The annealing process is carried out by heating a material followed by slow cooling procedure to obtain strong crystalline structure. In optimization, feasible solution corresponds to the system and objective function is presented by energy state of the system. Thus, the optimum solution corresponds to the minimum energy state. SA has the ability to step out of local optima which consequently delays the convergence. 38 This approach is also memoryless algorithm, as it does not use the information gathered during the searching process. 38,46
SA is initiated by generating random neighbor in each iteration. If the neighbor solution gives improvement in objective function, then this solution is accepted. Otherwise, it will go through metropolis criteria to decide whether the solution will be accepted or not. This criteria uses acceptance probability based on Boltzman distribution, which depends on the current temperature (T 0) and the amount of energy degradation (▵E) of objective value (see equation (3))
where
P(E) = acceptance probability
▵E = energy degradation
T = current temperature
K = Boltzman constant
In order to use metropolis criteria, a random value (r) between 0 and 1 is generated. If P(E) > r, the solution is accepted, otherwise it is rejected. In SA, trials are conducted at a particular temperature until an equilibrium state is achieved. After that, the temperature is gradually decreased and the process is repeated again. In the cooling process, the solutions will be narrowed in improving the movement. The solution when the system has cooled represents the solution close to or at the global optimum. Detailed procedures of SA can be found in literatures. 17,28,38,46 Initial temperature (T), cooling rate (clr), and number of cycle before temperature reduction (cls) are three parameters in this approach.
Mathematical formulation
Capacitated VRP was used in evaluating optimum delivery route. Mathematical formulation of this delivery problem is presented in equations (4)
to (9). Decision variables are the decision whether a route is passed by a truck for deliveries or not (


where
i, j = nodes (chain stores and DC) index
k = vehicle index
K = number of vehicle
N = total number of chain stores
dj
= demand of chain store j
Q = vehicle capacity
cijk
= distance of node i to node j using vehicle k
Case study
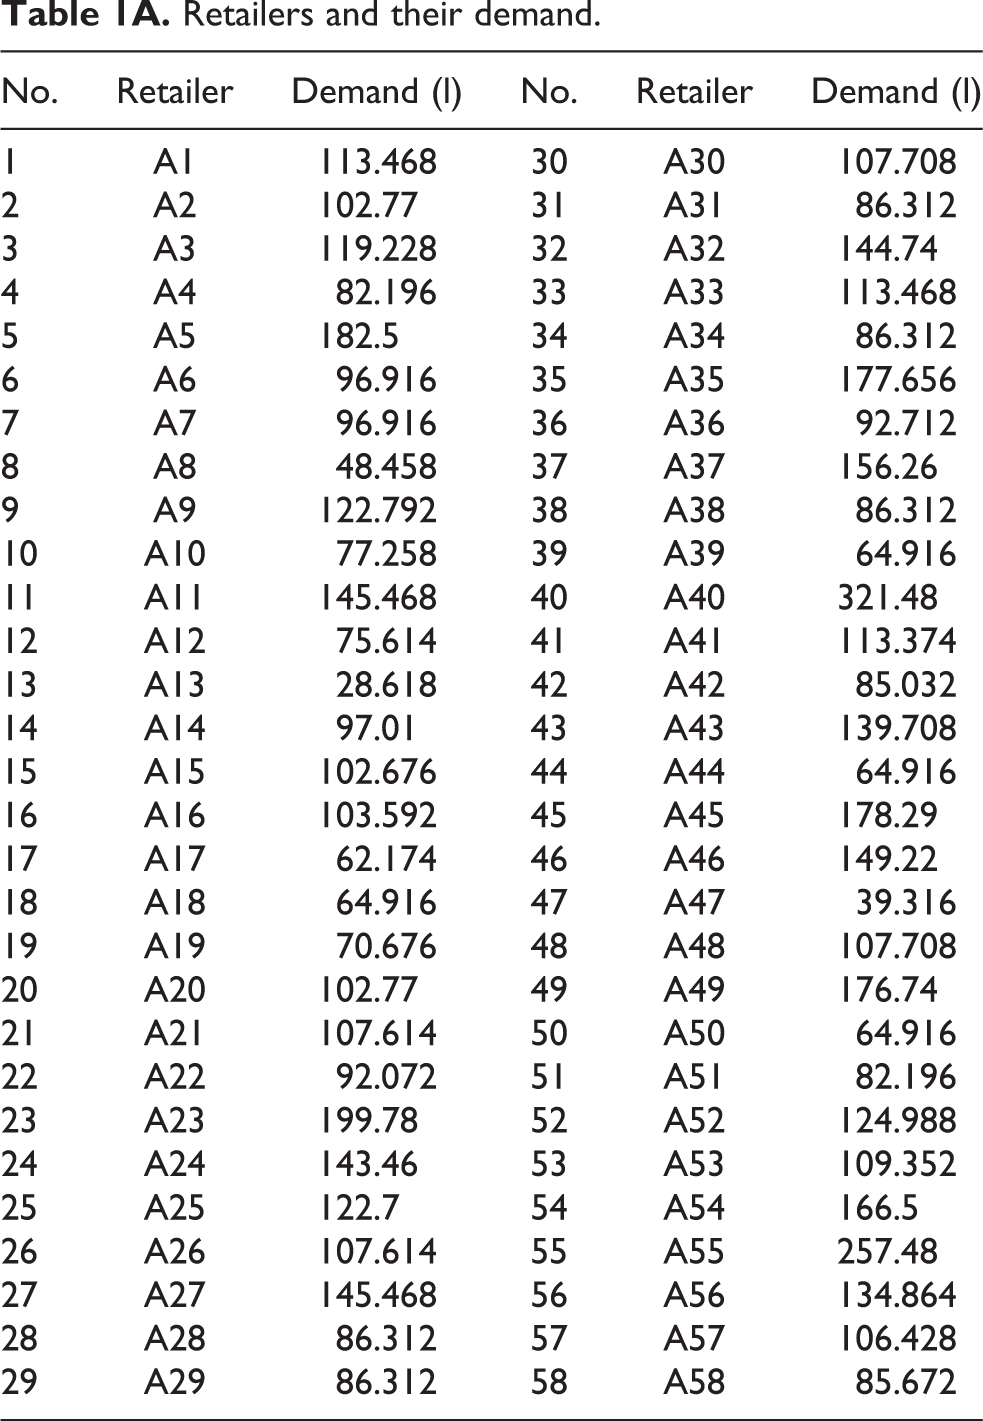
Two cases are developed to introduce different characteristics of the delivery routing problem in Yogyakarta. The first case consists of small instances of one logistics operator with 58 retailers. The second case uses two logistics operators with total retailers of 142. Those four metaheuristic approaches will be used to evaluate the optimal routing with respect to distance traveled, number of routes, and truck utility. Detail of each case is as follows: 1. Case 1: Fifty-eight retailers which are scattered in the city and a DC of a logistics operator located in the east outer part of the city. Those retailers and DC were located based on their actual coordinates (Figure 1). Distance matrix was derived from these coordinates, later being used for optimization parameters. Each chain store has its own demand of three main commodities, that is, rice, sugar, and cooking oil, which are measured in liters (see Appendix 1, Table 1A). The demand is assumed to be deterministic. Other assumptions used in developing the model are that the number of delivery vehicles is not limited, no product deteriorates along the chain, effect of congestion is not yet considered, and only one vehicle type applied with capacity of 456 l. Location of DC and chain stores of case 1. DC: distribution center.

For the first case, five scenarios of 10, 20, 30, 40, and 50 randomly selected chain stores are developed to compare the metaheuristics. The result and analysis are conducted in two parts based on different stopping criteria. The first stopping criteria is based on the number of iterations, which is 1000 iterations, while the second stopping criteria is convergence, that is, distance traveled differences are under tolerance (i.e. 0.0001). Each part evaluates the optimum solution obtained by each approach in terms of quality of optimum solution, that is, average optimal (minimum) distance traveled and average computation time for each variation of the number of nodes with five replications each.
Metaheuristic approaches were implemented in Matlab. Specification of computer used to run the program was processor Intel i5, 5th generation, and 8 GB RAM.
Parameters’ values used for each metaheuristics were determined using three-level full factorial design of experiment, that is, low, medium, and high. For example, if an approach has two parameters, namely, parameter 1 and parameter 2, each parameter will have three values of low, medium, and high. Thus, six values will be assigned in total. These six values are then used to run the capacitated vehicle routing problem (CVRP) formulation, resulting in 23 combinations of parameters’ values and hence eight objective values. Likewise, if there are three parameters’ values in an approach, there will be 33 combinations, resulting in 27 objective values, and so on. These objective values are then analyzed using regression analysis in order to find the optimum values (in this case minimum distance traveled). List of parameters’ values are presented in Table 1.
Three-level full factorial design of metaheuristic parameters and the selected optimum values.

GA: genetic algorithm; ACO: ant colony optimization; PSO: particle swarm optimization; SA: simulated annealing.
2. Case 2: Two logistics operators consists of one operator located at the east outer part of the city with 58 retailers and another operator located at the west outer part of the city with 84 retailers. Type of product, assumptions, and vehicle capacity are the same as those of case 1. The geographical map for those two operators was taken from Asih et al. and shown in Figure 2. 37 The four approaches were used to evaluate three scenarios:

Location of DCs and chain stores of case 2. DC: distribution center.
Scenario 1: without collaborative strategy: existing condition (both companies do not share their resources, that is, fleets and DCs)
Scenario 2: with collaborative strategy—constrained capacity of DCs: both companies share the fleets and DCs by not allowing expansion of the last.
Scenario 3: with collaborative strategy—unconstrained capacity of DCs: both companies share the fleets and DCs by allowing expansion of the last.
Scenarios with collaborative strategy has clustering process to assign retailers to closer DC prior to distance optimization for each cluster (Asih et al., 2016).
Results and discussion
Case 1: One logistics operator with 58 retailers
Figure 3 shows the comparison behavior of four metaheuristic approaches using stopping criteria of 1000 iterations for various number of nodes, that is, 10, 20, 30, 40 and 50. From all sub-figures, SA present different distance traveled behavior compared to others. The other approaches, that is, GA, PSO, and ACO, produce similar smooth curves, while SA shows random results that intensely occur in small number of nodes. This randomness mostly occurs before 600 iterations, in which SA starts to converge. The randomness could be resulted due to generation of random neighbor in each iteration of SA process. Moreover, there is no elitism process in SA, that is, no mechanism of keeping the best result from previous iteration, like GA. According to the metropolis criteria (i.e. acceptance probability based on Boltzman distribution) used in SA, the probability of accepting the worse move is larger at high temperatures and becoming lesser at low temperatures. 38

Behavior of distance traveled for all approaches: (a) 10 nodes, (b) 20 nodes, (c) 30 nodes, (d) 40 nodes, and (e) 50 nodes.
In terms of quality, SA produces the shortest distance traveled at 10 nodes, compared to other approaches. At higher number of nodes, however, this approach appears to fail giving better results among others as the distance traveled attained at the end of 1000 iterations is more than 15% larger compared to others. However, looking at the distance traveled achieved after 600 iterations, it looks like that SA has not yet reach the convergence, as the distance traveled continues to decrease. It indicates that SA might need higher iterations to converge.
The average optimum distance traveled obtained by all approaches is presented in Table 2 and summarized in Figure 4(a). At low number of nodes, that is, 10 and 20, the optimum distances are similar for all approaches with differences of less than 3%. From 30 nodes and higher, SA starts to show larger optimum distance, with differences of 8% at 30 nodes, and reaches 28% at 50 nodes, which are statistically significant with (F = 3.25, df = 3, p value = 0.049) and (F = 98.11, df = 3, p < 0.001), respectively. Table 2 and Figure 4(b) also present comparison of average computation time required to finish 1000 iterations. Statistically, the difference of computation time among these approaches is significant with (F = 6742.6, df = 3, p < 0.001). This figure shows that GA has the longest time for all variation of nodes, followed by ACO, PSO, and SA as the fastest one. While the optimum distance traveled is similar for the first three approaches, this result reveals that computation time of GA is not as good as others. On the other hand, SA has the shortest computation time but the optimum distance traveled obtained is relatively worse among others, except for 10 nodes, as shown in Figure 4(a) and in the previous section (Figure 3). These outcomes indicate that short computation time for a certain limited iterations does not guarantee best result. It is also explained in the previous section that after 600 iterations, the distance traveled of SA is still decreasing. It indicates possibility of this approach to have lower distance traveled in higher iterations. Therefore, it is necessary to check whether the approaches having short computation time can show indeed better results for number of iterations larger than 1000. The next part attempts to proof the hypothesis by evaluating the performance of the approaches based on their convergence.
Optimum distance traveled and computation time using stopping criteria of 1000 iterations.

GA: genetic algorithm; ACO: ant colony optimization; PSO: particle swarm optimization; SA: simulated annealing.

Results comparison of GA, ACO, PSO, and SA with stopping criteria of 1000 iterations: (a) optimum distance and (b) computation time. GA: genetic algorithm; ACO: ant colony optimization; PSO: particle swarm optimization; SA: simulated annealing.
By using criteria of convergence, all four approaches have similar average minimum distance traveled for 10 and 20 nodes (Figure 5(a)) to those using stopping criteria of 1000 iterations. The differences are quite obvious at 30, 40, and 50 nodes. Results from previous part have shown that at 1000 iterations, GA can mostly produce lower distance traveled compared to others. However, when the convergence criteria is used, the average minimum distance traveled produced by GA is not the least among others and it happens almost in all variations of number of nodes. It has even the highest distance traveled at 30 nodes, and not as good as SA and ACO for 40 and 50 nodes. Detail of the number is provided in Table 3.
Optimum distance traveled and computation time using stopping criteria of convergence.

GA: genetic algorithm; ACO: ant colony optimization; PSO: particle swarm optimization; SA: simulated annealing.

Results comparison of GA, ACO, PSO, and SA with stopping criteria of convergence: (a) optimum distance and (b) computation time. GA: genetic algorithm; ACO: ant colony optimization; PSO: particle swarm optimization; SA: simulated annealing.

Collaborative strategy versus non-collaborative strategy: comparison of truck utility.
Figure 5(a) also shows that PSO and ACO are in the middle rank, with the highest distance traveled at 40 nodes is resulted by ACO and at 50 nodes is yielded by PSO. On the other hand, SA which has larger average minimum distance traveled at 1000 iterations for almost all variation of nodes shows improvement with the shortest distance traveled at 30 and 40 nodes, while at 50 nodes, it is on the second rank. The result confirms that SA indeed has not reach convergence yet at 1000 iterations. ACO that performed quite well at 1000 iterations also exhibit promising performance when convergence stopping criteria is used, especially for number of nodes of 50 where it has the lowest average minimum distance traveled.
The lack of performance obtained by GA, PSO, and ACO might be caused by early convergence experienced during the process of finding optimum value. These algorithms tend to converge to a point, which is not supposed to be there in the first place. This phenomena might be due to lack of population diversity and known as premature convergence, which could happened in evolutionary algorithms, such as GA 47 and swarm intelligence-based methods. 38 In GA, if the selective pressure, that is, selecting the best member of the current generation, is relatively high, population diversity decreases, leading to suboptimal solution. 48 It also occurs in PSO, when the information flows among individuals moves very quickly, the diversity decreases and the process is trapped in local optima. 49 On the other hand, ACO seems better in tackling the premature convergence due to the role of pheromone evaporation, which represents the function of forgetting and allowing exploration of other areas in the search space. 50 Therefore, the value of the evaporation rate plays an important role in causing the premature convergence and hence must be carefully chosen. While population based methods such as evolutionary algorithms and swarm intelligence-based methods have to face premature convergence, SA is one of the approaches that has the ability to step out of local optima but consequently having delay toward the convergence.
In Figure 5(b) and Table 3, GA becomes the method that requires longest computation time compared to others, followed by ACO and PSO. SA, in fact, still has the shortest computation time, the same achievement as the result with stopping criteria of 1000 iterations, which is under 10 s for all variation of number of nodes. However, the computation time needed by SA looks significantly escalating for larger number of nodes. When the problem complexity increases, more retailers will be served for delivery. Consequently, the computation time required by SA might increase. In SA, computation time depends significantly on the cooling schedule. There is a trade-off between the quality of solutions and the speed of cooling schedule. If the speed of cooling schedule is slow, that is, small reduction of temperature, the computation time required to obtain better solution will increase. 28,38
Overall, for small instances (up to 20 nodes) of the current empirical problem, SA is preferable as it gives better quality of solutions and computation time. For large instances (30 nodes to 50 nodes), SA or ACO is likely to give minimum distance traveled and less computation time. Thus, in evaluating route selection in Yogyakarta city, SA and ACO can potentially provide better solutions, especially for 10 to 50 nodes. However, for number of nodes higher than 50, computation time of SA may escalate, which is not explored further in the article.
Case 2: Two logistics operators with total of 142 retailers
When the concept of collaborative delivery is applied to Yogyakarta city, the performance of the four metaheuristics was evaluated with respect to distance traveled, truck utility, and number of routes in fulfilling monthly demand.
The results show that the implementation of collaborative strategy produces lower distance traveled for all approaches (Table 4) compared to non-collaborative strategy. Significant reductions of distance traveled are obtained by SA for both scenarios when the capacity of DCs is constrained and not constrained, which are 32% and 40% respectively, followed by ACO with similar number. This result is consistent with the results in case 1, and therefore both approaches present better performance in both small and large instances than the other two approaches.
Collaborative strategy versus non-collaborative strategy: Comparison of distance traveled.

GA: genetic algorithm; ACO: ant colony optimization; PSO: particle swarm optimization; SA: simulated annealing; DC: distribution center.
*Compared to non-collaborative strategy.
Results of truck utility (Table 5 and Figure 6) and number of routes (Table 6) reveal that ACO provides the highest truck utility compared to others, with utility levels above 90% for all scenarios and narrower ranges. SA has a slightly lower performance with truck utility of near 90%. The number of routes achieved by ACO is also the lowest compared to other approaches (Table 6). When the number of routes is lower, the truck will carry more goods, and hence increases the truck utility. From those results, ACO and SA are outperform compared to PSO and GA in evaluating routing problem in Yogyakarta city. These findings in fact slightly differ with the results obtained by Khumbarana and Pandey 28 and also Sandhya and Katiyar, 30 when hypothetical data were used to compare the metaheuristics. One similar result between their findings and this study is the performance of ACO in producing high-quality results especially for small instances. The difference lies on the performance of GA that showed better solutions when large instances of hypothetical data are used. However, the empirical study of Yogyakarta reveals that GA does not give better results with respect to almost all indicators used, that is, distance traveled, computation time, number of routes, and truck utility, compared to the results of ACO and even SA.
Collaborative strategy versus non-collaborative strategy: Comparison of truck utility.

GA: genetic algorithm; ACO: ant colony optimization; PSO: particle swarm optimization; SA: simulated annealing; DC: distribution center.
*(min, max).
Collaborative strategy versus non-collaborative strategy: Comparison of number of routes.

GA: genetic algorithm; ACO: ant colony optimization; PSO: particle swarm optimization; SA: simulated annealing; DC: distribution center.
Results show that collaborative strategy provides lower truck utility, of about 1–4%, compared to that of non-collaborative strategy. This also applies to the number of routes traveled by distribution vehicles (Table 6), with an increase in the number of routes of collaborative strategy by maximum of 4%. It indicates that there exists a trade-off between distance traveled and both truck utility and number of routes. This can be explained that under conditions without collaborative strategy, each DC must serve all its retailers, including those located far from the DC itself. With a DC located at the west of the city and one at the east, the implementation of collaborative strategy causes retailers located away from the original DC to be covered by a closer DC.
Figure 7 indicates for both collaborative strategy with constrained DC capacity and unconstrained DC capacity, the retailers are served by nearby DCs. This leads to the lesser routes in scenario without collaborative strategy than that with collaborative strategy. Given the number of demands, lesser routes imply more retailers to be visited for each route and hence resulting in higher distance traveled. When there is more retailers visited in each route, the truck loads more goods, resulting in higher truck utility.
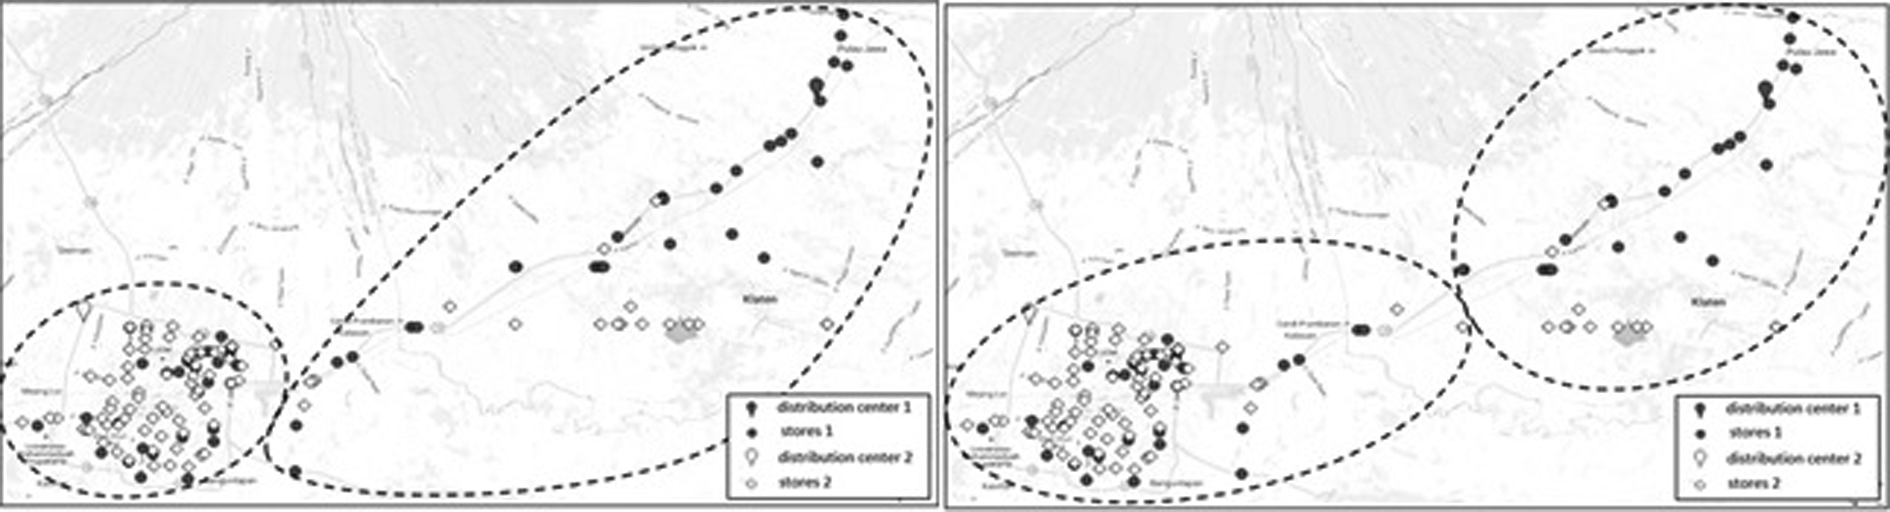
Areas served by each DC: (a) constrained DC capacity and (b) unconstrained DC capacity. DC: distribution center.
Figure 7 also presents that when the capacity of a DC is limited, the area served was also limited. In Figure 7(a), DC 2, which is located at the west of the city, only serves retailers within the city of Yogyakarta due to its limited capacity. In Figure 7(b), the area served by the DC 2 is wider in the east due to the possibility capacity expansion of DC 2 of 3400 m2. Therefore, although the expansion scenario of DC’s produces a decrease in distance traveled more than the constrained DC capacity scenario, and hence lower transportation cost, the trade-off with the investment in expanding the DC capacity should be taken into consideration in the logistics decisions.
Conclusion
The article compares four metaheuristic approaches, that is, GAs, ACO, PSO, and SA using an empirical delivery data set of Yogyakarta city. Two cases were developed to capture the different characteristics of the empirical data. The first case of one operator and 58 retailers shows that SA and ACO perform better in terms of distance traveled and computation time. Similar results are also observed for collaborative strategy case.
It is noteworthy that the behavior of premature convergence should be put into consideration in applying population-based algorithms, that is, GAs, PSO, and ACO. The behavior of premature convergence is depending on the parameters’ values which may lead to local optimum. On the other hand, delay of convergence may occur in single-solution-based algorithms such as SA. Therefore, the selection of stopping criteria needs to be carefully examined to ensure the chance of getting a better solution.
The findings of the empirical study in Yogyakarta city reveal a slightly different performance of metaheuristics compared to the results from hypothetical studies. Despite the good quality obtained by ACO, the performance of GA and SA shows different results. In hypothetical data, GA is outperform compared to other approaches, but in this empirical study, GA performs less than ACO and even SA. Given this results, the evaluation of metaheuristics performance for empirical studies of delivery routing problems is still open for further exploration in future studies.
Footnotes
Acknowledgement
The authors gratefully acknowledge financial support provided by Higher Education Directorate (DIKTI) Indonesia.
Declaration of Conflicting Interests
The author(s) declared no potential conflicts of interest with respect to the research, authorship, and/or publication of this article.
Funding
The author(s) disclosed receipt of the following financial support for the research, authorship, and/or publication of this article: This work was financially supported by the Higher Education Directorate (DIKTI) Indonesia under the research grant of Master Pengembangan dan Percepatan Pertumbuhan Ekonomi Indonesia (MP3EI) 2017.
Appendix 1
Retailers and their demand.
| No. | Retailer | Demand (l) | No. | Retailer | Demand (l) |
|---|---|---|---|---|---|
| 1 | A1 | 113.468 | 30 | A30 | 107.708 |
| 2 | A2 | 102.77 | 31 | A31 | 86.312 |
| 3 | A3 | 119.228 | 32 | A32 | 144.74 |
| 4 | A4 | 82.196 | 33 | A33 | 113.468 |
| 5 | A5 | 182.5 | 34 | A34 | 86.312 |
| 6 | A6 | 96.916 | 35 | A35 | 177.656 |
| 7 | A7 | 96.916 | 36 | A36 | 92.712 |
| 8 | A8 | 48.458 | 37 | A37 | 156.26 |
| 9 | A9 | 122.792 | 38 | A38 | 86.312 |
| 10 | A10 | 77.258 | 39 | A39 | 64.916 |
| 11 | A11 | 145.468 | 40 | A40 | 321.48 |
| 12 | A12 | 75.614 | 41 | A41 | 113.374 |
| 13 | A13 | 28.618 | 42 | A42 | 85.032 |
| 14 | A14 | 97.01 | 43 | A43 | 139.708 |
| 15 | A15 | 102.676 | 44 | A44 | 64.916 |
| 16 | A16 | 103.592 | 45 | A45 | 178.29 |
| 17 | A17 | 62.174 | 46 | A46 | 149.22 |
| 18 | A18 | 64.916 | 47 | A47 | 39.316 |
| 19 | A19 | 70.676 | 48 | A48 | 107.708 |
| 20 | A20 | 102.77 | 49 | A49 | 176.74 |
| 21 | A21 | 107.614 | 50 | A50 | 64.916 |
| 22 | A22 | 92.072 | 51 | A51 | 82.196 |
| 23 | A23 | 199.78 | 52 | A52 | 124.988 |
| 24 | A24 | 143.46 | 53 | A53 | 109.352 |
| 25 | A25 | 122.7 | 54 | A54 | 166.5 |
| 26 | A26 | 107.614 | 55 | A55 | 257.48 |
| 27 | A27 | 145.468 | 56 | A56 | 134.864 |
| 28 | A28 | 86.312 | 57 | A57 | 106.428 |
| 29 | A29 | 86.312 | 58 | A58 | 85.672 |