
Abstract
The relationship between product development process and product success remains to confound many. Although most researchers agree that product development is one of the main factors affecting product success, many case studies performed since 1980s have shown different results. Some studies find a strong relationship between a product development activity and the product success, while some others discover the opposite. There is no generic result to be referred to further study or used for practices. Therefore, this study explores further the effect of product development activities on product success by conducting a multiple triangulation approach. This approach cross-examines three methods with three different data: meta-analyses that use data from a number of case studies previously published; analytic hierarchy process that takes data from product development experts’ judgment; and resource allocation analysis that utilizes companies’ operational data. The results show that the relationship between product development process and product success is unique for every case or group of cases. The relationship can be determined by utilizing resource allocation data and experts’ judgment, as shown by a general procedure proposed.
Introduction
Background
Product development is the first stage in the process of making products, comprising of creating the products’ idea, developing the design of the products, as well as designing the consecutive processes of making the products real and beneficial. Thus, the product development will drive product success, as proven by many case studies. 1 –13
Researches on product development began in 1960s and started to significantly increase in 1980s, since the most cited article on product development and industrial success written by Cooper 14 was published. Some of those researches specifically discuss the effect of product development process on success through case studies. 1,3,4,7 –10,15 However, although the case studies basically refer to the same model, that is, a model of product development activities developed by Cooper and Kleinschmidt, 1 the results are varied and are contradictive, as described in the following illustration.
The case studies mentioned above 1,3,4,7 –10,15 identify the relationship between quality or performance level of every activity in product development process and the product/industrial success or failure. Table 1 compares the results of the studies. The reference number in the first column refers to the references list. The activities presented by numerical code are defined according to Cooper and Kleinschmidt, 1 as it is the most cited article, and the other articles are fully or partially referred to it. The activities are (1) initial screening, (2) preliminary market assessment, (3) preliminary technical assessment, (4) detailed market study/research, (5) business/financial analysis, (6) product development, (7) in-house process testing, (8) customers test of product, (9) test market/trial sell, (10) trial production, (11) pre-commercialization business analysis, (12) production start-up, and (13) market launch. Notation Y means that an activity influences success, F means that an activity may or may not influence success, and N means that an activity could not be proven to influence success.
Findings about the influence of product development activities on success.

ANOVA: analysis of variance.
As shown in Table 1, Cooper and Kleinschmidt 1,3 and Cooper 15 show that the different observation object groups will give different conclusions. In manufacturing industries, 1,15 market-related activities could not be proven to affect success, while in chemical industries, 3 the activities not proven to affect success are technical activities.
In other part of Table 1, the studies conducted by Mishra et al. 4 and Jin and Li 7 present the same conclusions, as they observed similar objects, that is, industry mix, including services, that are mostly located in Asia. In another part, Millson and Wilemon 8 who observe industry mix including services in US region show different results. However, the similar object groups may also give different results, such as Cooper 15 and Millson and Wilemon. 8 They both observe manufacturing and service industries in the same region, United States, but the results are different.
In the last part of Table 1, Wang et al. 9 and Khurum et al. 10 give different findings in details, as they observed different objects: manufacturers 9 and IT companies. 10 However, they show similar characteristic as the recent studies, that is, that the most important is about market and customer.
Problem and research benefit
There is no general conclusion could be taken from the aforementioned comparison. The way the product development drives product success remains uncharted. Those who need an information about the most influencing product development activity on success for a further study, for example, will stumble on choosing which results of the studies could be referred to. For practices, it is important to know which activities of product development will drive the success of the product, because the product development cost is high 15 and should be effectively allocated. Thus, a deeper analysis on the role of product development activities on success is required to generate a beneficial result.
Research questions
The findings from the comparison through some examples shown in Table 1 lead to an indication that every case may have its own characteristic of the relationship between product development process and success. If this indication is right, it is important to know how to determine the relationship for every case. Hence, these indications lead to the following questions: Q1: Is the role of the product development activity on the product success specific for every case? Q2: How does a general procedure to determine which activities of product development affect the product success?
To answer the questions, a cross-examination on three data sources and methods is performed in this study. The symptom, the behavior, as well as the pattern are elaborated. The approach applied to find the answers is a triangulation.
The following discussion begins with the triangulation approach and the context of the research. The next part is the data collection, the analyses, and the findings of the three methods consecutively. A cross-evaluation on the three methods is performed, followed by the discussion of the result, and closed by the conclusion section.
Triangulation approach
The lexical definition of triangulation is the division of a map or plan into triangles for measurement purposes, or the calculation of positions and distances using this method, working from a fixed base. 16 In the context of research, triangulation means the use of two or more approaches in research aspects to strengthen the research finding. Triangulation could decrease the weaknesses of a single approach and contribute to understanding further the phenomenon. 17 Theoretical perspectives, 18 methodological approaches, 18,19 data sources, 20 investigators, 18 or data analysis methods 21 are some aspects usually triangulated.
Regarding the questions Q1 and Q2 that could not be answered by previous studies, 1,3,4,7 –10,15 this study analyzes three different data types from three different sources using three different approaches. The three data are as follows: (1) the results from a number of published researches which are analyzed by meta-analyses; (2) experts’ judgment taken from experienced product development practitioners and analyzed using analytic hierarchy process (AHP); and (3) product development operational data taken from some product development projects in three companies and evaluated through resource allocation analysis using activity base costing (ABC) approach. Thus, this is a triangulation across recognized data, subjective data, and objective data.
Context
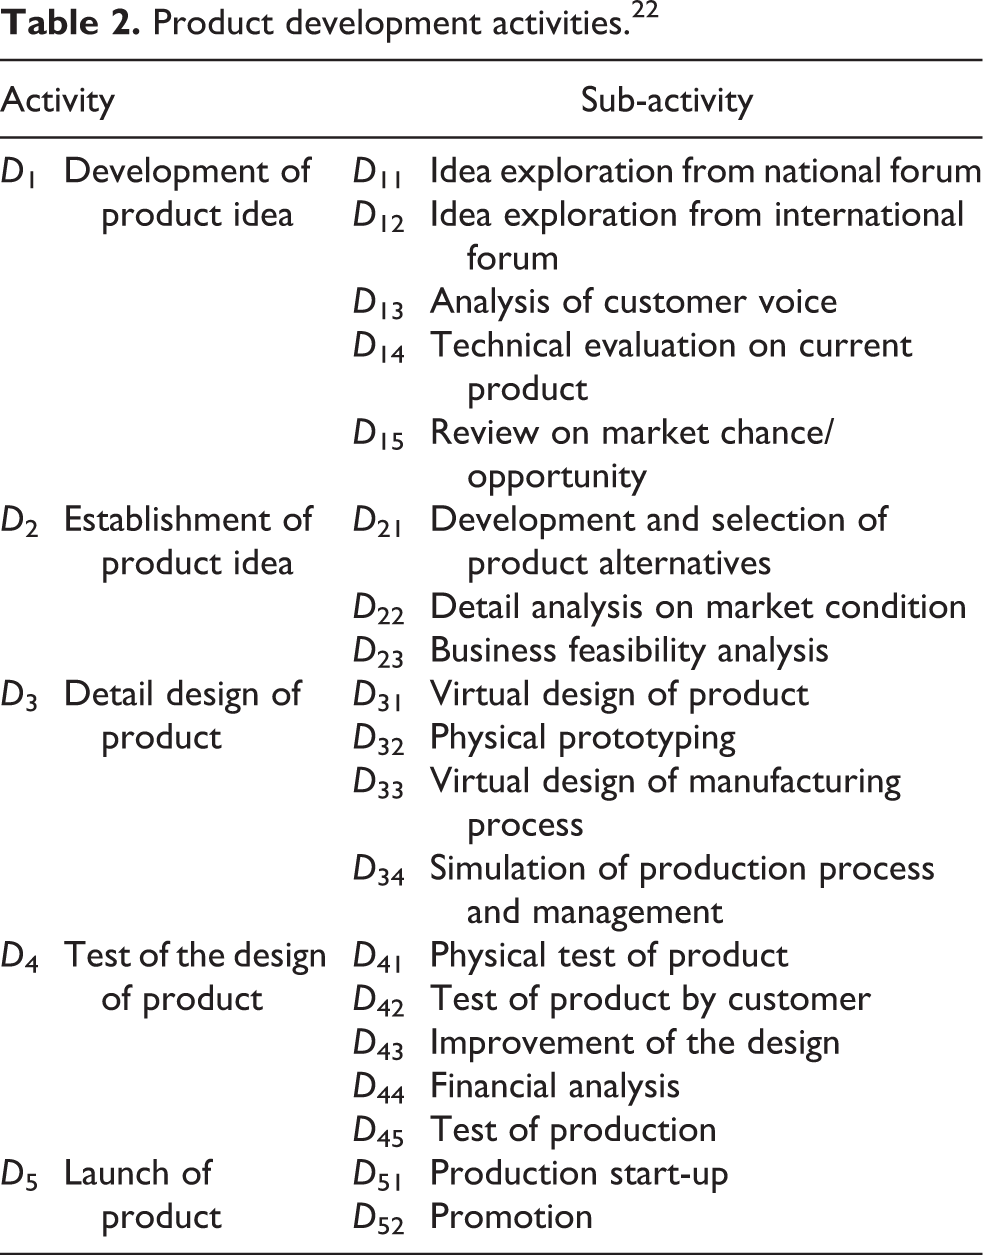
The concern of this study is about the role of product development activities on product success. Thus, the discussion in this article is focused on and limited to the relationship between product success and product development process or activities. The model of product development process analyzed here refers to a model developed in the previous work, 22 in which the model is developed based on other established models 1,15,23 –26 and observations in some companies. Table 2 presents this model.
Product development activities. 22
Meta-analyses
The mechanism of meta-analysis
Meta-analysis is a technique to comprehensively analyze the relationship between two variables by statistically wrapping up the values resulted from an adequate number of studies/cases. 27 It is usually utilized as a tool for a systematic literature review. Meta-analysis tries to diminish the effect of the artifacts of the findings from a number of cases, in order to acquire a general and reasonable measure of relationship. 27,28 The artifacts include, for instance, sampling error, measurement error, computational error, or typographical errors. The meta-analysis recognizes at least sampling error and measurement error.
A meta-analysis is performed through the following steps: 27 (1) collecting the data from an adequate number of samples and cases; (2) calculating the weighted average of the data; (3) correcting the average by sampling errors; (4) correcting the average by measurement errors; and (5) determining the level of significance. In case the expected level of significance has not been reached, the process goes back to step 1. A case defined in step 1 means a study in which a datum can be taken. Thus, a research article may contain more than one case. Every case generates the datum based on a number of samples.
The meta-analysis commonly performed is a correlation meta-analysis, which is applied in this study. A series of meta-analyses are performed to find the correlation between every product development activity defined in Table 2 and product success.
The concern of the meta-analyses conducted here is to answer the research question Q1, addressing the confusing phenomena shown in Table 1. The indication shown by the phenomena is that the role of product development activity on success may be influenced by industry type (as the representation of the product type); or geographical area (as the representation of the customer type); or time (as the representation of the trend). This indication will figure out by hypotheses testing. Supposed that Di
is activity i, Dij
is sub-activity j of activity i (see Table 2) and S is product success, the hypotheses to be tested are
The data for meta-analyses
The data for meta-analyses came from a number of articles 1 –9,11 –14,21,29 –97 acquired through a systematic review that considers some criteria, that is, the required content, the year of publication, the publication sources, and the citation number. The followings are the explanation of the review criteria.
The content
The articles acquired for the meta-analyses must contain quantitative information about the relationship between at least one Dij and S, in the form of correlation values, F-statistic values, t-statistic values, R 2 values, or other effect sizes. All the values other than correlation will be converted into correlation. 27,98
The year of publication
The range of publication of the articles involved in meta-analyses is from 1980s, the publication time of the most cited article on product development activities, 1 until 2015. This long range of publication year will support the analysis of time variation. Around 75% of the collected articles are published after year 2000.
The publication sources
The articles involved in meta-analyses are firstly taken from the Science Direct, in which reputable science, engineering, and business articles are available. Once a high cited and qualified article found, the other relevant articles are searched from the related articles in the reference list and the citation data.
The number of citation
The average number of citation of the articles involved in theses meta-analyses are 714, 255, 121, and 23 for the articles published during 1979–1990, 1991–2000, 2001–2010, and 2011–2015, respectively. Around 95% of the articles are cited publication. The other 5% noncited publication are dissertation and the last three year articles.
The finding from meta-analyses
Tables 3 to 6 show the results of the meta-analyses. K is the number of cases involved in the analysis, N is the number of samples, ρ is the cleansed correlation of Di or Dij and S, and σρ is the standard deviation of ρ. The average reliability of the Di , Dij , and S is denoted by αD and αS , respectively.
Regarding hypothesis 1, Table 3 presents the overall results of the meta-analyses. It can be seen in Table 3 that all the Di and Dij are significantly correlated to S. Thus, hypothesis 1 is accepted.
Meta-analyses on the correlation between Di or Dij and S.
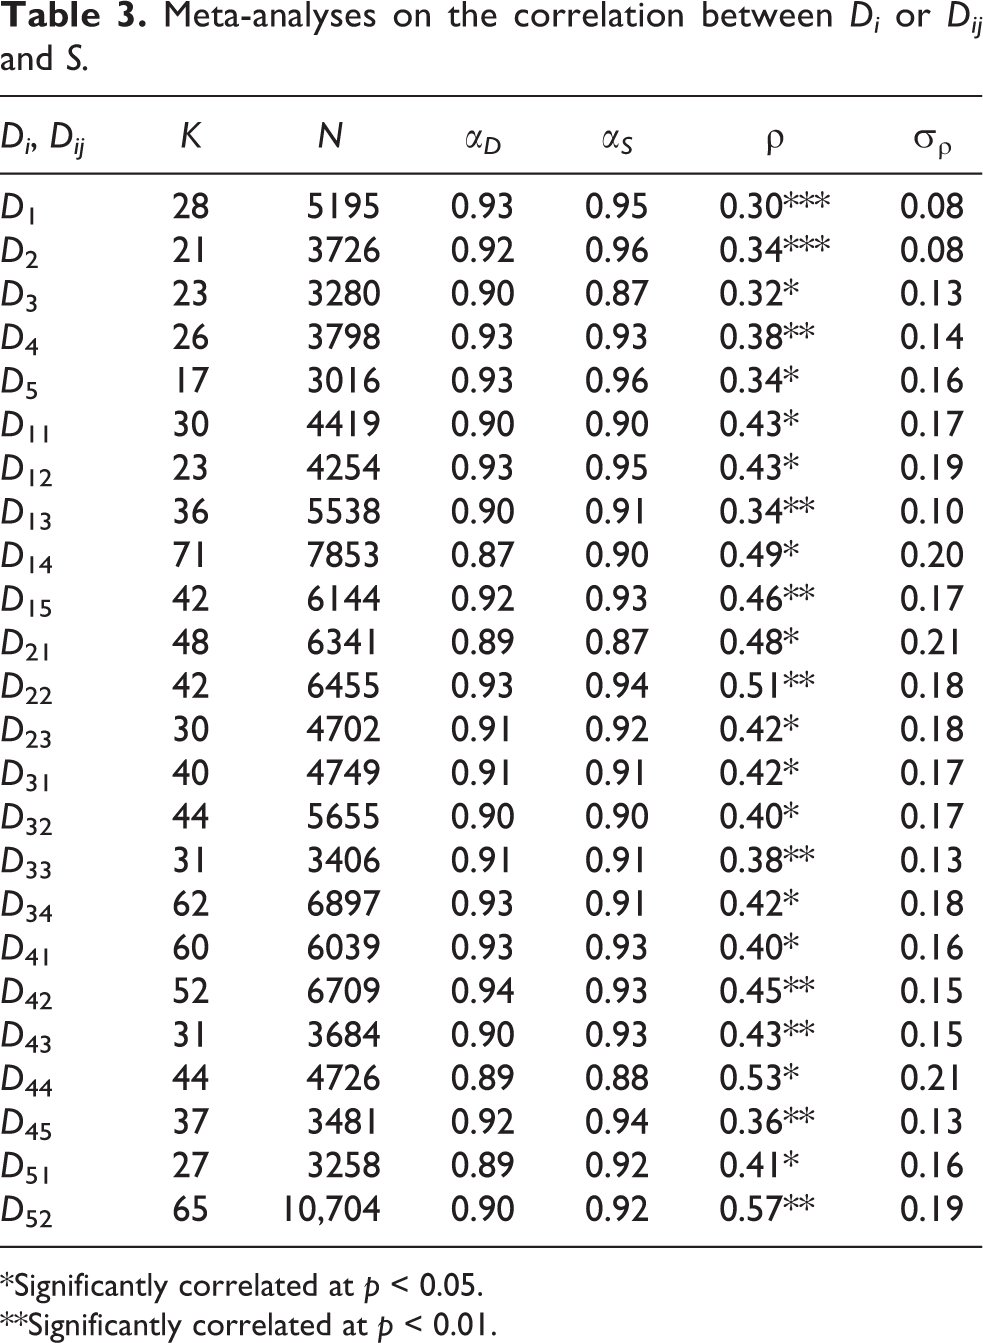
*Significantly correlated at p < 0.05.
**Significantly correlated at p < 0.01.
Table 4 to 6 present the results of the meta-analyses based on industry type, geographical area, and publication year, respectively, to test hypotheses 2, 3, and 4. The difference between two correlation values from two different groups (ρ 1 and ρ 2) are identified using the tests of two means procedure, 99 through the z-statistic value. The z-statistic is calculated from the related ρ, σρ , and K. The analyses are performed on some Di and Dij , regarding to the availability of the decent data.
The difference (z-test) between two related Di -S and Dij -S correlations based on industry type.
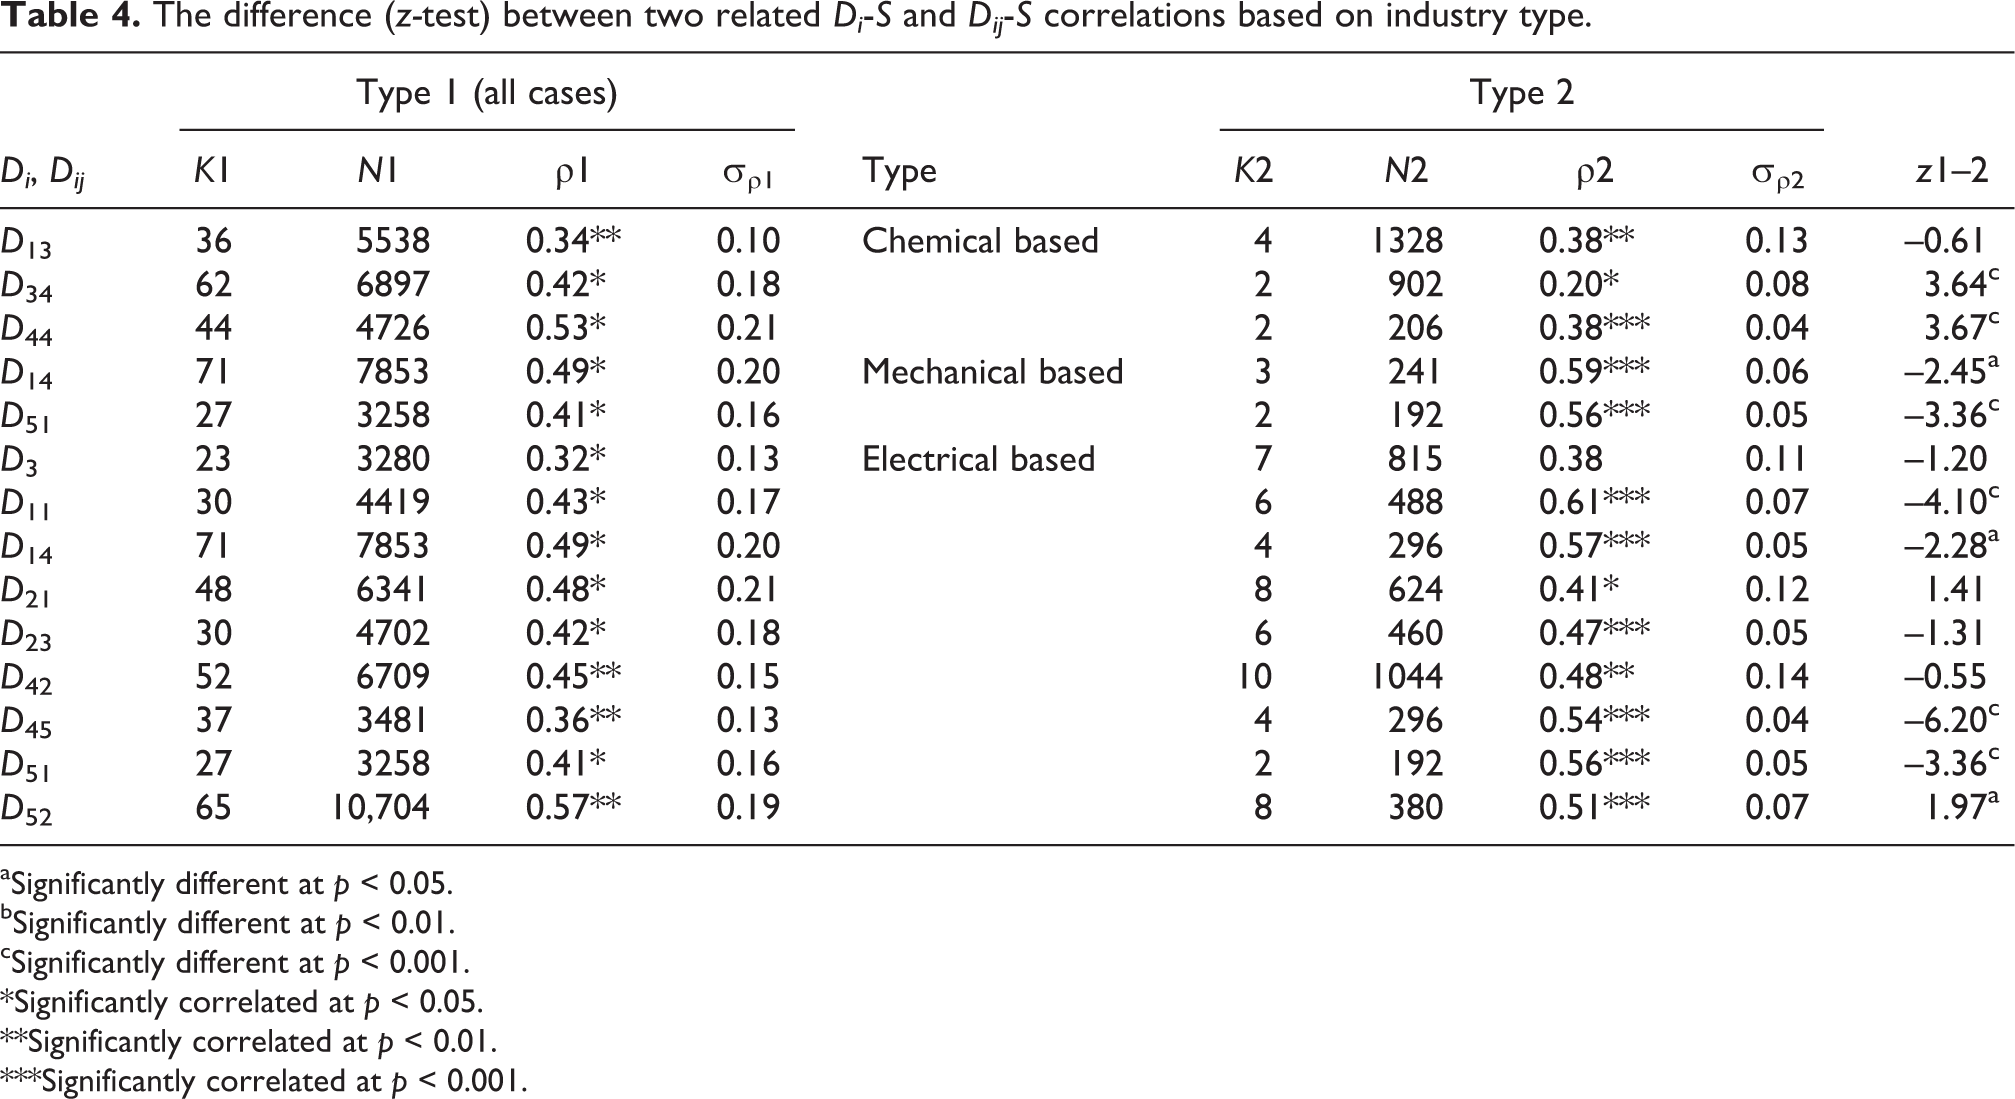
aSignificantly different at p < 0.05.
bSignificantly different at p < 0.01.
cSignificantly different at p < 0.001.
*Significantly correlated at p < 0.05.
**Significantly correlated at p < 0.01.
***Significantly correlated at p < 0.001.
In Table 4, the results of the z-tests show that 9 out of 14 Di -S and Dij -S correlations of the chemical-based industries, mechanical-based industries, and electrical-based industries (ρ 2) differ from the all-cases’ correlations (ρ 1). In other words, there is a variation among the differences of the correlations. Thus, hypothesis 2 is accepted.
Table 5 compares the Di -S and Dij -S correlations based on geographical area. There are four areas to be considered: America, Europe, Asia, and Africa. The America-Europe comparison shows that the Di -S and Dij -S correlations from the cases in both areas are nearly the same. Only 2 out of 10 z-tests show the difference. The America-Asia comparison shows that 13 out of 16 z-tests indicate different correlations, whereas the Europe-Asia comparison shows three different correlations from the seven z-tests performed. In summary, the Di -S and Dij -S correlations varied by geographical area, and hypothesis 3 is accepted.
In Table 6, the Di -S and Dij -S correlations are compared based on time or publication year of the articles in this case. The cases are classified into two groups, that is, case studies published in year 2000 and earlier and case studies published after year 2000. The z-tests show that 10 out of 12 Di -S and Dij -S correlations of the two groups are significantly different. This result supports hypothesis 4 to be accepted.
The difference (z-test) between two related Di -S and Dij -S correlations based on geographical area.

aSignificantly different at p < 0.05.
bSignificantly different at p < 0.01.
cSignificantly different at p < 0.001.
*Significantly correlated at p < 0.05.
**Significantly correlated at p < 0.01.
***Significantly correlated at p < 0.001.
The difference (z-test) between two related Di -S and Dij -S correlations based on publication year.

aSignificantly different at p < 0.05.
bSignificantly different at p < 0.01.
cSignificantly different at p < 0.001.
*Significantly correlated at p < 0.05.
**Significantly correlated at p < 0.01.
***Significantly correlated at p < 0.001.
To sum up, all the comparisons show that the role of product development activities on product success is specific for every group of cases. It confirms the phenomena shown in Table 1 and answers a part of question Q1. However, still, the meta-analysis results as well as every study involved could not definitely answer if the role of product development activities on product success is specific for every case. In other words, the results of meta-analyses are still confusing to be referred to, especially for practices.
Meta-analyses presented above provide the most likely Di -S and Dij -S correlations, but they cannot explain the unique character of a case. Therefore, the upcoming analyses will use observational data.
AHP for experts’ judgment
The mechanism of AHP
AHP is basically a process for decision-making. 100,101 This approach is designed to combine the rational and the intuitive aspects that could not be quantitatively presented, to choose a best decision upon some alternatives based on some criteria. Some problems usually solved by AHP are priority/weight setting, alternative generation, best policy decision, requirement determination, resource allocation, risk assessment, performance measurement, system design, system stability evaluation, optimization, planning, and conflict resolution. 100
In this study, the AHP is used to find weights, that is, the influence level of product development activities on product success, according to experts’ judgment. The results of AHP will be used to elaborate the special characteristic of the relationship between the product development activities and product success, to accomplish answering question Q1.
The AHP performed in this study begins with the data collection through a questionnaire of pairwise comparison among the influence level of product development activities and sub-activities (as defined in Table 2). The respondents (the experts) are asked to compare all combination or pairs of activities. The results then are converted into a scoring system and input to a pairwise comparison matrix. Next, the weighted averages of the influence level are computed and the results are normalized. The AHP computation in this study used a software designed by Goepel. 102 The result of AHP computation is feasible if the consistency ratio (CR) is less than 0.1.
Data for AHP
The questionnaires described above are accomplished by nine product development experts from three local companies in Indonesia. The experts meant here are the companies’ personnel who have long years of experience in doing practices related to product development. The judgments from the experts are assumed to be a reference, as their long experiences give strong intuition related to the projects performed in their company. The three companies are hospital equipment manufacturer, special paper manufacturer, and furniture manufacturer, named as A, B, and C, respectively. Table 7 shows the profile of the experts.
Experts’ profile.

Finding from AHP
The results of the weight computation using AHP 102 are shown in Table 8 with 0.001 ≤ CR ≤ 0.068, fulfilling the minimum required CR. The weights represent the level of influence of activities (Di ) and sub-activities (Dij ) on S.
The importance of activity for product success according to the experts’ judgment.

As shown in Table 8, every company has its unique result, as it produces different product characters. The experts from company A say that the development of product idea (D 1) is the most influencing activity on product success. The experts of company B opine that the detail design of product (D 3) is giving the highest impact on product success. In company C, the experts think that the test of the design of product (D 4) is the most important activity to trigger product success.
The characteristic of product is one of the causal factors of the uniqueness. Company A, which produces hospital equipment, must be focused on the development of product idea. Innovation on the function and features of the hospital equipment is the most important concern to win the market. Technical aspect is not too difficult to handle because the technology change in the production process is relatively slow. In company B, detail design of product is the most important to trigger product success. Special paper products like security paper and smart card must be highly accurate and highly precise. The technical aspects take the main role in this case. Company C, a wood products manufacturer, concerns on the test of the design of product, as it has to serve its customer regarding to the customized order. Many corrections, modifications, and adjustments are required even during installation and finishing of the products.
According to the industry grouping in the meta-analyses, company A and company C are included in the same group (mechanical-based industry). However, the most influencing activities of those companies are different. This result answers the question Q1: The role of product development activity on product success is specific for every case.
Up to this point, the question Q2 has not been answered. The procedure to decide the most influencing activity on product success must be evaluated by analyzing the behavior of the activities in detail. The analysis must use operational data, as the following analysis.
Resource allocation analysis
The mechanism of resource allocation analysis
The resource allocation analysis here is dedicated to answer question Q2, to find a procedure to determine which product development activities influence product success. Determining the influencing activity in a case can be conducted by identifying the pattern of the relationship between the product development activities and product success, in order that the way the activities influencing the product success can be found out. Thus, both the level of the activities and the level of product success must be measured as the following.
Some researchers calculate the resource consumed for a product development process to measure the level of the process. 74,103 –105 In this study, the resources allocated for every activity of some finished product development project are measured. The approach used to compute the allocated resources is ABC. 103 The ABC is modified for product development process and the steps are as follows: (1) identification of the cost centers, (2) identification of the costs, (3) allocation of the costs in every cost center, (4) identification of activities involved, (5) identification of the activity-related cost drivers, (6) computation of the activity costs in every cost center, and (7) computation of the overall activity cost. Furthermore, the product success is measured based on the cumulative sales volume, the market share, the cumulative profit, the market life, and the payback period, as recommended by some previous studies. 15,106,107
Analyzing the resources consumed/allocated for every activity of product development process and then correlating them to the product success will give information about the importance of every activity on product success. Then, by observing some product development projects of similar products, the pattern of the relationship between the level of product development activity and the level of success can be measured in order to answer the question Q2.
Data for resource allocation analysis
The resources consumed by every activity of product development are measured by a series of direct and indirect interviews using structured questions list. The data are collected from nine product development projects in the three companies previously mentioned. Table 9 presents these projects.
Projects observed.

In general, the data consist of the man power involved, the machines and tools utilized, the material and supplies consumed, the duration of activity, and the time utilization.
Finding from resource allocation analysis
The computations of resource allocation on activities are carried out for every project. The profile of resource allocation on product development process for four projects in company A, two projects in company B, and three projects in company C is presented in Figure 1. Due to the space limitation, the resource allocation on the activities is not presented here.
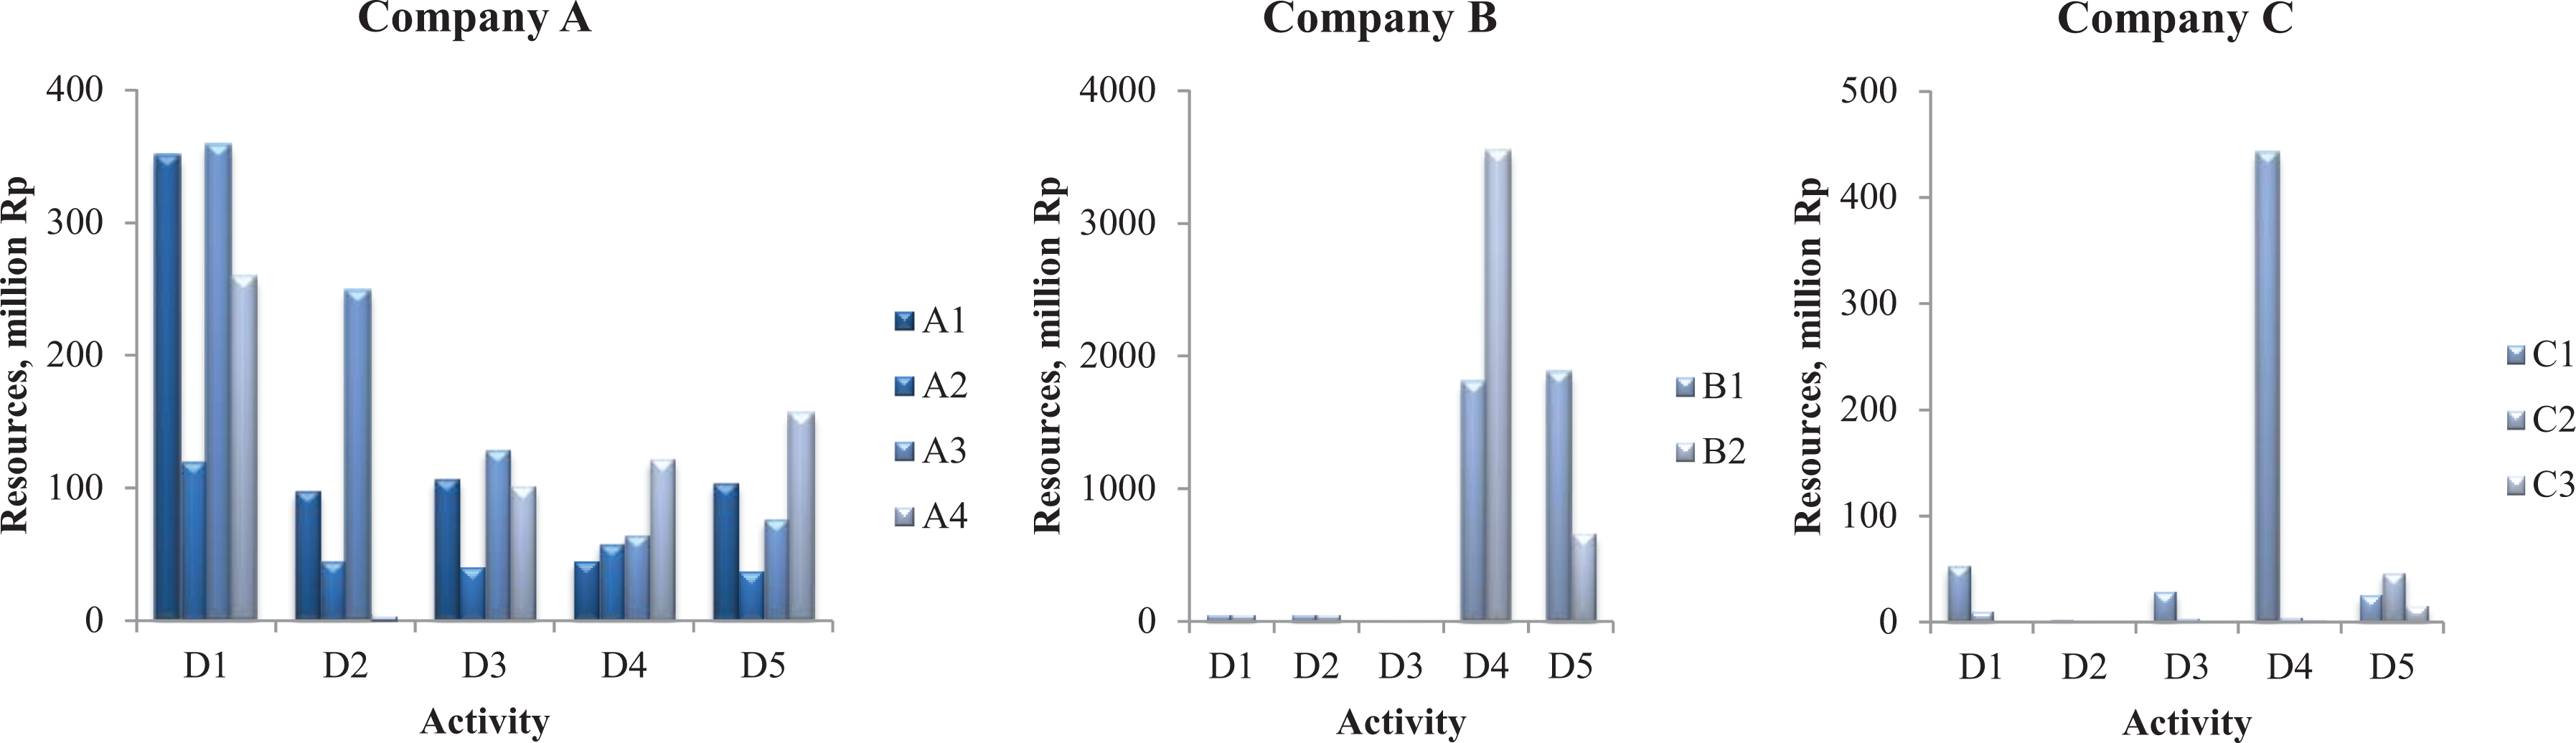
The profile of resource allocation on product development activities.
The influence of the activity on product success will be portrayed by analyzing the pattern of the relationship between the level of resource allocation on every activity and sub-activity to the related product success level. The level of resource allocation on an activity may significantly relate to product success, or may weakly relate to product success, or may not have a relation to product success.
A scoring system in the range of 0–10 is applied to evaluate the relationship, as presented in Table 10. Score 10 means the possible highest value of resources allocated in an activity, defined for every company. Score below 10 is obtained by linear interpolation. The blank cell in Table 10 means the associated project does not perform the activity.
The existence of the product success–resource allocation (S–Di ) relationship.
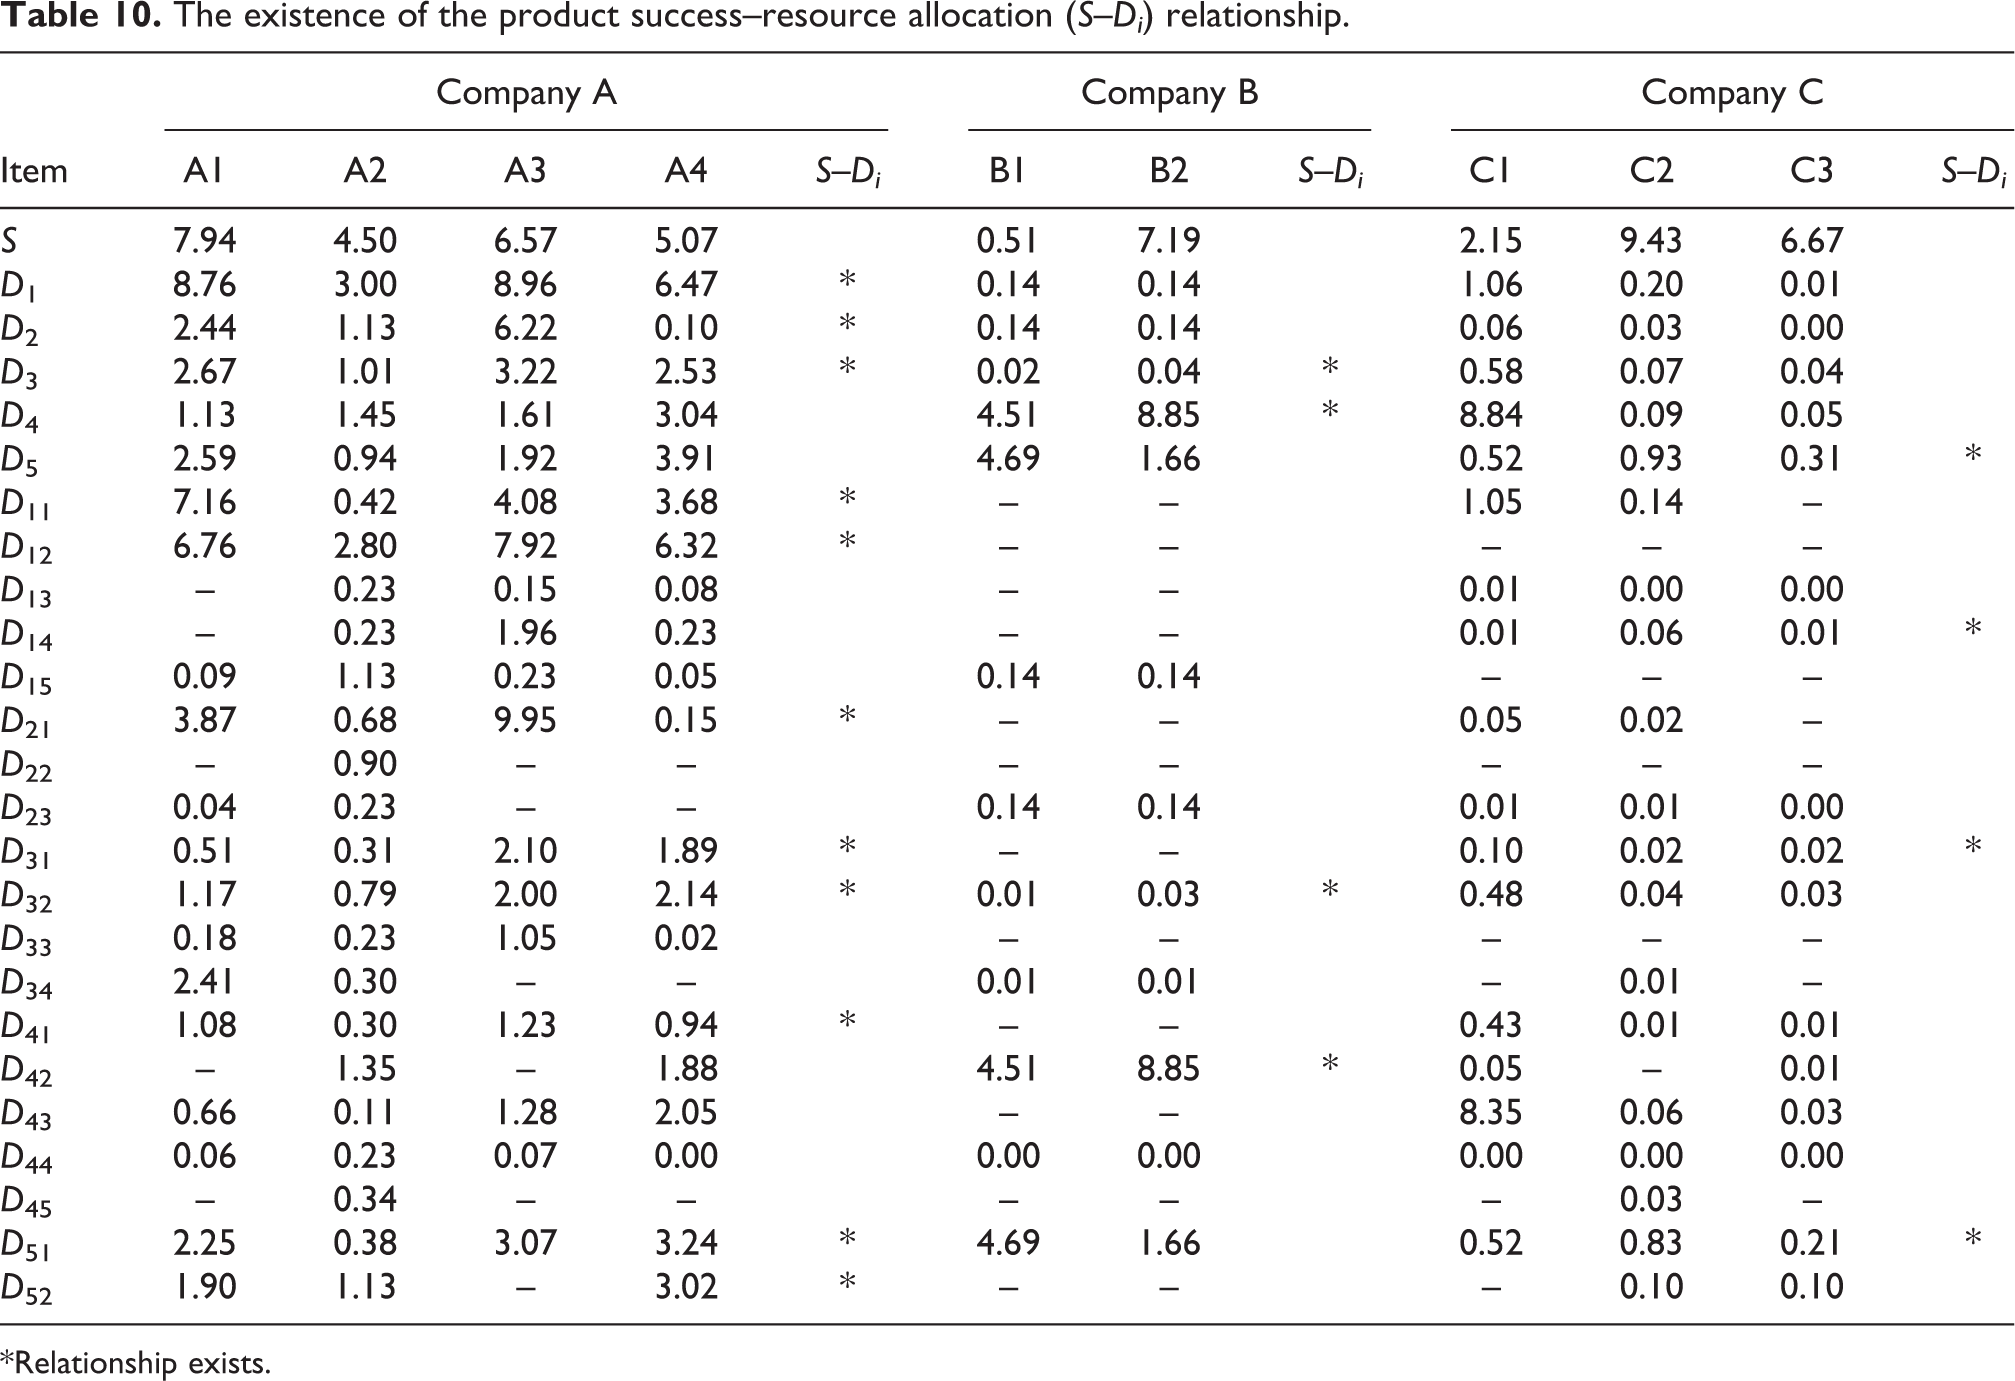
*Relationship exists.
The existence of the relationships (* signs in Table 10) are taken from regression analysis. Figure 2 shows the examples of the relationship pattern of an influencing activity (D 1) and a noninfluencing activity (D 4) on product success in company A.
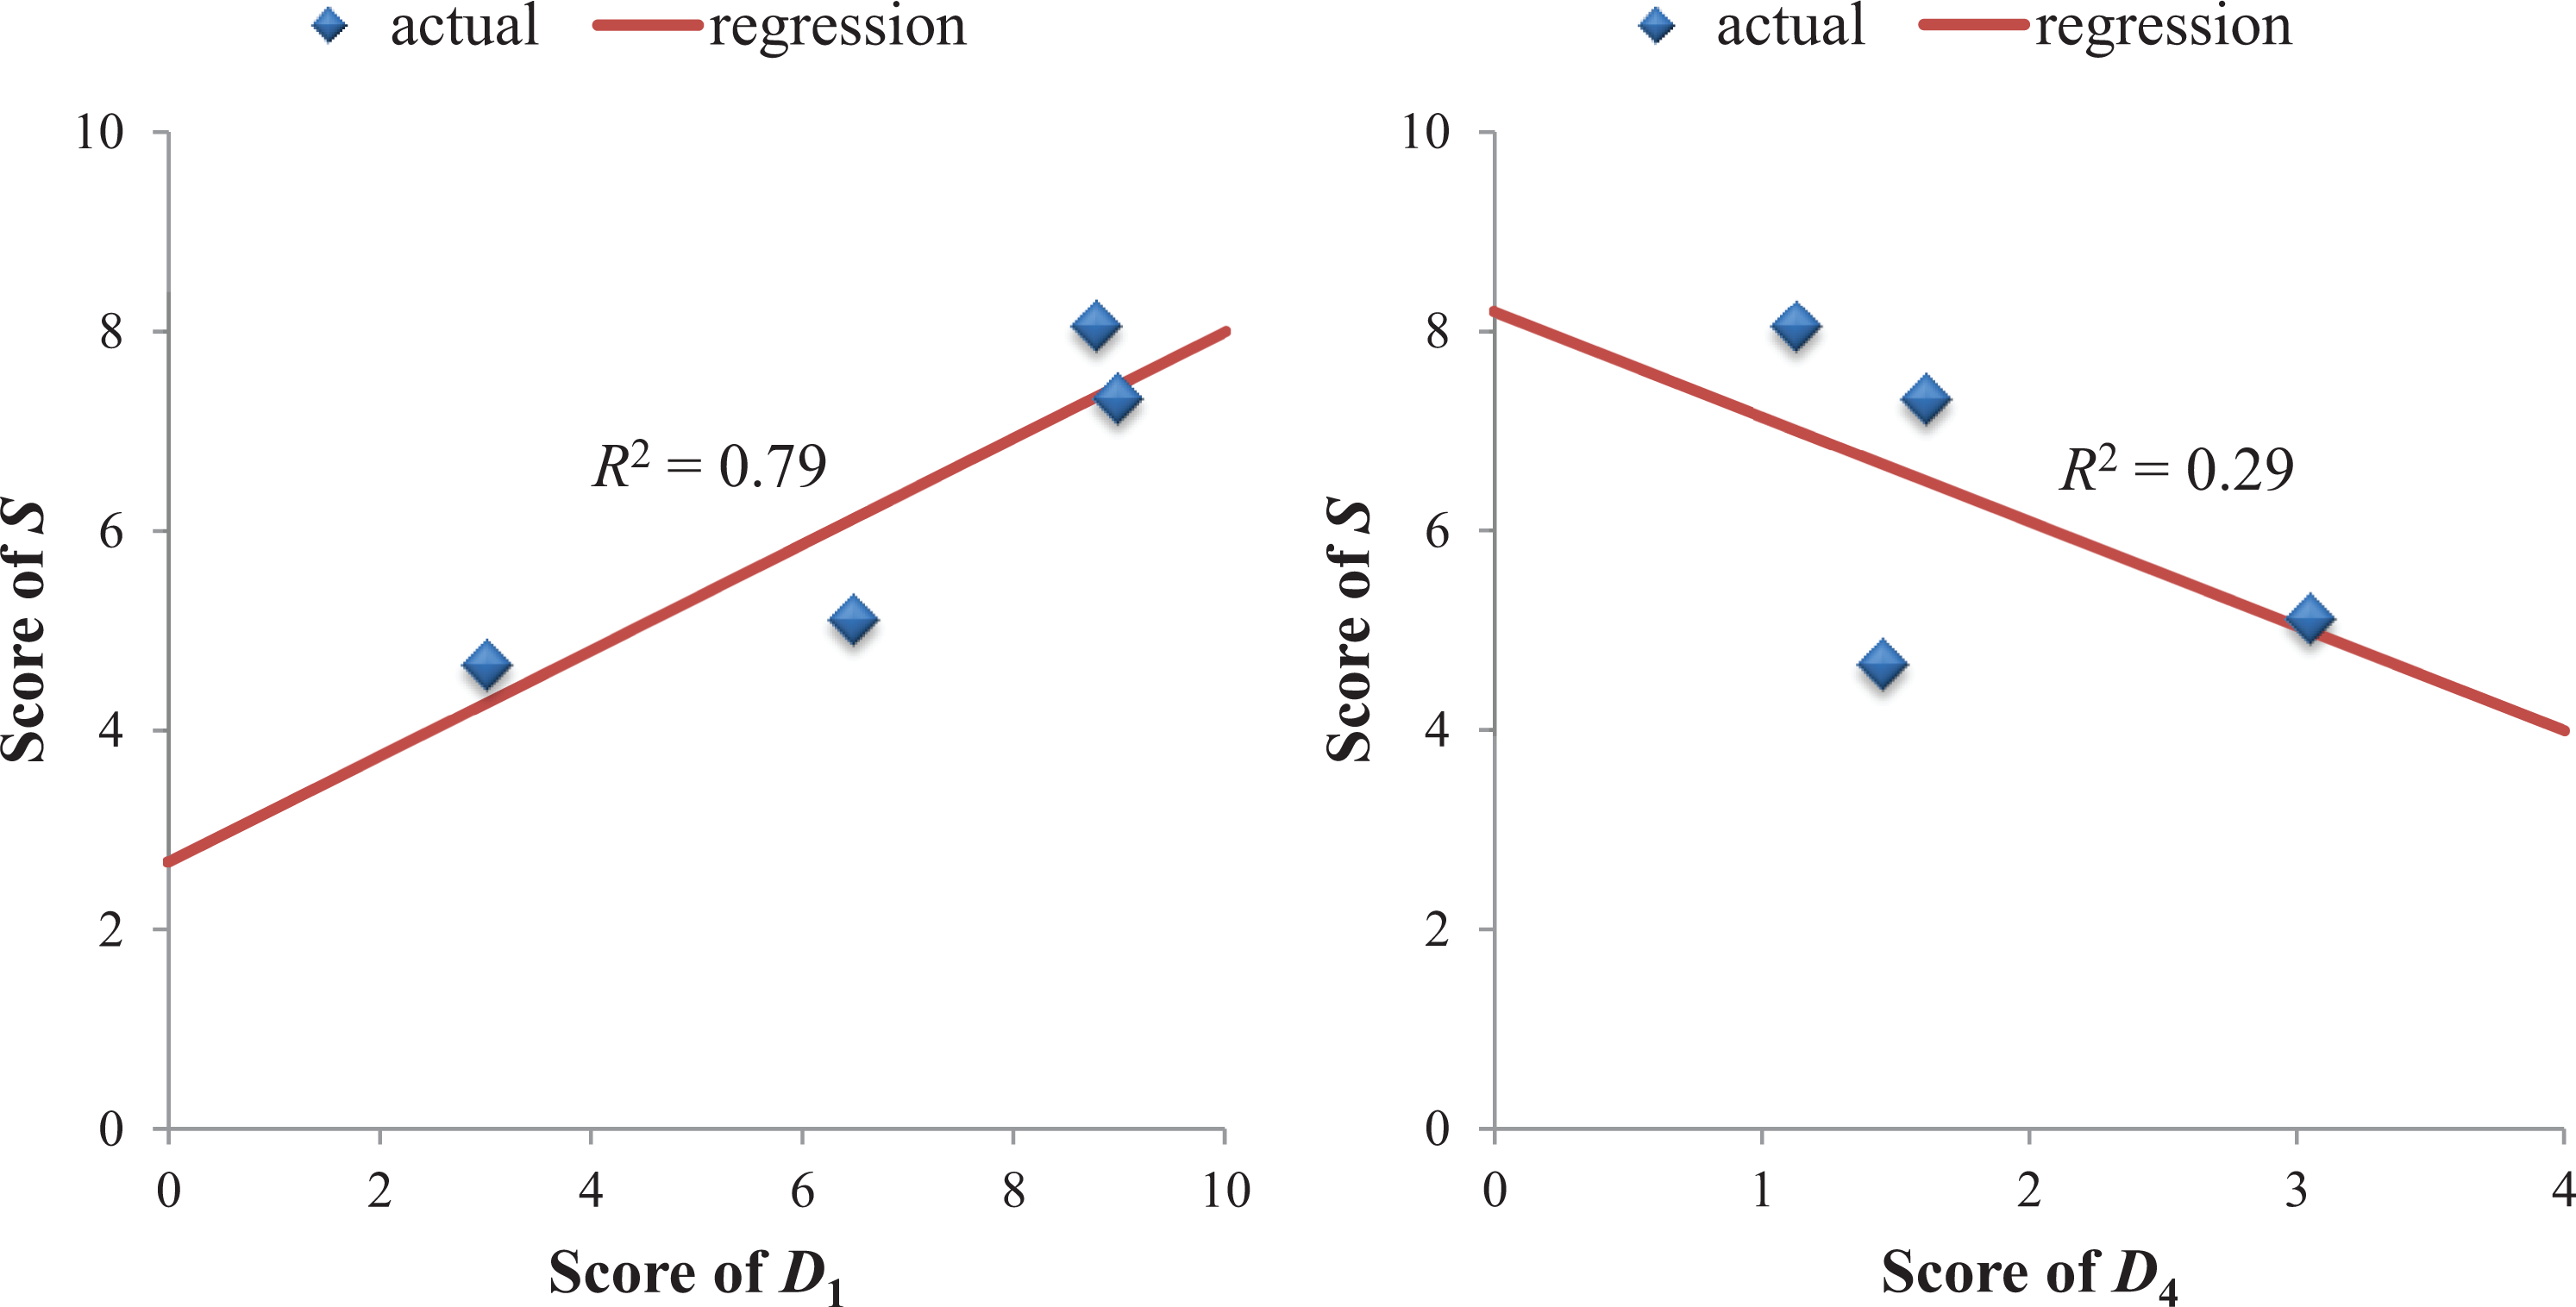
Example of the relationship between resource allocation and product success.
As illustrated in Figure 2, resource allocation on D 1 in company A is in line with product success (R 2 = 0.79). Otherwise, the resource allocated to D 4 does not seem related to product success (R 2 = 0.29). To sum up, by plotting the relationship between resource allocation on an activity or sub-activity and its related product success, the way an activity influencing product success could be examined.
Additionally, in case the profile of the relationship between resource allocation level and product success level is not linear, a procedure of linear transformation before the regression process is required. Figure 3 gives an example of this case, the activity D 2 of product development project in company A.

Example of the nonlinear relationship.
In summary, the variations of the existence of the S–Di and S–Dij relationship among the cases presented in Table 10 affirm the findings from the AHP. Moreover, the pattern of the S–Di and S–Dij relationship as illustrated in Figures 2 and 3 can be used to identify the influencing activity on product success. It answers the question Q2.
Cross-examination on experts’ judgment and resource allocation analysis
Although both question Q1 and question Q2 have been accomplished, there is a phenomenon to be noticed further, that is, that the influencing activity identified by AHP differs from the influencing activity identified by resource allocation analysis. Thus, a cross-examination on the two approaches is conducted to explore this phenomenon through the following analysis.
In Table 11, the influence levels of product development activities on product success according to the experts’ judgment are compared to the resources allocation levels and connected to the existence of S–Dij relationship. The adjusted scores (0–10) of the influence level of product development activities or sub-activities (are computed from Table 8) and the adjusted scores of the level of resource allocation on activities or sub-activities (are computed from Table 10). Score around 0–5 is categorized as “low,” and score around 5–10 is categorized as “high.” There are four types of combination of activity influence score (from experts’ judgment) and resources level score (from resource allocation analysis). The first is the combination of high influence score and high resources level. The second is the combination of high-importance score and low resources level, and the third is the combination of low-importance score and low resources level. The last is the combination of low-importance score and high resources level.
Experts’ judgment, resource allocation level, and existence of S–Di .

SA: sub-activity; EJ: experts’ judgment; RA: total resource allocation.
*Relationship exists.
In general, with some exceptions, when a high-importance activity is highly funded, this activity looks to influence product success. Otherwise, a high-importance activity looks to have no impact on product success when the resources allocated on the activity are low. High level of resource allocation on low-importance activity may or may not affect product success. Low level of resource allocation on low-importance activity will give no effect on product success. It is not necessary to allocate high level resources on low-importance activity, as it will be a waste. In summary, to trigger the product success, resources should be highly allocated to the most important activities. The resources for the low-important activity, otherwise, should be minimized for effective funding.
Figure 4 shows the quadrant presentation of these phenomena. In Figure 4, 5 out of 41 points (12.2%) are exceptions from the conclusion above, as shown by the red balls far below the middle line and two blue boxes far above the middle line. This deviation may be caused by the error in data collection, or the “not yet”-relevant experts’ judgment because of some radical changes in the system.

Activity importance, resource allocation level, and contribution to product success.
From the cross-examination on experts’ judgment and resource allocation analysis, it can be concluded that to determine the influencing product development activities on product success, the two aspects, that is, experts’ judgment and the level of resource allocation history, must be involved. The level of resource allocation history will portray the inner behavior of the system, while the experts’ judgment will intuitively accommodate the nonhistorical character of the system.
Furthermore, the following procedure is developed to clear up the idea described above (Figure 5). This preliminary procedure basically determines the influencing product development activities by experts’ judgment and resource allocation analysis.
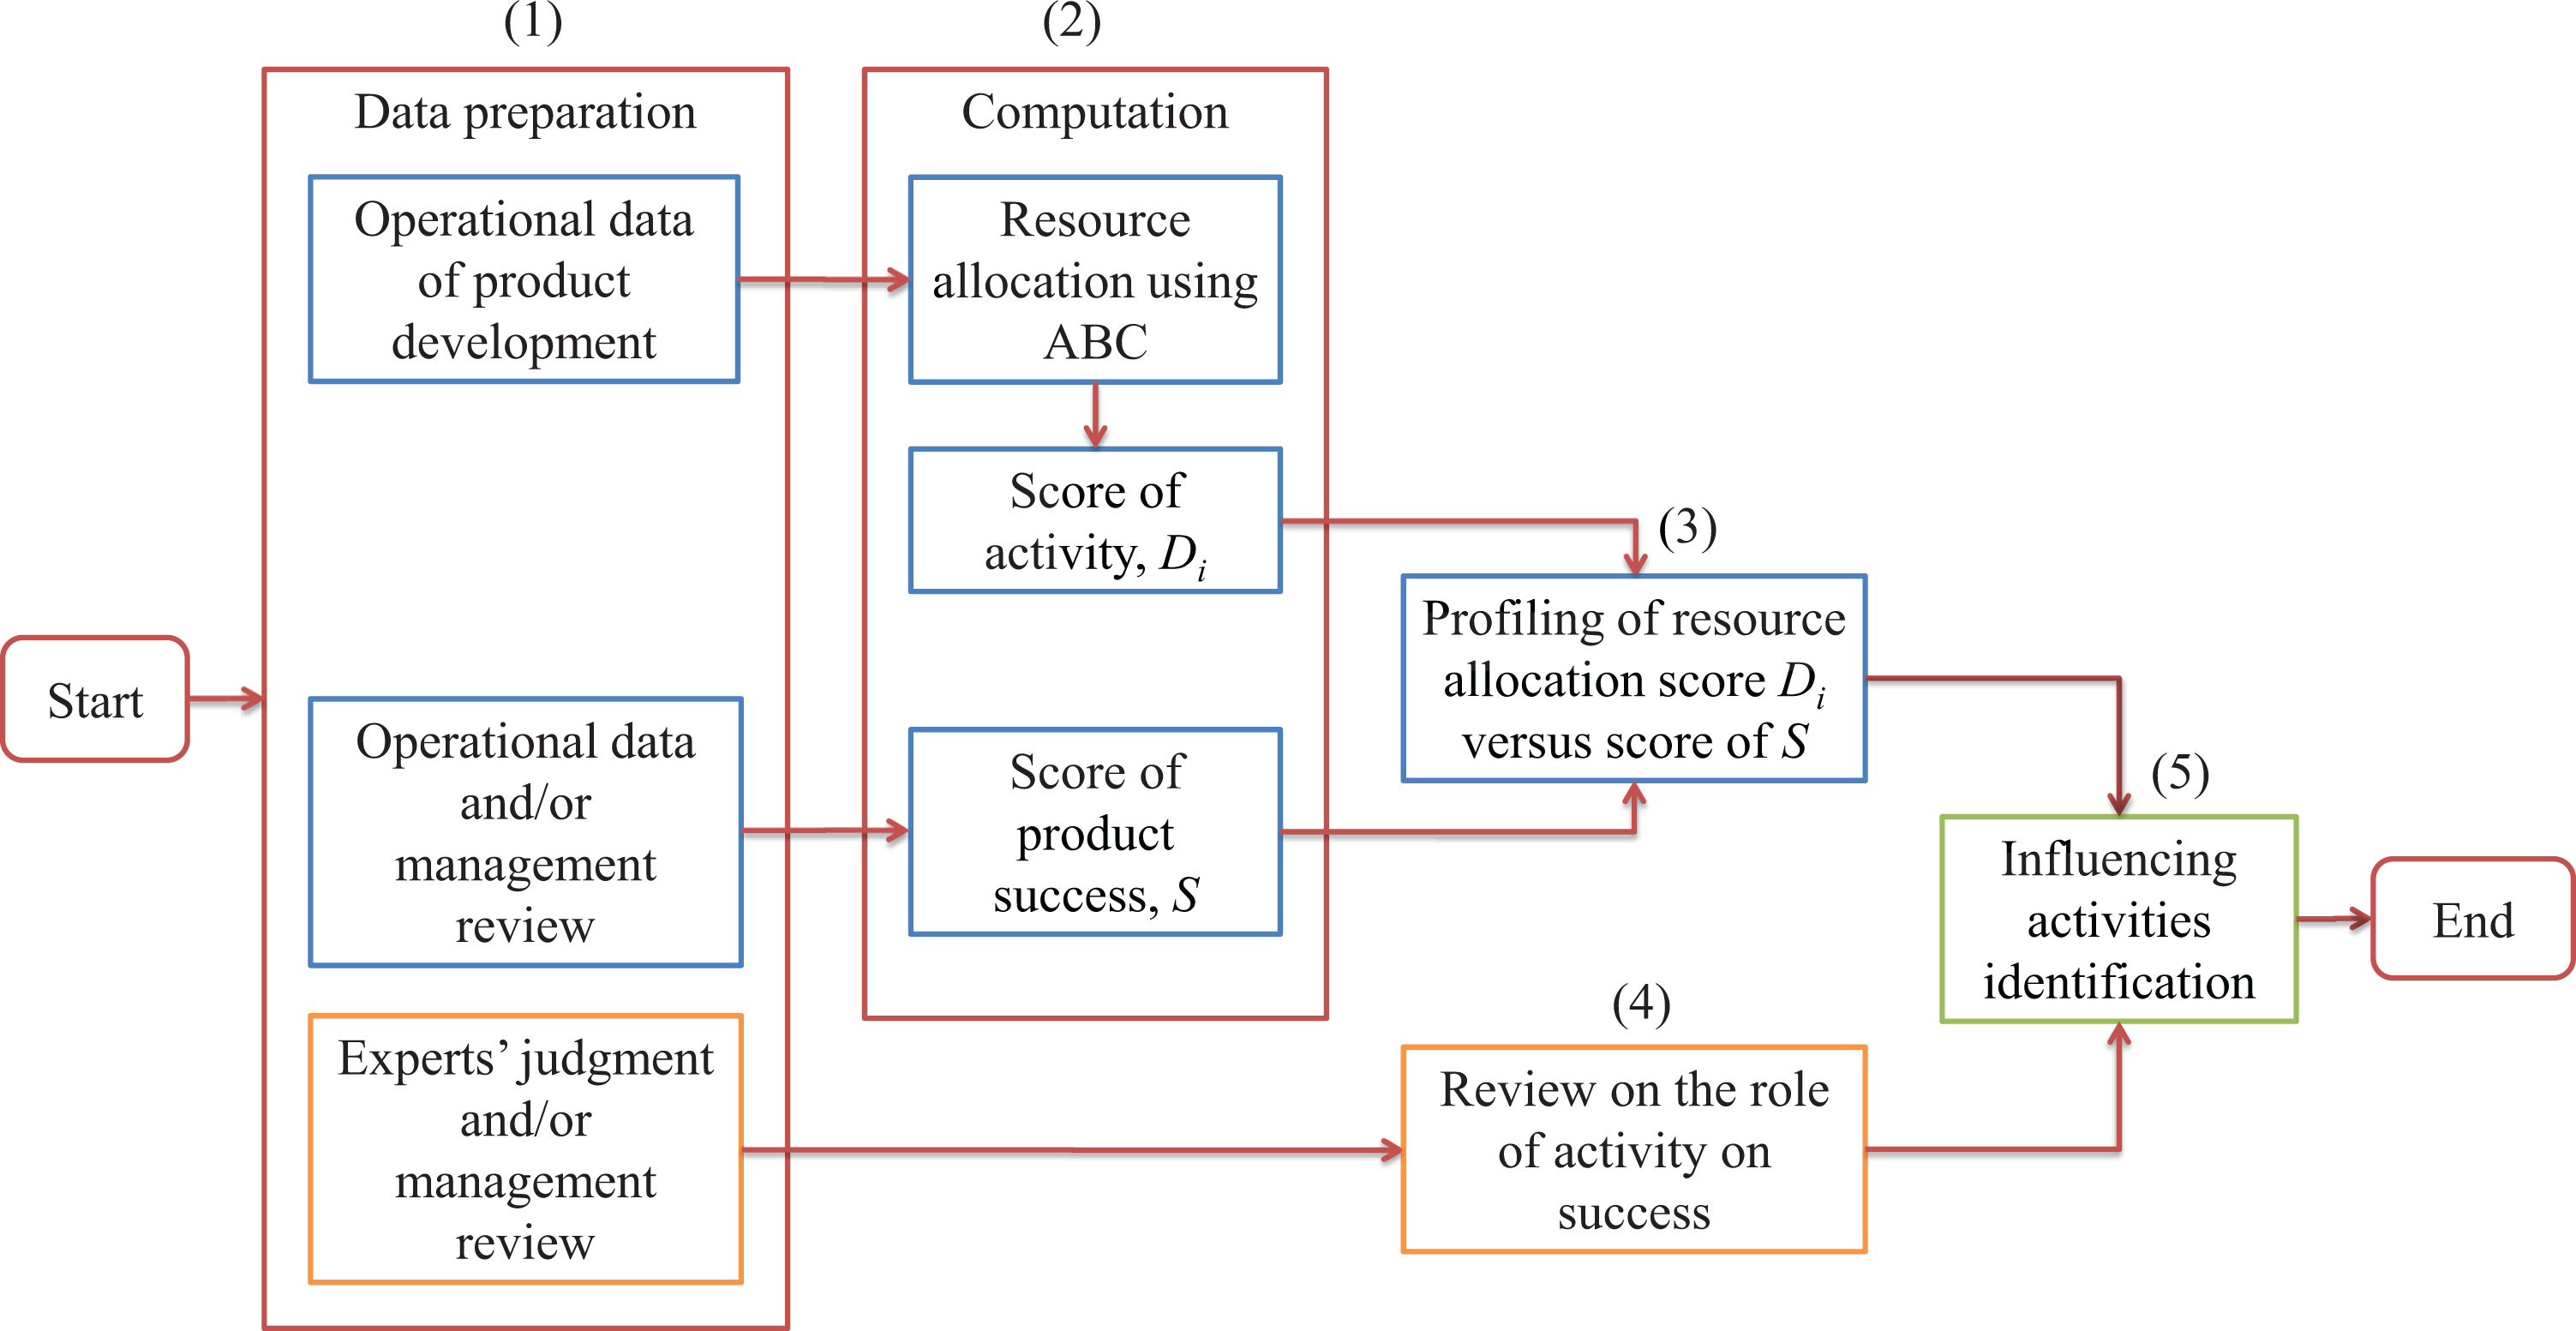
A preliminary procedure to determine the influencing product development activities on product success.
Further discussion
As mentioned in the beginning of the article, the main problem discussed in this article is that the previous studies on the role of product development activities on product success are confusing to be referred to, especially for practices. A manufacturing company, for example, wanting to decide which part of product development process should the money spend on mostly, will get confused in finding which study to be referred to. Some related case studies in manufacturing field conclude different results.
Hence, the way to solve the problem can be performed by developing a general mechanism to identify the influencing activities for every case. No study discusses this mechanism this far. Thus, this study triangulates three different data sources using three different methods to explore the behavior of the relationship between product development activities and product success, in order to find the answer for the problems.
An important and beneficial insight drawn from this triangulation process is that historical data of resource allocation on product development process, altogether with the judgment from the experts, can be used to analyze the role of product development activities on product success. The result of the analysis can help companies to decide the focus of product development funding, or in other words, to decide which activities of product development should be highly funded because they potentially increase the product success.
Conclusions and further opportunity
A triangulation performed in this study on meta-analyses result, experts’ judgment, and resource allocation analysis on the role of product development activities on product success draws these two following conclusions.
First, the role of product development activities is specific for every case, so that the use of an aggregate data from a wide variation of cases as usually conducted by many researchers this far may mislead the conclusion.
Second, the findings in the resource allocation analysis and the experts’ judgment analysis show that although all the activities in product development process are mandatory, some of the activities potentially trigger the product success more than the others. A procedure of determining influencing activities by the resource allocation analysis and the experts’ judgment (Figure 5) can help companies to decide the focus of their product development funding.
Moreover, the findings from this study lead to some further research opportunities. The results of meta-analyses, as an updated works, can be used for many related studies. The mechanism of the resource allocation analysis is a valuable idea for further research on management accounting. The preliminary procedure proposed at the end of this article still needs to be tested and developed further to be practically perfect.
Footnotes
Declaration of conflicting interests
The author(s) declared no potential conflicts of interest with respect to the research, authorship, and/or publication of this article.
Funding
The author(s) received no financial support for the research, authorship, and/or publication of this article.