
Abstract
This article is based on the development and application of a procedure to measure and improve external customer satisfaction, allowing a rational intervention in the variables related to the quality of service and leading to the progressive improvement of quality management in stores of Santo Domingo, Ecuador. It was possible to measure the levels of satisfaction experienced by customers based on perceptions about the service they receive. In addition, it allowed the modeling of indicators measuring the degree of customer satisfaction and loyalty, both globally and by processes, from a multi-attribute approach, which uses a linear additive model of attributes that characterize it and identifies those essential and critical of according to its importance and current valuation, in the framework of the specific procedure developed to evaluate the level of service performance, allowing to focus the management actions towards the solution of problems and the improvement of vital aspects of the execution of the service and in this way to maintain a continuous monitoring of the indicators of performance of the customer satisfaction in the selected organization.
Keywords
Introduction
Satisfaction is a diagnostic indicator that allows evaluating the expectations and measure consumer behavior. 1 –3 Both customer expectations and perceptions about their levels of satisfaction are dynamic dimensions, this means that companies must measure them regularly to monitor them and check the gap being generated between them.
In Santo Domingo, Ecuador, small businesses predominate, especially in the commercial and foodservice sector. Although the intention of state institutions with regard to the need to improve quality management in enterprises was obvious, this concern did not reach micro and small enterprises. Small and medium-sized enterprises usually have characteristics that demand particular and adaptive treatments for most management methods and procedures. Their products and processes have a lower level of formalization and standardization. They operate in less formal and more dynamic environments. The preparation of its personnel and its managers is reduced compared to the one that exists in companies of greater magnitude, among other aspects.
In this direction of economic restructuring, the so-called “citizen revolution” is being developed in Ecuador, whose basic objective is to increase the efficiency and competitiveness of the Ecuadorian corporate sector, to the benefit of society and also giving importance to small businesses.
To meet the new requirements, there have been multiple programs and strategies, Productivity is treated in its narrow sense, usually measured what to do about what was done and what was spent for it; that is, a part of the dimensions of productivity is analyzed, but the quality and (or) the impact of the service provided, relating it to the proper working of human resources is not included. Studies related to customer expectations are inadequate and the results obtained have not received the attention they require, as a basis for designing or improving services; generally they do not come to the knowledge of all but confined to strategic apex. Only systematic research is carried out with a general character, lacking depth, plus they usually only target the end customer, not including intermediate customers, suppliers.
Interesting contributions can be seen in the study of the levels of customer satisfaction in two fundamental aspects: as part of management methodologies in general 6 –10 and as management particular quality, 11 –14 which are used among the indicators to assess; also, they have been used in studies competitive positioning. 15,16
Specifically aimed at the measurement of external customer satisfaction, interesting proposals have been made,
From the above, the need to measure and increase levels of external customer satisfaction through the implementation of a procedure to take effective when planning resources and implement appropriate actions to improve the quality and satisfaction in decisions manifested commercial organizations of Santo Domingo, Ecuador.
To meet the objective will be carried out an analysis of the main theoretical elements to address the evaluation and improvement of customer satisfaction, then explains the methodology used and the calculation and characterization of the sample, the results of the application of the procedure are presented through a case study and finally the conclusions of the research are offered.
Theoretical analysis
The variety of research related to customer satisfaction increases with the passage of time, the number of publications related to this subject from 2014 to 2016 exceeds 2210 publications taking into consideration only articles published in journals indexed in the Scopus database.
Although the fields of application of the aforementioned publications are representative of different sectors, there is a predominance in the services sector compared to the tangible products sector, where they are scarce and where research of product quality are more abundant. This difference, according to the authors, responds to two reasons: the prevalence of services compared to tangible productions in the current economy and the fact that production is tangible makes internal quality control more feasible.
In the same measure, investigations of the intangibles show a predominance of sectors such as banking 19,20 and the entertainment industry 21,22 regarding this type of research. Although commercial applications are observed, 23 these are not as abundant as the other fields of research cited.
In order to establish the attributes, dimensions, and interrelationships that allow to explain customer satisfaction, several mathematical processes have been proposed, some of which are well known as SERVQUAL, 24 or more recent ones such as the use of postulates of fuzzy logic 25 ; in addition to various quantitative methods like AHP, 26 –30,18 genetic algorithms, 31 structural equations, 32 –34 Bayesian statistics, 35 neural networks, 36 among others. Table 1 shows a summary of the most common methods used for these purposes.
Matrix Saaty for calculating weights of attributes (Wei).

Although most of these models are acceptable for the measurement of customer satisfaction, they do not respond to the peculiarities of SMEs, which do not have trained staff, nor do they have databases and other IT tools that favor the application of this type of approach and demand of techniques that yield similar results but that adapt to their specific peculiarities.
In agreement with the previous one in this research was chosen of the analyzed models like starting point to realize the proposal and to face the problematic studied with tools that adapt to the own environment of the problematic the model SERVQUAL, making changes that they improve the own limitations of the method taken as the basis.
The purpose of this research is to show the results of applying a procedure to measure customer satisfaction in the commerce sector with the use of a combination of some of the methods applied in other sectors with a predominance of the SERVQUAL concept, but with a change in the conformation of the indicator customer satisfaction and the scale used, since in the same indicator assumes diverse assumptions: An additive and compensatory linear model is assumed since the shortcomings in an attribute can be compensated by materialization of the satisfaction in other attributes. It is considered that when evaluating the perceptions these contemplate the expectations given the known fact that what is perceived is conditioned by the previous information that is possessed and that conforms the expectations. It is recognized that not all attributes affect equally in customer satisfaction and that their level of incidence is conditioned by the importance assigned to them by customers.
These three qualities are what distinguish the proposal that is presented.
Methodology
The selected conceptual model is based on system approaches and processes as well as demonstrations by experiment of the interrelationships between the different links that compose and input. 37,38 Inside the bank, this systemic approach leads the synergetic effect on business activity, ranging from the input elements and the cycle of transformations, until the final results of the process.
They are recognized as the main managers of service: client, senior management, and human talent (management and workers), coinciding with the criteria of Karl Albrecht. 38,39 The external customer is the raison d’etre of a commercial organization, give satisfaction to their needs is one of the fundamental objectives of its management. Senior management directs the whole process supported by the workers; the degree of motivation and competence of personnel composing the organization depends largely on its performance in this competitive market.
The service design is developed based on the investigation of what are the essential attributes and the level desired by the customer for each of them, a task that corresponds to the top management; Part of defining how the service quality will be shaped based on each of its essential variables; That is, the “what is going to be offered” (product), “how” (service) and “under what conditions” (environment) are designed. It is also important to consider a study of the price and the guarantees that will be offered.
While the “what” variable refers to what customers receive in their interactions with the organization, that is, the quality of the product that has been offered to them; The “where” variable refers to the spatial and temporal dimension where it receives the product of the service; And the “how” is directly related to the interaction that the customer has with the staff during the service delivery.
In this sense, the model expressed in symbolic language to be measured satisfaction and customer loyalty from two angles: external and internal, in order to determine: The gap between the customer and the organization, determined by the degree to which the customer feels that their expectations have been met. Correspondence between service design and performance, according to internal audit processes and specific quality indicators.
Derived from the conceptual model selected, a procedure was developed for the measurement and improvement of external customer satisfaction, which includes several specific procedures as a tool to support decision making and allows to develop in the business practice the conceptual proposals realized, starting from the proposal made by the author Noda Hernández. 38 This procedure will be carried out through five stages, through the analysis of service performance and ending with the development of action plans to correct critical attributes. It is summarized in Figure 1.

General procedure for measuring and improving customer satisfaction.
For the analysis of attributes and their hierarchy, it is started from the concepts and corresponding results of the mathematical formalization of the AHP. Their detailed development can be seen in any of the references in which the theoretical basis of AHP is gathered. 28 –30,18 The specific procedure used is shown in Figure 2 and Table 1.

Algorithm of attributes weights from the triangle of Füller.
The target population of this research integrates customers of Fantasy Shop Bazar in Santo Domingo city, Ecuador. The sample was taken following a type of stratified probability sampling, as this sampling will be responsible for dividing the population into relatively homogeneous groups called strata, after taking a random sample from each stratum. For a better result, it was decided to initially carry out a pilot test in order to have a better view of the research and a more realistic estimate of the variance.
For the calculation of the sample, the finite sample formula was used. For the confidence level (Z), it will be taken in relation to the 97.5% confidence value is 2.24; for the standard deviation (σ) of the population will be assumed 0.5, the acceptable limit of sampling error (e) shall be assumed to be 0.03. As for the wholesale customers who have their own store will serve a total of 20 customers, the study will be made to each of them. For street vendors, we proceeded to calculate a sample, taking into account that the Bazaar serves a total of 200 customers belonging to this segment. And the retail customers have a population of 1500 customers per month, having as reference an average of 50 costumers per day. The calculated sample sizes and their respective characterization are presented in Tables 2 and 3.
Population and corresponding sample.

Demographic characteristics of the respondents.

Results of application to a case of study
To assess the premises and to carry out the application procedure took into account the commitment and interest shown by the manager who requested the study, and collaborators, who have been motivated by the improvement process. In addition, a workshop was organized to develop training to managers and workers on methodologies and tools essential to improve processes, eliminate inhibitory factors, and propose alternative effective solution.
Stage 1: Beginning of the improvement process
After initial meetings with the manager Bazar and administrative and operational staff of the company, the improvement group, composed of three people from different departments of the organization, was defined.
After achieving the commitment of all levels of the organization with the process and its results, it was passed to enable improvement groups. Improvement groups are small groups consisting of managers and employees of the administrative and operational area. These were imparted training activities planned by area of performance.
Staff training in aspects related to the study being performed. They managed to run training for the working group and for everyone involved with the study in each of the areas.
Stage 2: Current status of the organization
In this stage, the current state of external customer satisfaction in the organization was diagnosed, starting from the analysis of the environment and taking this situation as a starting point for the study.
Characterization of external customers. And external customers can be characterized according to the different profiles that have failed to recognize the following: Wholesale customers. Those residents microentrepreneurs inside and outside the province of Santo Domingo de los Tsáchilas (Manabi, Esmeraldas, Los Ríos, Guayas, Pichincha, Tungurahua) who purchase products line toys, jewelry, crafts, and seasonal items and bazaar to come to market in their commercial establishments. The frequency of visits of these customers to make purchases in the bazaar varies between 7 days and 25 days, depending on the flow that they have in their inventory turnover. Street vendors. They are those who sell small items of novelty or season usually within the city. Purchase frequency of street customers ranges from 1 day to 7 days, depending on their marketability. These customers can be classified into: Customers toy sellers. Who they specialize in the sale of small toys and articles of interest to students of different educational establishments in the province of Santo Domingo de los Tsáchilas. Customers craft vendors. These customers are specialized in selling necklaces, bracelets, rings made by hand, which generally marketed in the center of the city, or in terminals and buses that circulate inside and outside the city. Customers sellers bazaar articles, news, and season. These are customers who offer products that are fast host to passersby in the city. Retail customers. Are those end consumers who buy retail for personal use and not for business the various items that are offered in Fantasy Shop.
Characterization of competitors. Competitors offer the same products online sales, which focus on toys, bazaar, crafts, and novelty items and season. These likewise sold wholesale and retail at provincial and regional level.
Characterization of suppliers. The organization defines selected suppliers in different cities such as Quito, Guayaquil, Cuenca, Machala, and Portoviejo, who guarantee the required quality. Similarly, the company has international suppliers of New York and Lima. All these providers are responsible for defining the company payment methods, sent, warranties, return policies, and so on.
Characterize workers. Fantasy Bazaar Shop has seven employees between administrative and operational staff. Within the operational area, there are three collaborating with university degrees, one of which is working in Fantasy Shop for almost 3 years and the rest in a time no longer than 1 year.
Stage 3: Analysis of the service design
Evaluation of service design. This evaluation is used as a basis for analyzing the adequacy of the design service to customer needs. The technique of expert judgment was used to determine these essential dimensions to meet this objective. Of the 22 specialists 16 respondents, of which 9 were selected to have a coefficient of competencies greater than 0.5. Forming the team of experts, we applied a survey, which is basically structured three-dimensional 38 : General Design Guidelines, Structuring, and Formalization, in order to evaluate the design of the service in the bazaar, according to the customer needs. The results of the expert valuations are shown in Table 4.
Results of the evaluation design service experts.

Rj: sum of the expert hierarchies for each attribute; Dj: weight assigned to each dimension, assumed 0.5 for guidelines, 0.25 for structuring and 0.25 for formalization; Wei: weights of attributes, is calculated as: (Rj/∑Rj) × Dj; Vi: valuations given to the attributes in the audit; QID: quality index of the design, is calculated as: ∑(Wei × Vi.
As can be seen, in the first dimension, the variables most affected are those related to the objectives and strategy (0.40 and 0.68) in the same way management priorities (0.56), in all cases below the average rating. Which means that they are not taking into account the needs and expectations of customers in the strategic planning of the organization.
In the case of third dimension, all variables have obtained lower scores, indicating that practically these elements to the service not take into account or simply nonexistent in the Bazaar. As it recommended prioritize actions to promote the improvement of these variables, which would clearly define service standards in terms of customer expectations, making a correct interpretation to establish service requirements, components, process, and mechanisms for the organization and control of these processes. The overall assessment of the design was 5.04, which is considered a low level. The above shortcomings cause generally considered that the potential design behaves quality at a low level and performing the next step of the general procedure immediately necessary.
Structuring and formalization of the service process
During this step, a study of the chain of processes that integrate services and operational units that make up the organization was held. We proceeded to formalize the design, based on the comprehensive review of the existing one, using the model of process analysis. Initially, the general map of processes Bazar was formed, being clearly defined lines of interaction between internal and external customers, on that basis was elaborated the Procedures Manual.
It is considered that there is an emerging system for measuring the quality of service, which has shortcomings in its operation by the absence of a quality policy explicitly stated that it is consistent for all activities; however, some elements of character that are used rector contain aspects that could become global policies for the entire organization.
Stage 4: Analysis of service performance
Performance evaluation service
They are proposed as global indicators: Global Satisfaction Index (GSI) and the Global Loyalty Index (GLI) as well as specific indicators of satisfaction of external in each of the processes studied customers, and according to the criteria of the members organization, Quality Index according to Internal Audit of each process (QIAp), all are synthesized in the Comprehensive Satisfaction Index. To complete the mathematical modeling of these indicators, it will be based on determining the dimensions and essential attributes that compose them and calculate their weights. Analysis of Global Satisfaction Index
Definition of the dimensions and essential attributes that make up the ISM indicator and weight
To meet this objective was passed to make the third round with selected experts asked their opinion on the attributes that should be taken into account to assess the satisfaction of wholesale customers and retail sale of walking.
After forming an initial list, they were asked the experts to confirm the attributes with which they agreed. From this round, the results shown in Table 5 (only the case of retail customers is shown, the attributes selected for wholesale customers and street vendors are shown in Tables 10 and 11). The variables that reached a concordance coefficient (Cc) greater than 60% were selected, and the validity of the technique used from the χ2 test was calculated for all three cases. The GSI was formed from the dimensions and attributes essential for quality in Fantasy Bazaar Shop, obtained in empirical studies (e.g. Table 5).

Results of the application of expert judgment for retail customers.

Saaty matrix to calculate attributes weights for wholesale customers.

Rj: sum of the expert hierarchies for each attribute; Wei: weights of the attributes, is calculated as (
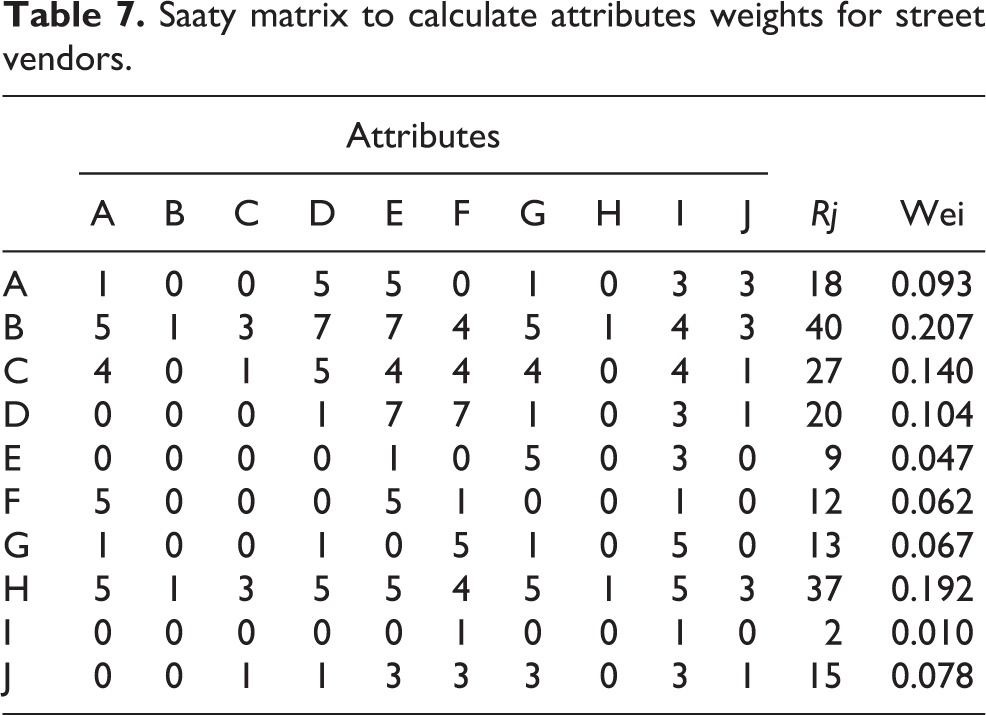
Saaty matrix to calculate attributes weights for street vendors.
Saaty matrix to calculate attributes weights for retail customers.

Analysis of reliability and validity.

aHighly significant; KMO: Kaiser-Meyer-Olkin test; Df: Degrees of freedom.
Results of satisfaction survey to wholesale customers.

Results of the satisfaction survey to street vendors.

Bazaar managers decided to establish the desired state of this indicator by 4.0 points, taking into account historical statistics of competitors and the organization itself.
The weights are determined from proposed by the author Noda Hernández FES method, 38 based on the assumptions of AHP. 28 –30,18 From the processing of the two instruments, the results shown in Tables 6 to 8 that highlight the specific weights of each are the variables for the three customer groups obtained.
Create the measuring instrument
It was decided to use as a measuring instrument survey, starting for processing of selected attributes for each customer group, and adding other questions relevant to know on the basic and customer loyalty information.
Checking the instrument
To analyze the reliability and validity of processed instruments was applied to 15% of the particular sample and the results shown in Table 9 were obtained.
Implementation of the instrument
For the group of wholesale customers, the entire population will be included in the study (20). Applying a simple random sampling method, the number of customers to be surveyed was obtained for the two remaining groups, 175 for street vendors and 723 for retail customers, as shown in Tables 2 and 3.
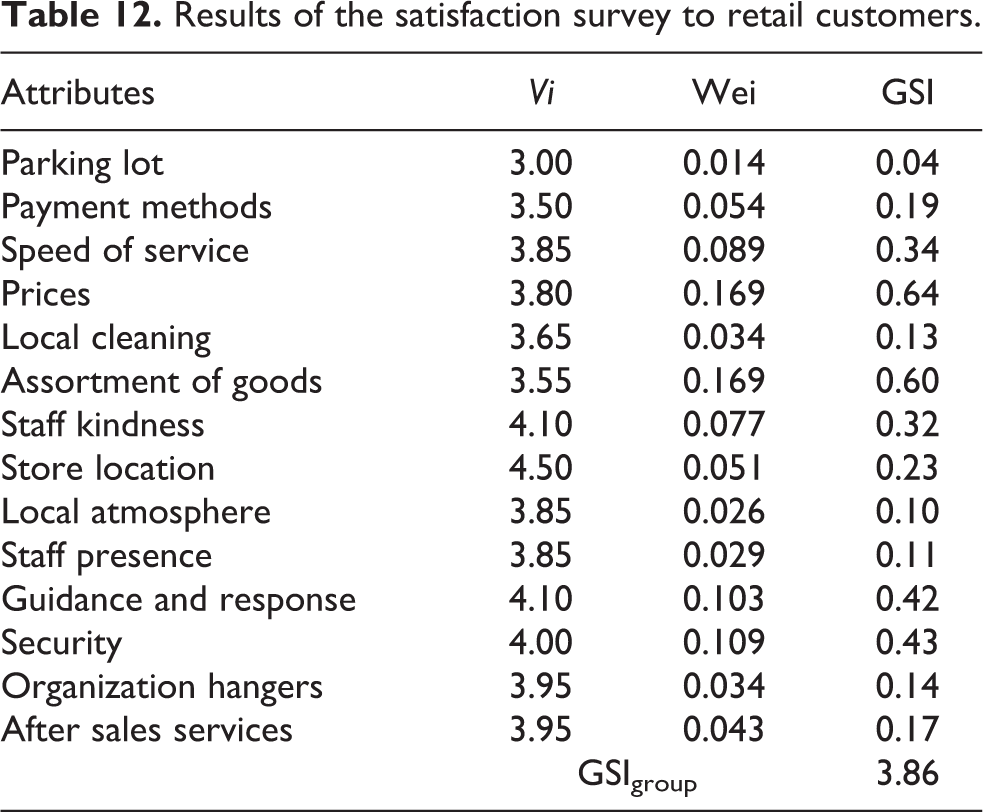
The designed instruments were applied to the three customer groups as the sample sizes calculated for Fantasy Shop Bazaar as part of the application procedure. The results of the quantitative and qualitative evaluation of GSI made to wholesalers, street vendors, and retail customers are shown in Tables 10 to 12.
Results of the satisfaction survey to retail customers.
Analysis of results
At this stage, the analysis of the results is performed from comparison with their desired states, a process that takes place on three levels: mapping of the essential attributes desired, matching indicators with the desired states, and the degree of congruence between external and internal perspective. The results of the matrices attributes of the three types of customers can be seen in Figures 3 to 5.

Results attributes matrices of wholesale customers.

Results attributes matrices of street vendors.

Results attributes matrices of retail customers.
Taking into account these results, we conclude that wholesale customers show a low level of satisfaction (3.89), and most affected attributes are: parking, speed of service and discounts for sales volume. Street vendors have a higher level of satisfaction (4.06), although it also has very low attributes such as speed of service, assortment of goods and after-sales services. Retail customers also had a low satisfaction level (3.86), as they influenced existing dissatisfactions with the service offered, specifically with parking, payment methods, prices, cleaning and assortment of goods, attributes that had greater influence on these negative results.
Like all essential attributes do not have equal weight to external customers, as appropriate, comparison was made, according to the criteria of their importance and value received, complying with that goal arrays essential attributes (Adaptation-Importance) that shown in Figures 3
to 5, where the horizontal line that divides the important attributes less relative importance is set at 0.1 and the vertical line is defined from the desired state or reference level set previously in this case was set at 4.0 for the three groups can be classified customers. With its analysis, attributes can be classified into critical, optimum, indifferent, and acceptable. Analysis of GLI
Global loyalty index.
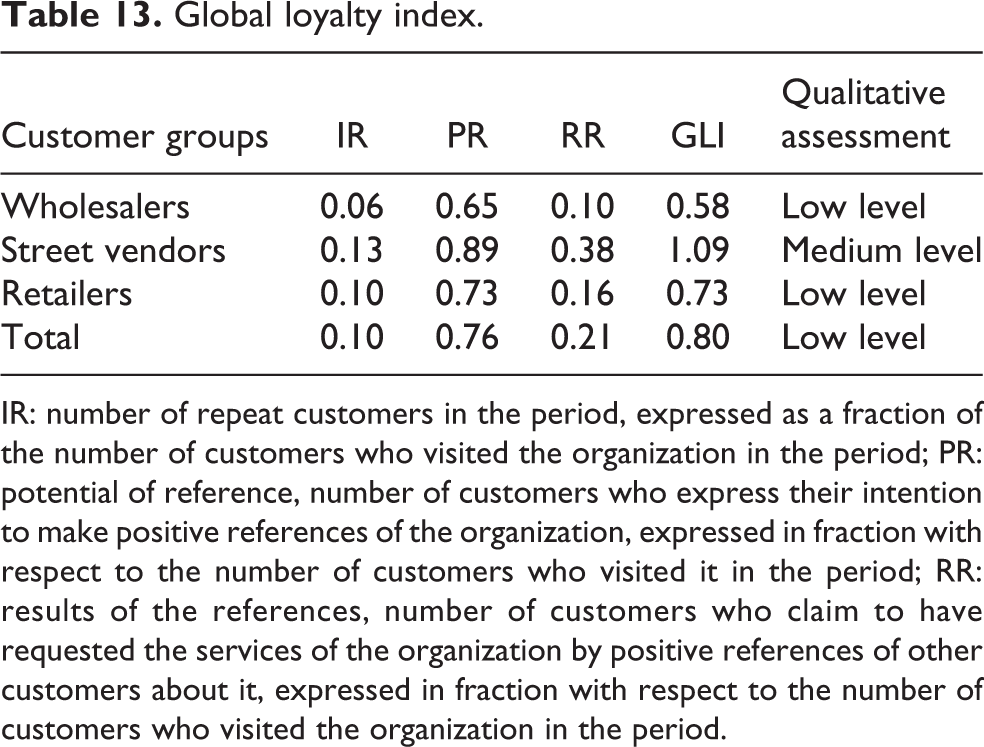
IR: number of repeat customers in the period, expressed as a fraction of the number of customers who visited the organization in the period; PR: potential of reference, number of customers who express their intention to make positive references of the organization, expressed in fraction with respect to the number of customers who visited it in the period; RR: results of the references, number of customers who claim to have requested the services of the organization by positive references of other customers about it, expressed in fraction with respect to the number of customers who visited the organization in the period.

Analysis of the QIAp
The key dimensions were determined from a group of experts of the organization, which defined what the dimensions and essential attributes that would be used and the weight that should be in each case (Table 14) were, ensuring that the expert opinion is reliable and consistent; then he proceeded to carry out audits on the processes by qualified personnel with the support of the checklists developed from these dimensions; the results allow to conclude that the value of the indicator (7.98) is insufficient for sales processes (see Table 15).
Expert judgment method.

Quantitative and qualitative evaluation of the quality of the sales process according to the results of internal audits.

Vi: valuations given to each essential attribute in the audits; Wei: weights of the dimensions, calculated according to Table 14; QIAd: quality index according to audit by each dimension, which is calculated as (average of Vi of each dimension) × Wei of each dimension; QIAp: quality index according to process audit, is calculated as: ∑ICAd.

Where ω is Kendall’s coefficient; N the number of experts, who were nine in this case; k the number of factors (dimensions), six in this case; Rj the sum of the valuations of judges to each factor; and Wei the calculated weight for each dimension.
In the analysis of each of the essential dimensions, there is similarity in relation to the critical dimensions associated with the staff, the offer, and to a lesser extent with the atmosphere, and in relation to the attributes, the greatest difficulties are centered on the speed of service, compliance with established standards, as well as the breadth of offerings according to expectations of customers, that is, the possibility of finding a greater variety of merchandise from different assortments, fundamentally.
Considering the current situation shows that the critical factors demonstrate a weakness in the company, as the negative results of these indicators cause the desired state of the client is not completely satisfactory, causing it to present an infidelity by the customer.
Determination of the factors that inhibit achieving higher levels of satisfaction external customers. After analyzing the current system status indicators, inhibiting factors that prevent the excellence of the service delivery process and which definitely you need to drive to improve organizational performance were determined.
As shown in Tables 10 to 12, in general, satisfaction organization averages 3.94 over 5, which is considered a moderate weight. Therefore, to achieve higher levels of satisfaction, it is necessary to improve the aspects that exist and can be treated in order to create a better customer experience critical attributes. Each of these results was the starting point for the analysis of possible alternative solutions to the problems identified, as detailed in the next phase.
Stage 5: Continuous improvement
Design and introduction of solution strategies
The design team developed the plan of action to intervene on the causes; these actions were classified by groups of attributes. The improvement actions were presented to management Bazar who approved the plan, setting priorities based on the impact on the results and the availability of budget.
Evaluation and control improvement projects
The implementation process of the projects prioritized improvements began, and internal feedback system was established to ensure the immediacy of information and the basis for continuous improvement.
Despite the short time of application, a second measurement of indicators was performed to analyze the progress with the changes that have been achieved so far. These results are shown in Table 16 and can observe the improvement, though discrete, experienced in the external customer satisfaction.
Behavior of indicators before and after the intervention.

L: low; M: medium; H: high; ▴, before; ▪, after.
Conclusions
As in many other fields of management, not always scientifically proven theoretical elements for large companies are always replicable for medium, small, and microenterprises. Santo Domingo is no exception, although there is a government vocation to improve the quality of service delivery; small and microenterprises in this region suffer from specific tools to achieve the commitment established.
The initial objective of the article was to meet the need to measure and execute pertinent actions aimed at raising the quality and satisfaction of the external customer in the commercial organizations of Santo Domingo, Ecuador.
The methodology proposed was part of a study of the external customer satisfaction of a local establishment that runs a path that starts from the socialization and involvement of the main actors to the proposal of improvement actions and their impact on satisfaction.
There are procedures for doing this but do it separately. 8 –10,20,24 The characteristics presented by the general procedure, with respect to its generalizing nature, seen from two angles, one by the fact of covering all types of customer and the other considering all the subprocesses that occur in the organization; its cyclical nature, coupled with the fact that each cycle of analysis is developed on the basis of qualitatively different and superior, as well as the great flexibility it has, confers advantages over other precedents.
The modeling of indicators that measure the degree of customer satisfaction and loyalty allows the focus of management actions toward the improvement of vital aspects of service performance, in accordance with its design and on the basis of scientific information that allows the substitution of intuition and the hunches of managers and enables them to make more appropriate and relevant decisions, from a much more comprehensive angle.
The specific procedure developed for projecting improvements in customer satisfaction levels allows the development of a coherent strategy to improve the levels of satisfaction of external customers and contributes to the gradual reduction of the gaps between expectations and performance perceptions of the service, as well as between the design and the performance, which represents, ultimately, an improvement of the quality of the service that is offered.
The measures implemented have led to important changes in the indicators of satisfaction, quality, and loyalty in the establishment studied; these results resemble those obtained by previous studies. 15,19,23,31,35 The comparison of the results before and after the changes commented with significant variations of the indicators used.
While it is true that the indicators improved, there are still problems that could be improved in the store and the remedy would result in a subsequent improvement of the indicators mentioned.
This manuscript uses a very particular way of approaching the problem of measurement and improvement of satisfaction and shows the results of a specific establishment, so that the application of the methodology requires an observation of the application context to make the adjustments in case of that is required.
An element to highlight the study, following previous studies, 19,23,26,33 is that it does not assume the same weights used to measure satisfaction, which allows an exact understanding of the level of satisfaction that exists and of those about which it is more convenient to act to improve it. In this sense, the use of expert methods and the AHP 29 is used to assign weights to each criterion, depending on the perceived importance of achieving external customer satisfaction. 18,25,27,30
This type of study can be a useful guide for business managers similar to the one studied who needs to know if the way in which they conduct their business allows an adequate level of satisfaction to their external customers and how to identify those elements that could contribute to the improvement of that which causes dissatisfaction.
Footnotes
Declaration of Conflicting Interests
The author(s) declared no potential conflicts of interest with respect to the research, authorship, and/or publication of this article.
Funding
The author(s) received no financial support for the research, authorship, and/or publication of this article.