
Abstract
We propose a novel method to improve the forecast of macroeconomic indicators based on social network and semantic analysis techniques. In particular, we explore variables extracted from the Global Database of Events, Language, and Tone, which monitors the world’s broadcast, print and web news. We investigate the locations and the countries involved in economic events (such as business or economic agreements), as well as the tone and the Goldstein scale of the news where the events are reported. We connect these elements to build three different social networks and to extract new network metrics, which prove their value in extending the predictive power of models only based on the inclusion of other economic or demographic indices. We find that the number of news, their tone, the network constraint of nations and their betweenness centrality oscillations are important predictors of the Gross Domestic Product per Capita and of the Business and Consumer Confidence indices.
Keywords
Introduction
Hamermesh, 1 in his study about the changing nature of economics research over the last six decades, found that in 1963 economic research was 50.7% theoretical and empirical research was negligible. In 2011, we saw an overturn, with empirical research reaching 64% and theoretical research dropping to 19%.
One of the main determinants of this shift is the larger quantity and variety of data that are now easily available, in connection to all different sorts of economic events. Data are now available in very large volumes, in both structured (organized and easily searchable) and unstructured formats. 2 To unveil the insights that can come from data analysis, many organizations recruited data scientists and established data analysis departments. Dutton 3 stated that we should move from the data driven organizations era towards the data driven culture. Similarly, Bizer et al. 4 showed that thanks to big data we have new approaches to solve old problems.
As regards news data, the collection process often comprised a deep search or manual extraction of paper documents. 5 Nowadays, computers and text mining algorithms 6 allow the extraction of many document-related variables. For example, how many times an article has been viewed, tweeted, liked, pinned or commented, the sentiment of its content, its appreciation, the number of readers per country and so on. Thus, we can use new variables, which probably carry new insights and useful information.
Simultaneously to the rise of data and web technologies, the study of network interactions – both within and outside firms – proved its importance. Positions and interaction dynamics in communication and business networks proved to be connected, for instance, to employees’ engagement and turnover intentions, 7 innovative capabilities of start-ups 8 or fraudulent activities. 9 An additional example is given by Shipilov and Li 10 who found that in corporate networks, higher centrality predicts higher market performance, while higher values of the network constraint are associated with a lower performance. The study of socio-economic networks is relevant to this research, which follows a social network analysis (SNA) approach 11 to determine which elements of these networks can contribute to the prediction of macroeconomic indicators. Socio-economic networks can offer a graphical representation of economic, political and social interactions. For example, they can be used to represent the way buyers and sellers interact in a market during the trade of goods and services, the diffusion of behaviours and opinions or the formation of commercial alliances. Recently, socio-economic networks evolved from just being able to illustrate patterns of connections among small individual groups, to represent large-scale, high-density statistical graphs, with millions of actors and links. 12
Past research on forecasting macroeconomic variables 13 –16 focused mainly on providing new mathematical and statistical forecasting techniques, examining small and large sets of data with varying degree of success. However, these forecasting models were mostly using other economic predictors – such as the gross domestic product (GDP) or inflation and interest rates – while ignoring network interactions dynamics.
In this context, we developed a novel approach based on the extraction of socio-economic networks from the content of news articles related to international business operations. We present an analysis of these networks with the purpose of demonstrating how SNA measures can help in forecasting the degree of optimism about the state of economy represented by the Consumer Confidence Index (CCI) and the Business Confidence Index (BCI) and the GDP per Capita (GDPCapita) of the 10 biggest economies in the Euro area. Our choice to predict those indexes has two main reasons: first, they are sensible indicators of the economic stability of a country, as they relate to the spending activity of consumers and to the investment activity of firms; second, journalism and news media can influence the opinion of both consumers and business managers. 17
With this study, we offer useful insights for scholars and economic analysts, who are interested in improving existing forecasting models of macroeconomic indicators. The novelty of our contribution mainly lies in the metrics we use, in the network mapping techniques we present and in the use of less explored data sources, such as the Global Database of Events, Language, and Tone (GDELT) database. Our metrics – extracted from data sources which are freely available and accessible in real time – are mostly meant to be integrated in other existing models to improve their accuracy. Our findings can also be partially relevant to policymakers supporting, for instance, the importance for a country to be more central in the economic networks we describe.
Forecasts of macroeconomic variables
Macroeconomic variables prediction has been a subject of interest in the academia since decades. 1 Many scholars tried to develop different models, which mostly included economic variables, to predict macroeconomic indicators at the country level. Sims 18 was among the first authors to test and propose a linear vector autoregression (VAR) model to forecast the US macroeconomic variables related to the business cycle fluctuations. The model provided good results for the in-sample forecast but a poor output for sample forecast because of a problem of overfitting. In a later study, Litterman 19 proposed the Bayesian VAR technique which solved the over fitting problem by reducing the VAR’s parameters. At the same time, King et al. 20 proposed a vector error correction model, which considered long run effects and stochastic trends as random walks, to constraint the VAR parameters. More recently, Gupta and Schaling 21 proposed an integrated model that combined the prementioned techniques in order to forecast the GDP and the interest rates of South Africa. Similarly, Kuzin et al. 22 forecasted the quarterly GDP growth for the Euro area.
Other models were developed to consider non-linear effects. Within this field, the self-exciting threshold autoregressive (SETAR) model 13 received a large attention. Cuaresma 23 used a two-regime (SETAR) process to estimate the quarterly GDP for 15 countries composing the European Union (EU). Feng and Liu 24 used the SETAR model in addition to an autoregressive integrated moving average model to forecast the Canadian GDP.
Despite the above-mentioned approaches showed good results, they were all efficient only for long-term forecasting, using long series of historical data. For the short-term forecasting, the academia got oriented towards the bridge equations (BEs). Several scholars 25 –28 tested the BEs approach as a method which could combine real and forecasted data for the nowcasting of the GDP in the Euro area.
With the significant growth of computational potentials, which allowed the reconsideration of many abandoned information, other forecasting techniques arose based on machine learning and text mining algorithms. Stock and Watson 29 proposed a dynamic factor model to estimate macroeconomic indexes of the US economy. Giannone et al. 30 proposed a factor model to evaluate the current-quarter real measure of the GDP growth rate. Their factor model was applied to a large data set of about 200 macroeconomic, financial and surveys indicators. Results showed that the use of those large data sets increased the forecast precision monotonically with each inclusion of new data. Schumacher 31 tested the forecasting performance of two alternative factor models, static and dynamic, based on large pools of Germany quarterly time series data.
In this research, we use a simpler approach based on multilevel regression, with the inclusion of a new set of mostly unexplored variables. With this approach, we can easily stress the predictive power of these new variables, as this is the main contribution of our research, together with the presentation of new network mapping techniques. To put it in other words, our objective is not to present a new set of final forecasting models but to give evidence to the role played by the new variables we discuss in the article. We maintain this metrics could be useful for scholars, as they could integrate them in other existing models, to improve their accuracy.
Using network analytics to improve economic forecasting
SNA received big attention on the last decade. Initially, mainly used in the field of sociology, the SNA approach was then implemented in many other fields including anthropology, psychology, epidemiology, politics, physics and economics. 32
In the economic field, one of the main reasons for this growth is the innovative support that SNA can offer in terms of producing new variables that help to improve existing models. Jackson 33 stated that recent interest in SNA mainly comes from the fact that the most classic economic analysis techniques have been pushed to the limit and they often fail in explaining the social circumstances observed during a certain economic phenomenon. Mizruchi and Stearns 34 applied SNA to investigate the management of uncertainty in evaluating potential transactions in a multinational leading commercial bank, particularly studying the means by which managers close transactions with corporate clients. They mapped the network of social relationships between bank employees at three locations and analysed how the network structure evolved under the conditions of uncertainty about the nature of a certain deal. Their findings are consistent with several studies 35 –37 and proved that the formation of sparse networks, in which weak ties are more dominant, can promote the access to diverse and non-redundant ideas; by contrast, too dense networks can lead to redundant knowledge and communications schemes. Similarly, Granovetter 38 studied the impact of social structures on economic outcomes, investigating speed of flow, quality of the information, mechanisms of reward and punishment and trust relationship in networks. He gave evidence to the contribute of network analysis in studying price fluctuations, behaviours of business groups, firms’ strategy and productivity and innovation in advanced economies.
Hidalgo et al. 39 investigated the network of relatedness between products, which they called ‘product space’, explaining one of the reasons why poor countries have more trouble to develop competitive exports and fail to reach the income levels of rich nations.
Garlaschelli et al. 40 constructed a directed weighted network representation of the world trade web (WTW) in order to capture the interplay between the dynamics of the GDP and the trade movements. They weighted each link (trade) according to the amount of wealth flowing from one actor (country) to the other and characterized each actor through its GDP value. Results showed that GDP values have a great influence on the evolution of WTW and vice versa, thus the probability of two countries being tightly connected is higher in the case of a similar level of GDP.
Our approach has some similarities with the above-mentioned studies with two main differences. First, we do not collect the available WTW data from online data banks: we use a novel approach to build interaction networks based on the analysis of the world’s news articles and broadcasts included in the GDELT database. Second, we build predictive models to assess the informative power of new SNA and news-related metrics, while making macroeconomic predictions.
Case study
The GDELT is an open-source repository of news articles, which are continuously updated and made available to researchers. The dataset includes news organized in more than 300 different categories of events, which took place since 1979. Kwak and An 41 called it a tale of the world. It connects a massive amount of data regarding persons, organizations, locations and events across the planet. The database relies on tens of thousands of broadcasts, print and online news sources from every corner of the globe. 42 In order to crawl such a large amount of data, we used the Google BigQuery (https://cloud.google.com/bigquery/) service, that is a platform provided by Google which allows fast queries (written using the standard SQL programming language) on very big datasets. The GDELT database is already connected with Google BigQuery, thus making it easily analysable.
The news data were collected on a daily basis for the period between 1 January 2010 and 31 March 2016. We filtered the news referred to business events involving firms operating in each country of the world, and we recorded the countries involved. The resulting dataset contained more than one million and seven hundred thousand entries.
We organized our analysis with the intent of building a model for the prediction of the GDP, BCI and CCI indices, for the top 10 EU countries (Germany, France, Italy, Spain, Netherlands, Belgium, Austria, Greece, Finland and Portugal). To obtain the dependent variables, we consulted the data bank of the intergovernmental Organisation for Economic Cooperation and Development. We could export the GDPCapita on quarterly basis, represented in thousands of US dollars, and the CCI and BCI which were available with a monthly frequency. Both confidence indices are based on responses to survey questions about the business conditions of a country and the likely developments in the months ahead. In the case of CCI, surveys are mainly administered to households and consumers to evaluate their current economic situation, their evaluation about the labour market and their expectations for the near future. The BCI is similar, but for this index surveys are administered to business managers, assessing their overview about the state of the economy and their optimism about the future of their organizations. The BCI survey assesses the enterprises state about production, stocks, current value and expected value in the near future. 43,44
Network extraction and graphing
On Google BigQuery, we searched for events included in the category of Conflict and Meditation Event Observations (CAMEO). Subsequently, we restricted the search criteria to business events in order to exclude other possible types of events that fall under the economic cooperation category, such as education, media, military and so on. In addition, we considered exclusively articles for which the following three variables could be clearly defined: (a) actor country code, (b) host country code and (c) action type code. These variables are described in Table 1.
Description of the variables extracted from GDELT.

GDELT: Global Database of Events, Language, and Tone; CAMEO: Conflict and Meditation Event Observations.
In our case study, each interaction had three actors involved: two contracting countries that were the two parties involved in each event and a host country where the event took place, with the possibility, for all countries, to play a multiple role. For instance, a German company could be a contractor in one transaction and the host in another one.
We analysed the data at three different levels: firstly, only considering the connections between contractors; secondly, including the location of the agreement; thirdly, combining the first two networks. Network construction techniques are shown in Figure 1. In each graph, the different countries were represented as nodes and the interactions among them as graph edges (linking pairs of nodes who interacted according to the rules described in the following).

Network construction techniques.
Interaction network
In this graph, we created links between the contracting countries, for each transaction, without considering the host country representation. For example, if a German firm makes an agreement with a Spanish one in Italy, the transaction will be represented by two nodes, Germany and Spain connected by a link, ignoring the role of Italy.
Location network
In this network, we stress the role of the host country, ignoring the link between the countries of the contractors. Using the same example, if a German firm makes an agreement with a Spanish one in Italy, the transaction will be represented with two ties: one connecting Italy to Germany and the other one connecting Italy to Spain. Accordingly, each transaction is represented by three nodes and two links. This network has a major role in the identification of relevant countries where business events take place.
Joint network
This final network is simply the combination of the previous two. Therefore, this network maps each transaction by three nodes and three links, connecting all parties involved in a transaction.
It is important to notice that even if our analysis is focused on 10 European countries, the above-mentioned networks comprise much more nodes (representing all the countries involved in economic events during the study period). This choice is vital to properly assess the role of the 10 analysed countries without losing information; accordingly, the social network metrics for the 10 nodes are calculated considering the full networks. The choice of separating the networks is not mandatory and we leave to the analyst the final decision. In our case, this choice is important for two reasons: it gives evidence to different network mapping techniques and to the flexibility that can be used while analysing relational data; it also allows to separate the contribution coming from different network metrics.
Independent and control variables
Network studies are often useful since the analysis of relational data can add informative power to the individual attributes of social units. 45 In this study, we considered well-known centrality measures, which are commonly used to assess the influence and positional power of nodes within networks. 45,46 In particular, centralities explain how strategic is the position of a certain actor in terms of connectivity and possibility of being in-between the patterns that keep together the other social actors. 47 Therefore, centralities express a tacit ranking of actors. Numerous centrality measures were developed and discussed in the previous literature. 48 In this study, we refer to some of the most common and widely accepted measure of degree centrality, betweenness centrality and closeness centrality. 47
Degree centrality
The degree centrality of a node is the number of edges which are connected to that node. 49 The degree centrality is interpreted by some researches as a density measure, because a high degree is representative of a high number of direct connections and often linked to higher activity levels. 50
Closeness centrality
Closeness centrality is a measure which defines how close a node is to all others, in terms of network distance. It does not depend only on the direct connections, but it also considers the indirect connections. It is calculated as the inverse of the distance of a node from all others. 45
Betweenness centrality
Similarly to closeness centrality, betweenness centrality is a path-dependent centrality measure. It measures how many times a node lies in the shortest paths that interconnect the other nodes (i.e. the paths that allow a connection between two generic nodes, passing through the minimum possible number of edges). The more in-between the node, the more relevant its social position. 45
Betweenness centrality oscillations
Betweenness centrality oscillations counts the number of significant changes in betweenness centrality, for each node, over specific time frames. If a node betweenness centrality remains rather constant, we observe no variations; on the other hand, if it reaches a local maxima or minima, we count this changes in position. 51 This measure has also been called ‘rotating leadership’ and proved to be an important proxy for the assessment of the innovation capabilities of individuals and firms. 8,52
Network constraint
The network constraint indicates the extent to which the direct links of a node are concentrated in groups of mutually connected peers or distributed to reach different groups of non-interconnected nodes. 53 Nodes with a more open ego-network have higher opportunities to mediate connections between peers, since they are less constrained by pre-existing links. Such positions proved to be related to positive performance evaluations, promotions and good ideas. 54 The value of network constraint is calculated as suggested by Burt. 55
Multiple edges between two nodes are possible, if the corresponding countries were involved together in more than one economic event. Before calculating the above-mentioned centrality measures, we replaced multiple edges with single edges, weighted with the number of interactions between each pair of countries.
With regard to the following measures, we collected, from the GDELT database, their daily values. Subsequently, we calculated their monthly average or sum, over the months included in our study period – to match the frequency of our dependent variables.
Number of articles
A quantitative measure calculated for each country, which counts the number of news which mentioned that country, in the occasion of a business event.
Average tone
The average tone is a numerical score that indicates the degree of positivity/negativity delivered by each news, calculated by means of text mining techniques, and already included in the GDELT database.
Goldstein scale
First introduced by Goldstein, 56 it is a scaling technique that assigns a score, from −10 to +10, to each type of event, capturing the likely impact that an event can have on the stability of a country, based on its type (a riot, for instance). 42 Also this measure was already included in the GDELT database.
Finally, we considered a set of control variables, which were commonly used in previous research when trying to make macroeconomic predictions. 57 –63 For the BCI and CCI, we used the nominal GDP, inflation rates and interest rates as control variables. For the GDPCapita, we used the inflation and interest rates and the country population.
We carried out an explorative study to test the relevance of the above-mentioned variables to make macroeconomic predictions. From previous studies, we got suggestions to think that social actors with more dynamic network positions (higher betweenness centrality oscillations) could better perform in business operations. 8 Moreover, one could also expect that activity and sentiment can influence the CCI 17 and BCI 64 and ultimately the GDPCapita. 65
Results
Table 2 shows the correlation coefficients for each of the study variables for all the networks. These primary results fully support our idea that SNA can help explaining macroeconomic indicators.
Correlation coefficients.
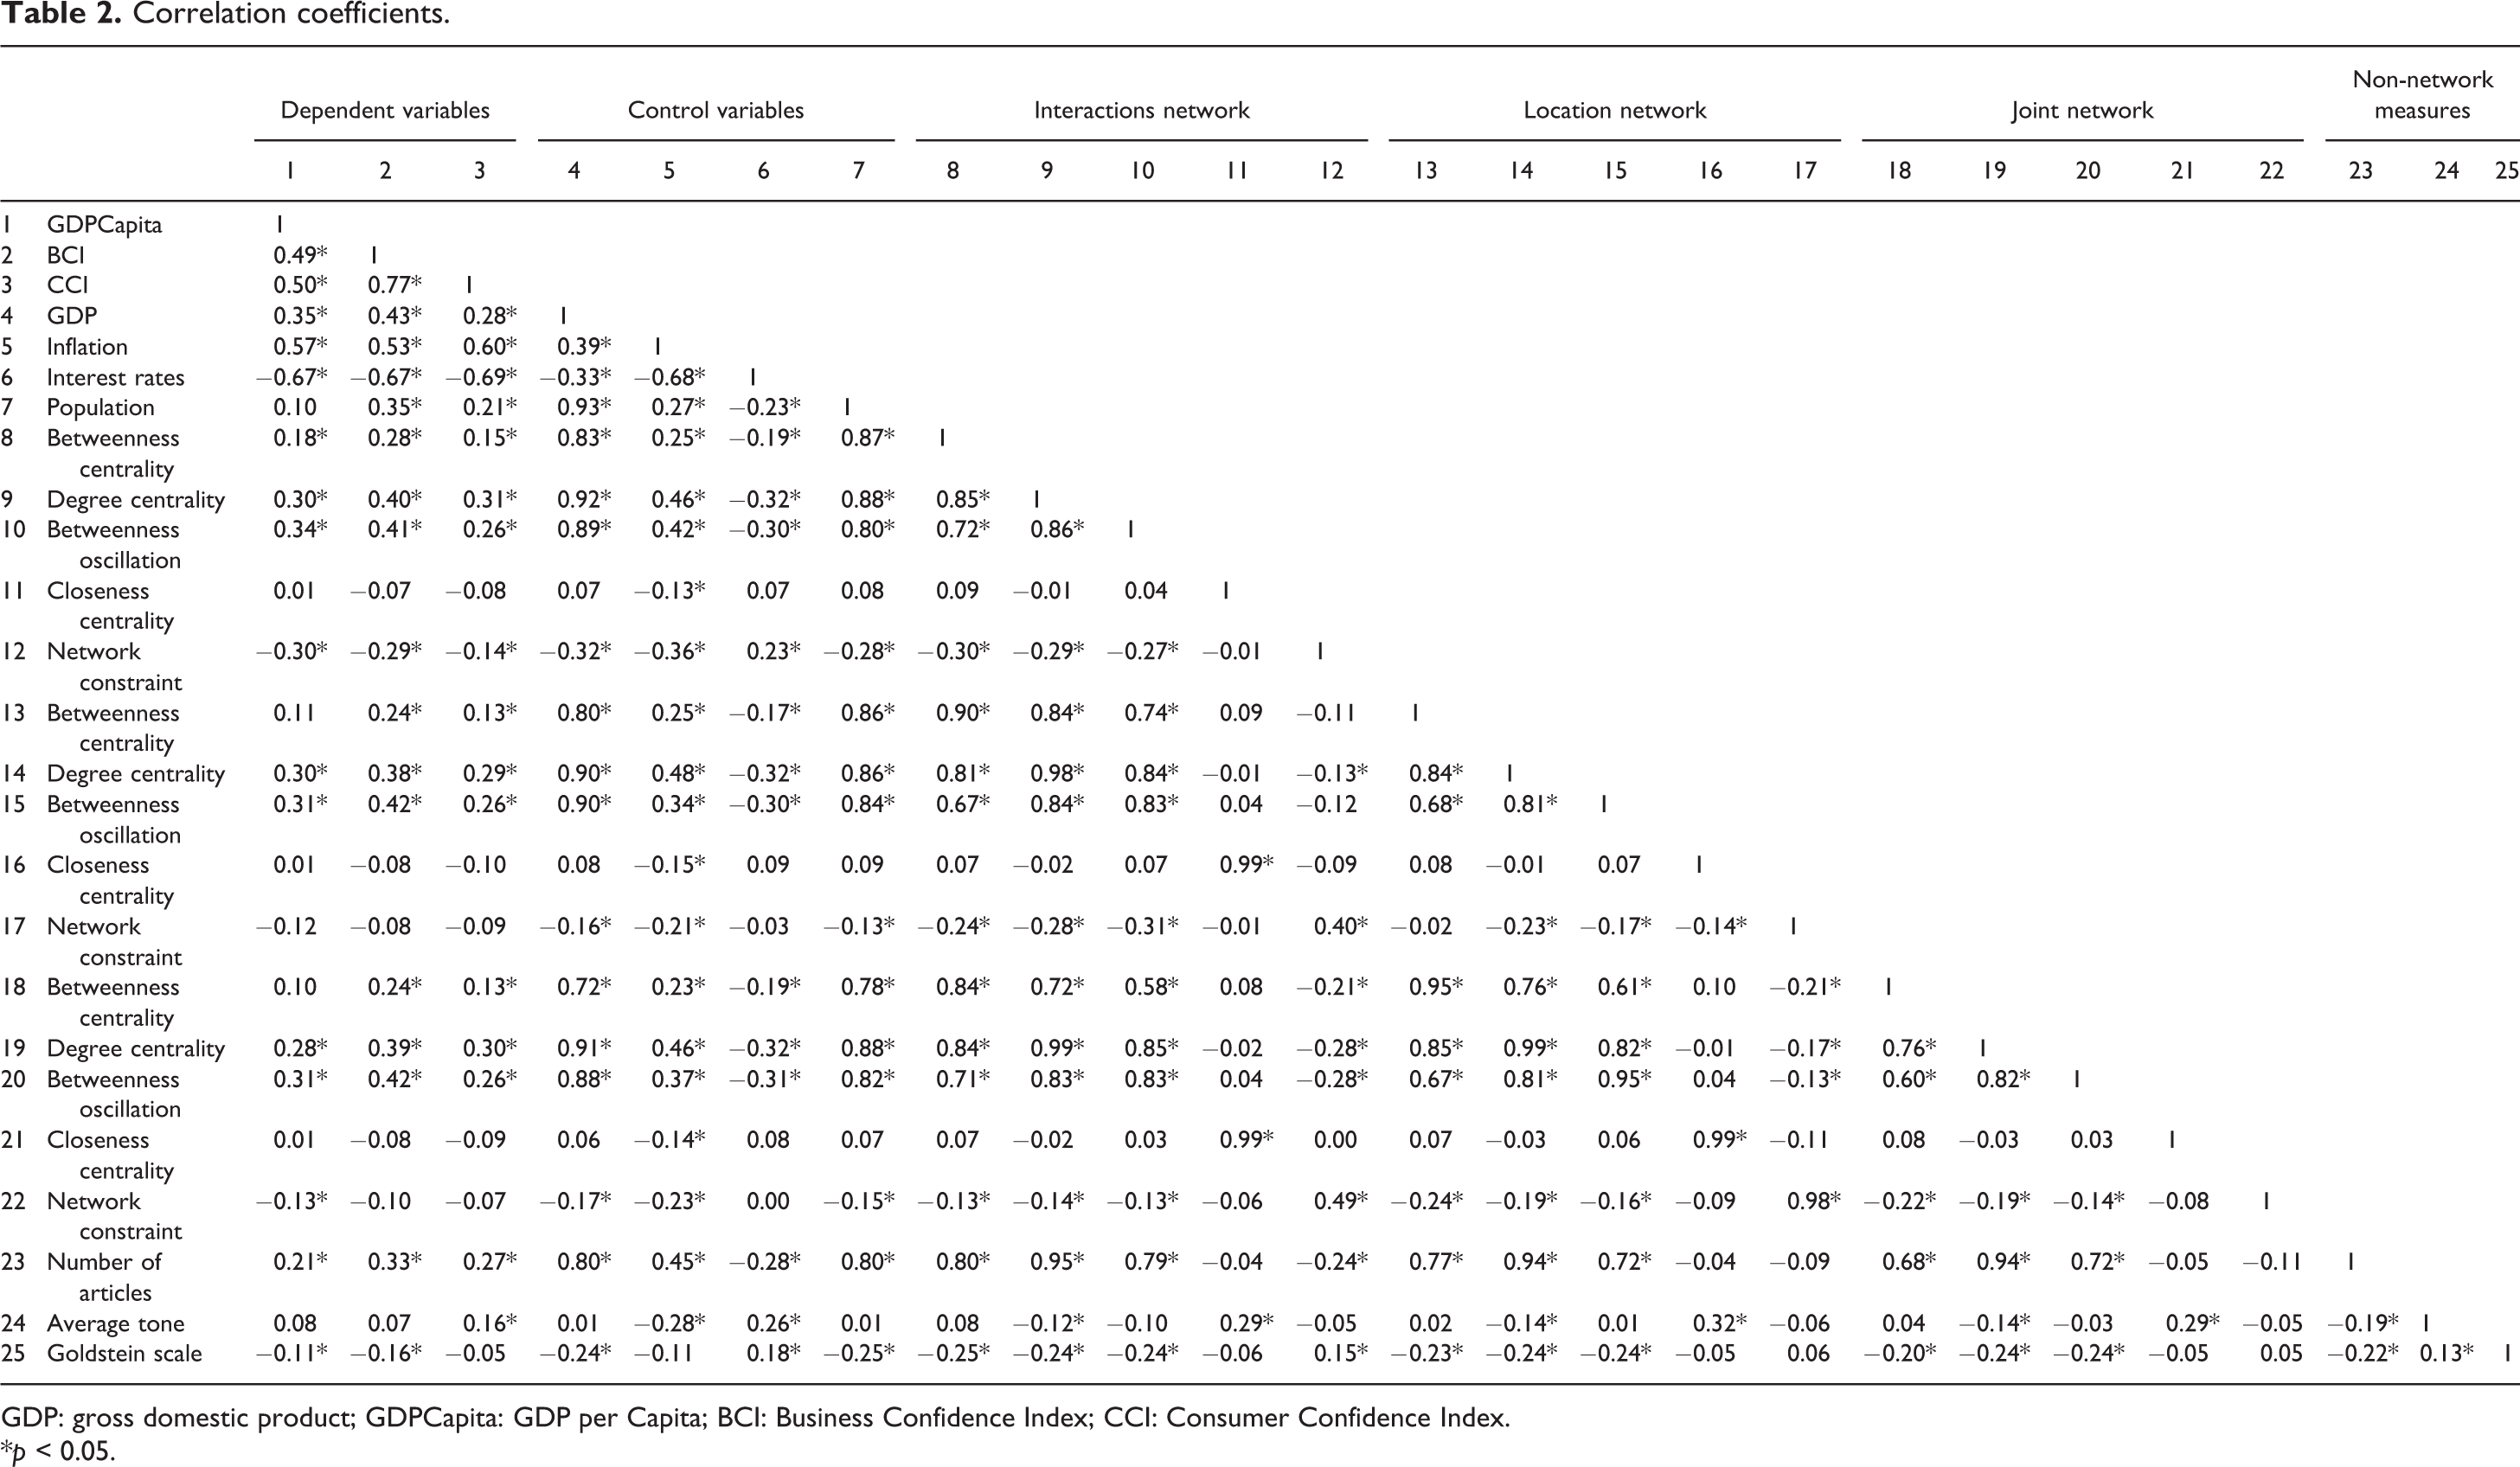
GDP: gross domestic product; GDPCapita: GDP per Capita; BCI: Business Confidence Index; CCI: Consumer Confidence Index.
*p < 0.05.
Degree centrality shows a strong positive association for all the three macroeconomic variables in all the networks. This seems to suggest that more economic interactions with different parties are a healthy indicator for a national economy. Betweenness centrality shows a positive association with the GDPCapita in the interaction network and with the BCI and CCI in all the graphs. It seems that the more a country is in the economic paths that interconnect the other countries, the higher its GDP and the confidence levels expressed by businesses and consumers. By contrast, closeness centrality does not show any significant association with the dependent variables: this might be due to the relatively small size of these networks and to the possibility for most nodes to quickly reach the others, with short paths. As regards betweenness oscillations, this seems to be one of the most important predictors, being positively and significantly associated with all the indicators, in all networks. Lastly, the network constraint is negatively associated with our dependent variables in the interaction networks. This finding is consistent with the idea that a more open, less constrained, network position can be beneficial to business interactions. 55
Looking at the other metrics extracted from GDELT, we see that the number of news articles referred to a specific country are positively associated with its GDP, BCI and CCI. It seems that this relationship still holds, regardless of the average tone used in the articles. In fact, we found no significant association of tone with GDPCapita and BCI; the only exception is for CCI, where we find a positive link of the tone with the consumers’ optimism. Finally, the Goldstein scale showed a negative association with the GDPCapita and the BCI. Additionally, results showed significant correlation between the control variables and almost all the social network measures, implying that those variables could be considered as potential predictors even for the GDP, inflation and interest rates. To expand our findings, we implemented the multilevel regression models presented in Tables 3, 4 and 5. We used these models as they allow varying intercepts across countries, as well as to distinguish the proportion of variance which is attributable to the differences at a country level. We refer to the work of Nezlek 66 and to other well-known studies 67,68 for a better description of the potentialities of these models. We also tested the inclusion of random slopes, without obtaining better results. Additionally, we tried including lagged predictors in our models, with no improvements in this specific sample.
Predicting the BCI: Multilevel regression results.

AIC: Akaike information criterion; BCI: Business Confidence Index; BIC: Bayesian information criterion; GDP: gross domestic product; ICC: intraclass correlation coefficient.
*p < 0.05.
Predicting the CCI: Multilevel regression results.

CCI: Consumer Confidence Index; GDP: gross domestic product; ICC: intraclass correlation coefficient.
*p < 0.05.
Predicting the GDPCapita: Multilevel regression results.
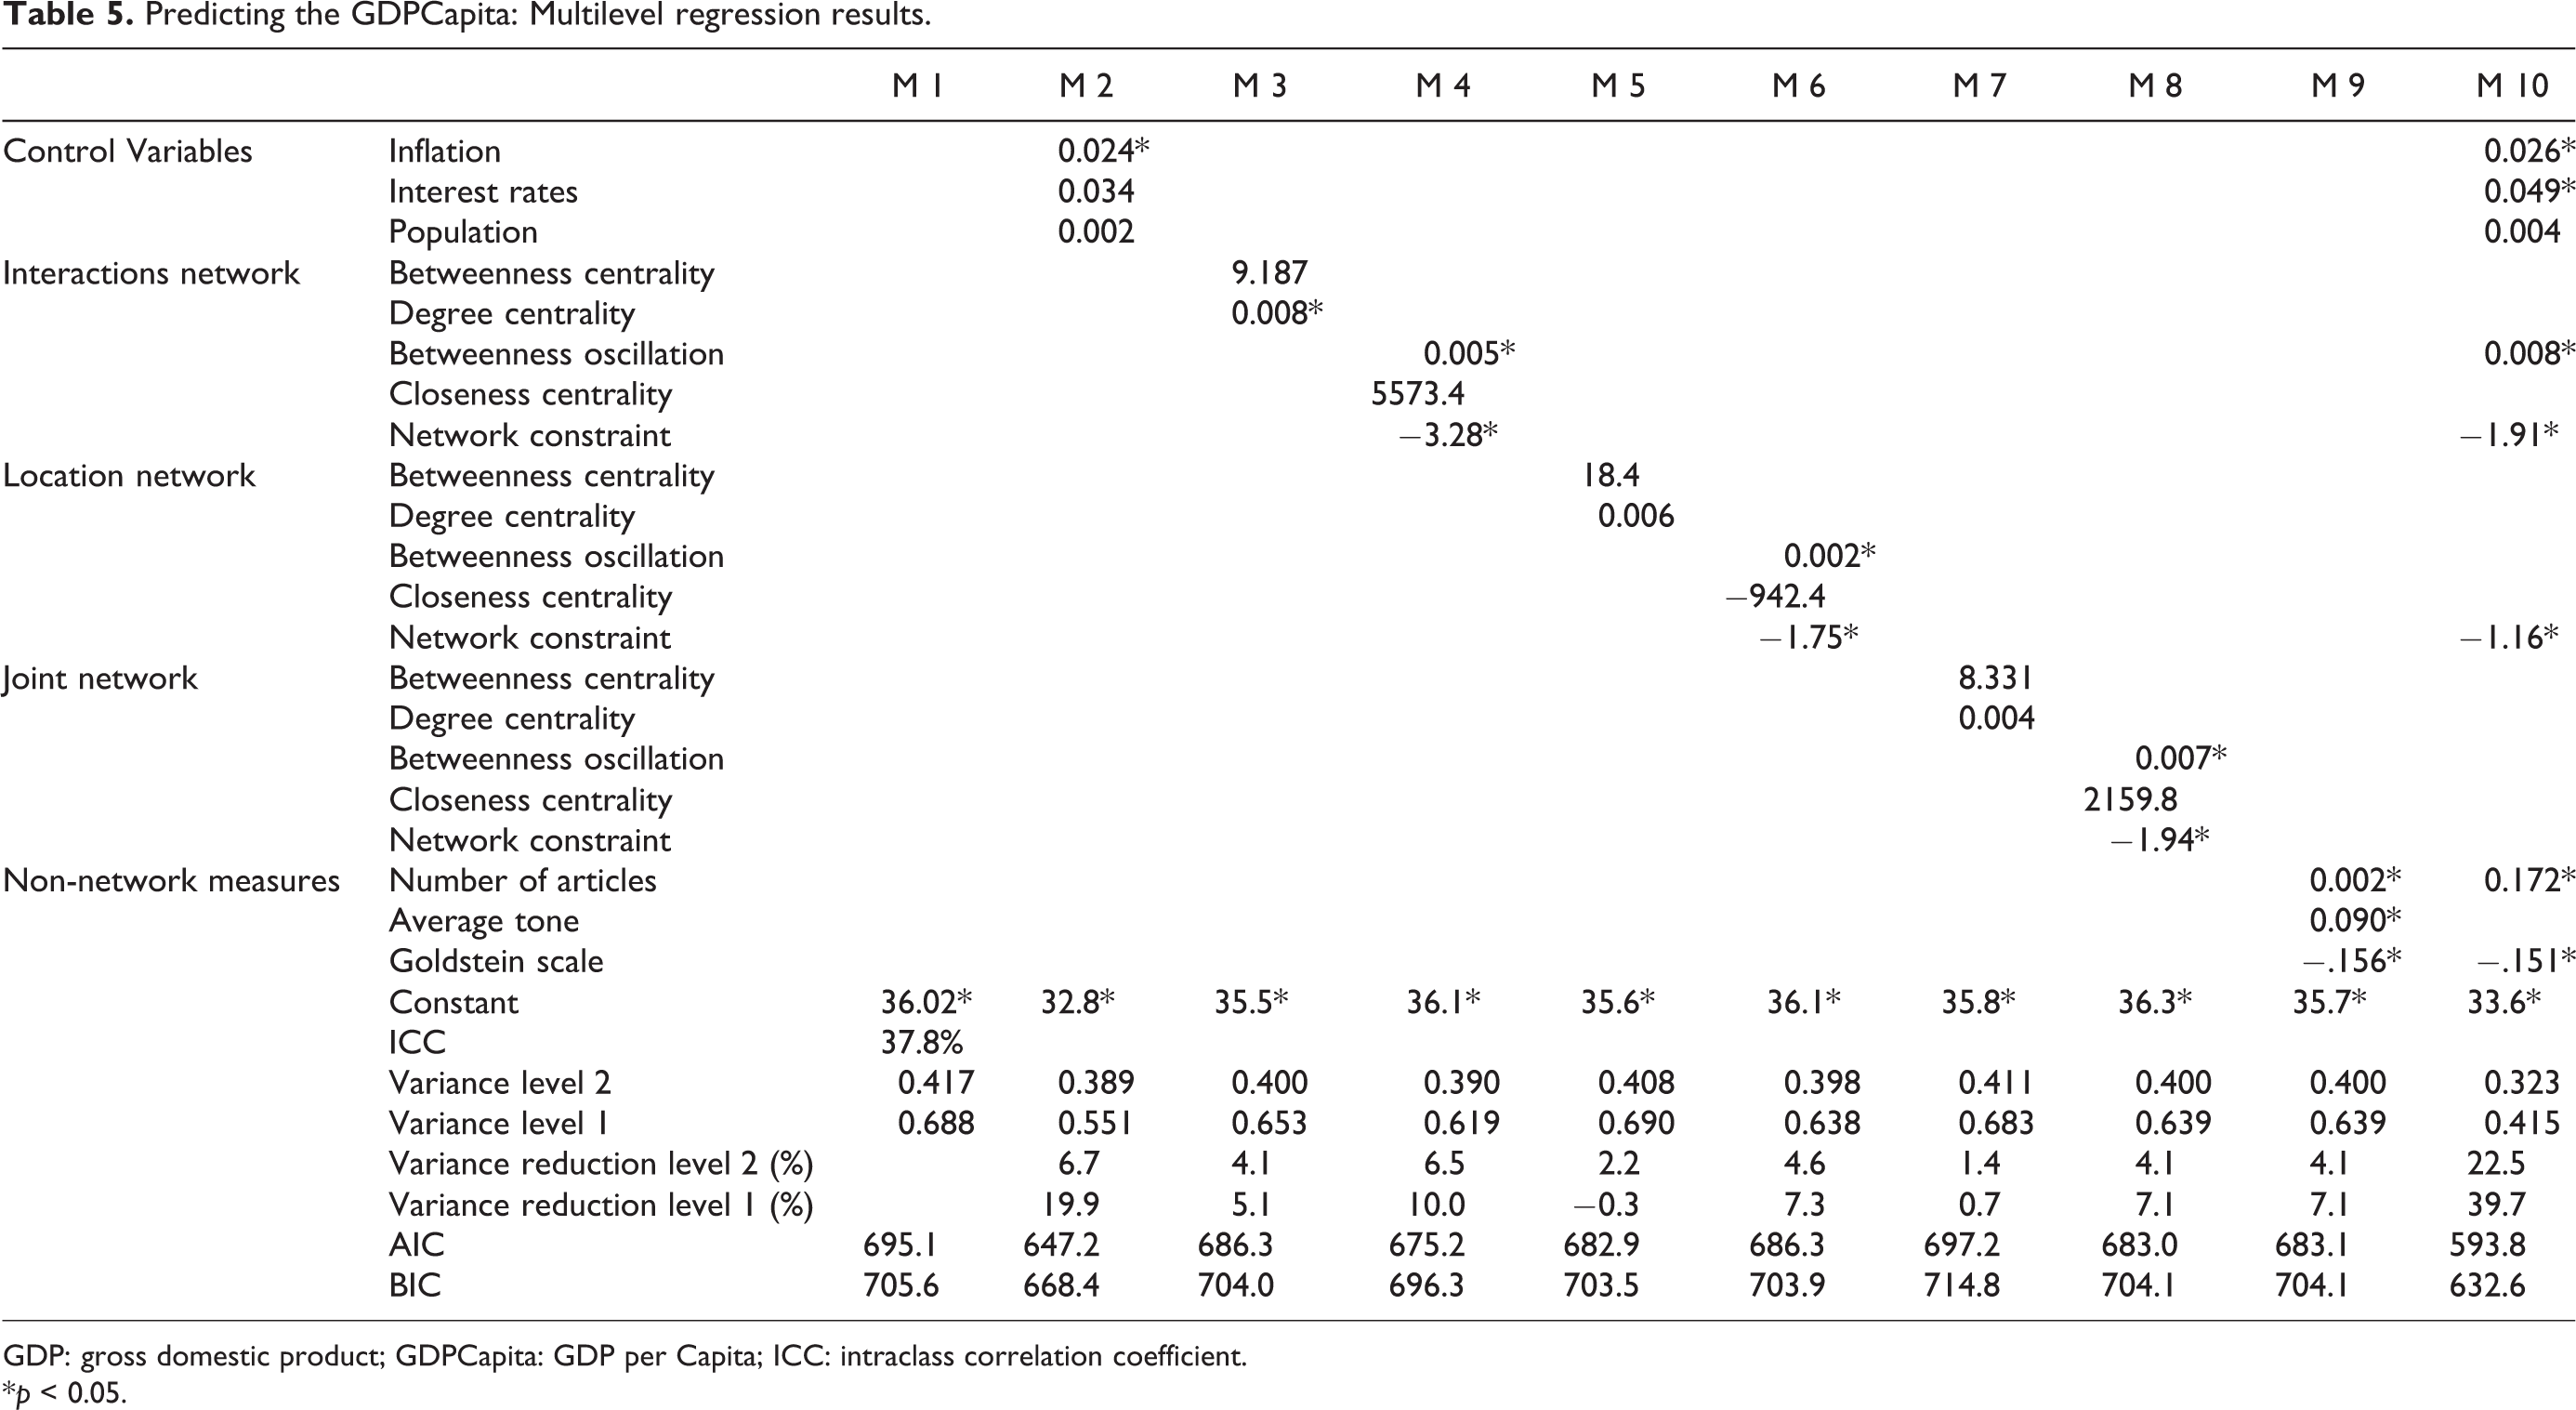
GDP: gross domestic product; GDPCapita: GDP per Capita; ICC: intraclass correlation coefficient.
*p < 0.05.
We built our models grouping repeated observations over time (level 1) by country (level 2). We tested our independent variables in blocks, avoiding to put together those metrics for which we identified collinearity problems. For each dependent variable, we started by running an empty model with no predictors, in order to measure the intraclass correlation coefficient (ICC). 66 Subsequently, we ran further models to assess the predictive power of each block on its own, then all the significant predictors were tested together in a final model, for the evaluation of the variance reductions. The ICC is 46.4%, 39.5% and 37.8% for the BCI, CCI and GDPCapita, respectively, indicating that at least one-third of each sample variance depends on differences at the country level. The models show that each macroeconomic variable can be better predicted by a specific set of independent variables. Specifically, betweenness oscillation in the location network and the average tone can help explaining the variance of BCI. CCI, on the other hand, seems to be more affected by the betweenness oscillations of countries in the interaction network, by the number of news and by the value of network constraint in the joint graph. Lastly, the GDPCapita can be predicted with the inclusion of a larger set of significant metrics, with consequently larger variance reductions: betweenness oscillations and network constraint in the interaction network, network constraint in the location network, number of articles and the Goldstein index.
Overall, the inclusion of the variables we proposed allowed a fair improvement of the predictive models, when compared with the empty models and with the models which just comprised the control variables.
Discussion and conclusions
In this study, we gave evidence to the informative power of novel metrics coming from SNA, while making economic predictions. In particular, we crawled the GDELT database, considering a 6-year period, to obtain useful data about news and world’s broadcasts, related to economic events, which we converted into three network graphs. In order to build these graphs, we analysed the economic events which involved each nation in the world. As a second step, we built forecasting models to try predicting the GDPCapita, the CCI and the BCI, for the top 10 economies in the EU.
We propose a novel approach which combines network analysis and news-related variables (such as their volume and tone), offering new metrics that can be easily integrated in other existing predictive models, with the aim of improving their accuracy.
We find that the BCI is partially explained by the betweenness centrality oscillations of a nation and by the tone of the news referred to the economic events that involved that nation. The CCI, mostly dependent on consumers’ perception, can be partially predicted considering a country betweenness oscillations, network constraint and number of mentions in economic news. Similarly, the GDPCapita seems to be affected by a country network constraint, oscillations in betweenness centrality, number of news articles and their Goldstein index. We also find additional evidence that the BCI and CCI are good predictors of the GDP, which is consistent with previous studies. 59,69,70
The findings of our research are consistent with other previous studies which support the value of the information extracted from new online platforms, such as GDELT. 71 Our research is also partially linked to the literature focused on the relationship between network structures and innovation capabilities. 72 This study, mainly explorative, has several limitations, mostly related to the process of news data collection. The events in the GDELT database are classified according to the CAMEO data book: it might be the case that we missed some economic events, for example connected to the education sector, or sometimes not classified as business events. In addition, some events might be discussed in a larger number of news whereas other neglected, depending on the strategies adopted by different newspapers or news agencies. It could also happen that a specific event is discussed in some news, after a long time from its first occurrence. Consistently, new data cleaning strategies could be tested to see if our findings can be further improved. We also suggest to test our method on different datasets (considering, e.g., the economies outside the EU). Lastly, we suggest to retest the effects of lagged predictors. This could help avoiding possible biases attributable to reverse causality. In this study, we neither aimed at proving causality nor at discussing the effects of predictors at various lags; we were mostly interested in giving evidence to the potentials of the new presented variables. An investigation of the time taken by economic news and agreements to impact the CCI, BCI and GDP could be the objective of future research. Accordingly, we advocate further studies based on more structured causal designs, which could be helpful for policymakers to understand both the impact of economic news and agreements on macroeconomic indicators and the advantages of maintaining central positions in economic networks.
Footnotes
Authors’ note
Mohammed Elshendy and Andrea Fronzetti Colladon contributed equally to this work.
Declaration of Conflicting Interests
The author(s) declared no potential conflicts of interest with respect to the research, authorship, and/or publication of this article.
Funding
The author(s) received no financial support for the research, authorship, and/or publication of this article.