
Abstract
Energy-efficient housing is a product that integrates various stakeholders’ tasks throughout the different stages of its life cycle. The relationships between these stakeholders impact on the degree of knowledge sharing and informed decision-making and can potentially enhance or lower the energy efficiency of the product – the house. This article uses a social network analysis (SNA) approach to visualize the social networks of the stakeholders of a number of owner-occupied housing case studies in Australia. The aim is to analyse, contrast and quantify the degrees of connectivity and centrality of the housing stakeholders to identify which groups have more connectivity in the stakeholders’ network of energy-efficiency housing and consequently more potential to influence the energy efficiency outcomes and which practices are more likely to enhance transparency and information sharing that is essential for producing energy-efficient housing.
Keywords
Introduction
Despite the rising global awareness of the necessity of conservation of operational and embodied energy, and the technological advances in the field of energy-efficient construction, achieving energy efficiency outcomes is still limited by many economical, regulatory, cultural and social issues. Overcoming these limitations faces many challenges, including the construction industry’s multidisciplinary, multistage and fragmented nature that comprises a culture of blame, opportunistic behaviours, conflicting interests and lack of cooperation. 1 –7
The conflicting nature of the construction industry contradicts the notion of an energy-efficient house as an integrated product that requires the collaboration, enhanced communication and knowledge exchange between the construction industry’s multiple stakeholders. This integration is important since energy efficiency is heavily influenced by the decisions made by the stakeholders throughout the housing production life cycle. 1,2,5,8 –10 Each stakeholder’s decisions can potentially be influenced by other stakeholders in the same communication network. 1,9,11 –13 A network that ties the stakeholders together could facilitate the flow of information, enhance transparency, minimize risks and potentially lead to better energy performance. 1,7,9,14,15
A stakeholder management approach to enhance energy efficiency outcomes
In order to better develop energy efficiency outcomes, it is important to identify how stakeholders influence each other’s decisions and how they impact energy efficiency outcomes. It is also crucial to know each stakeholder’s interest and understand the degree to which they value enhancing energy efficiency so that a strategy can be tailored to fit these interests and maximize energy efficiency benefits. 2,16
The authors have previously suggested a stakeholder management approach could be used to identify the importance/influence of the role played by each stakeholder in regard to enhancing energy efficiency in housing. Project managers and policy makers could then follow an ‘instrumentalist’ approach that prioritizes and fulfils stakeholders’ interests based on the degree of influence they might have on project/activity outcomes. 17 –20
The importance of integrating social network analysis with stakeholder management
The limitation of the stakeholder management approach, however, is that it focuses more on the relations between stakeholders and the central organization following Freeman’s theory, 21 with little attention payed to the relationships between stakeholders and the degree they influence each other’s decisions which consequently might influence the organization’s outcomes. 9,11 Rowley argues that stakeholders are not always directly linked to an organization: Some stakeholders could be linked to the organization through other (bridge) stakeholders. 12
This limitation led to the acknowledgement of the importance of an in-depth analysis of stakeholders’ relationships by a number of researchers. 11,12,22 –25 These researchers suggested using social network analysis (SNA) to examine how the stakeholder network structure and the position of each stakeholder within this structure could influence the organization.
Social network analysis
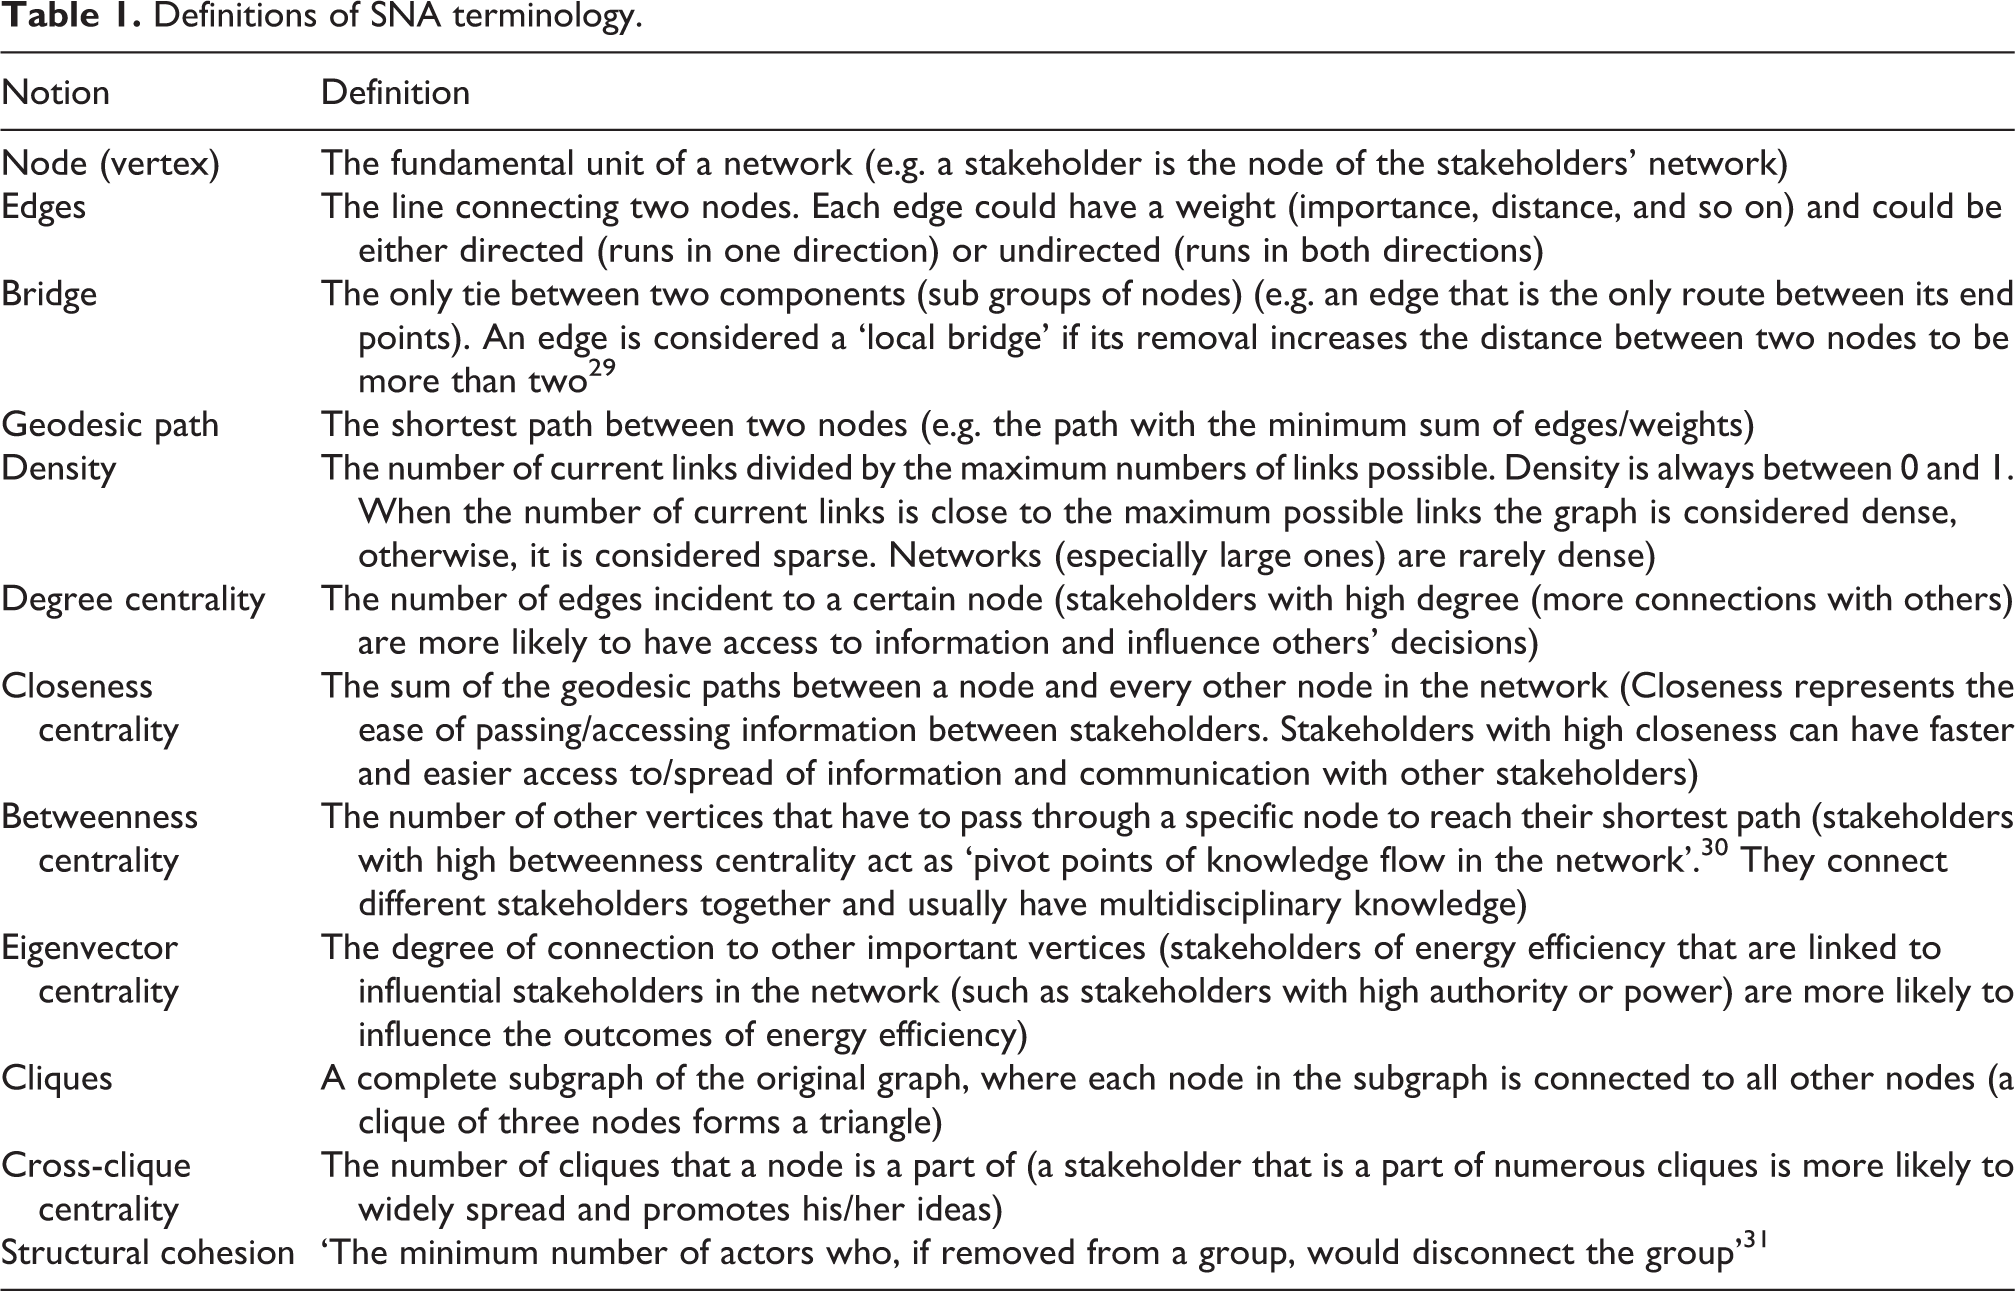
Social network analysis is a strategy for investigating the degree of influence (using centrality metrics) of each actor within a network, how they can impact each other’s behaviours and the level of connectedness, cohesion and clustering within the network as a whole. 25,26 The analysis of the network structure is done following graph theory and social network notions such as the ones defined in Table 1. 25,27 –31 Stakeholders with high centrality aspects are more likely to influence others and have higher power within the network.
Definitions of SNA terminology.
Combining SNA and stakeholder management
One of the traditional methods of analysing stakeholder is to prioritize their influence on the outcomes of a certain organization/activity, based on their possession of certain attributes (such as power, legitimacy, urgency, knowledge, interest, and so on). 32 –34 SNA presents another approach of identifying the degree of stakeholders’ influence based on their centrality metrics and position within a network.
Yang et al. compared the influence of stakeholders resulting from each approach separately. The results of both approaches yielded very similar outcomes. 24 Treating the two approaches separately, however, is contradicted by a number of researchers who consider SNA as an approach that should be linked to the stakeholder management process to complement its results, rather than one that produces new comparable results. 11,12,22,23,25
Rowley argues that the link between stakeholder theories and SNA is evident since an organization’s behaviour and resistance to its stakeholders’ demands is influenced by the density of its stakeholders’ network and their location within that network. This is due to (i) the ease of information exchange that increases as the network becomes denser and (ii) the spread of shared norms, behaviours and expectations across the network, which makes it harder for organizations to isolate groups, withhold information or form alliances with specific parties against others. 12 Alternatively, Pajunen made the link through using SNA as one dimension of a matrix that combines stakeholders’ network position and their resources dependency to identify their influence on an organization. 35
Combining SNA with the traditional prioritization approach could present more accurate representation of stakeholders’ influence than what the traditional approach could present by itself. 11,25 Understanding and strengthening this network using SNA could build trust; ensure flow of information and collaboration; maximize the potentials of each stakeholder and minimize the culture of blame; minimize marginalization and represent diverse interests; and result in whole-system innovative solutions that benefit all stakeholders. 11,22 In contrast to the ‘benefits-for-all’ approach, Pajunen claims it can be used as a part of an instrumentalist approach that is applied during corporate decline to identify and accommodate the critical stakeholders (who are essential for organizational survival) and follow ‘a strategy of defence’ with the non-critical ones. 35
The need to integrate SNA with classic project management strategies (that measure success based on the ‘time, cost and quality’ criteria) is also acknowledged in the construction industry. 23 –25,36 This integration could act as a way to enhance knowledge sharing, trust and collaboration. Combining the social and classical approach could overcome the complex instable nature of the construction industry and help achieve the project outcomes and stakeholders’ interest as a part of a more holistic triple bottom-line approach. 23 –25,36 It could also identify the impact of each stakeholder on the project, including those who have limited power but could still influence powerful stakeholders. Identifying influence on the project and on other stakeholder can facilitate following an instrumentalist approach when needed. 24
Previous research by the authors acknowledged the importance of communication and enhanced relationships as a source of power when analysing stakeholders using the stakeholder circle. Stakeholder circle is a stakeholder management tool that classifies and prioritizes stakeholders’ importance based on their influence and sets an engagement and monitoring plan accordingly. The tool generates an influence index for each stakeholder based on three attributes: (i) their power, (ii) proximity (closeness to the organization) and (iii) urgency (based on the value they have for the organization outcomes and the actions they are willing to take for these outcomes). 37 –40 There is, however, still room for more in-depth analysis that could be done on the influence attributes, to include the degree of influence that results from having a strong network of relationships.
This article highlights the impact that stakeholders’ connectivity has on the potential to influence energy efficiency of housing. It aims to answer two questions as an initial step for analysing stakeholders’ influence: Which stakeholder groups have more connectivity in the stakeholders’ network of energy-efficient housing? Which practices are more likely to enhance transparency and information sharing that is essential for producing energy-efficient housing?
This article will apply SNA on a number of case studies to identify the most central stakeholders of housing. These results could then be included in future research in a broader analysis using stakeholder management approaches to identify the most influential stakeholders during the procurement of energy-efficient housing.
Application on case studies
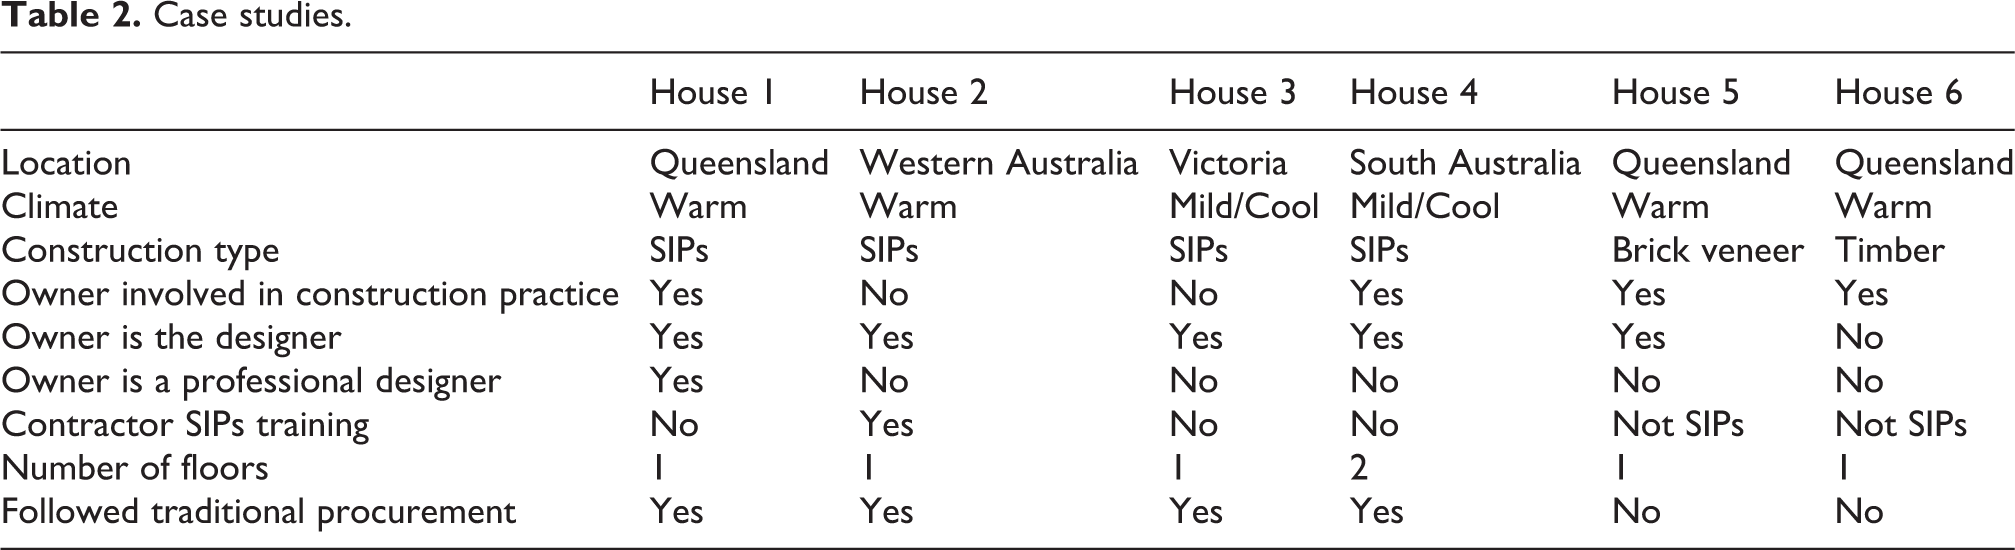
SNA principles are used in analysing six energy-efficient housing case studies (Table 2), as a demonstration of how SNA can contribute to the identification of stakeholders’ contrasting influences on the production of energy-efficient housing. All of the case studies are for owner-occupied, energy-efficient houses (that were initiated by the owner) in various locations and climates in Australia, four of which are constructed with structural insulated panels (SIP).
Case studies.
Semistructured interviews were conducted with each case study owner and main contractor. Interviewees were asked questions about the process of procurement they have followed, the degree of ease of accessing information and the main motives/goals for building an energy-efficient house. The weighting of the edges between each pair of stakeholders was quantified based on two aspects: the ease of reaching information and the common interests/goals (for instance, the common goal of the regulator, certifier and engineer is to ensure compliance with the regulation). The degree of shared interest and ease of communication were either quantified based on the answers of the interviewees or were inferred based on the common practice of stakeholders who were not interviewed. At this stage of the research, the assigned weights are arbitrary. For instance, stakeholders with the same goals who communicated easily have an edge weight of 0.5, stakeholders who communicated easily but do not have the same goals have an edge weight of 1 and stakeholders who do not share the same goals of energy efficiency and who had a hard time communicating have a weight of 1.5. However, further research should quantify the degrees and ease of communication more accurately through the collection of qualitative and quantitative data (e.g. means of communication, number of e-mails sent, duration of response, direct reach of information, availability of information hubs, and so on).
Each interviewee was given a stakeholder’s network template based on past mapping of Australian housing’s stakeholders. 1 It shows the links between stakeholders in pale lines, and each interviewee was asked to draw the links they had with other stakeholders throughout the project’s different stages. The connections between the other stakeholders were identified using either the information supplied by the interviewees or through assumptions based on the common practice of housing in Australia (such as the relations between the building certifier, regulator and engineer).
All the edges in this study are undirected, since the main aim is to identify the degree of communication/links between stakeholders regardless of the type or direction of information flow between them. The data gathered were used to generate a stakeholder network for each case study (Figure 1) using Gephi network analysis and visualization software. Gephi is open source software that has been used by a number of researchers to analyse networks in various fields such as construction management, animal behaviour, social media and politics. 41 –45

Case studies networks.
Classifying the case studies’ stakeholders
Classifying stakeholders is an important step of stakeholder management. Many researchers categorized stakeholders into groups based on either their relationship with the organization (e.g. internal or external, primary or secondary, and so on) 21,46 or on the role they play within that organization (controller, executor, advisor, stakekeepers, stakewatchers, legal authority, and so on). 2,47,48 Zedan and Miller modified Bourne’s four categories (Table 3) to categorize energy efficiency stakeholders based on the role they play in enhancing/decreasing energy efficiency of housing. Table 3 shows how the discussed case study stakeholders are classified under Bourne’s four categories (based on relationship with the project) and the classifications made by Zedan and Miller (based on the role stakeholders play within the project). 2,38
Categories of case studies’ stakeholders.

Case studies’ networks
The responsibilities and sequence of communication between stakeholders varies between the case studies. Houses 1, 2, 3 and 4 followed the traditional procurement process, where the owner finalizes the designs/tender documents (sometimes with the aid of an architect, building designer or draftsperson) then contracts a main building contractor for the site execution (in many cases the contractor is even in charge of supplying the designs along with the site execution). Houses 5 and 6 were different from the traditional procurement process, since both owners acted as the contractor and were in charge of the site execution directly, which enhanced the link between the design and construction phases.
These communications are reflected in the networks in Figure 1 which illustrate the connections made between the stakeholders throughout the design and construction stages and shows which stakeholders had more potential of passing information. For instance, the owner occupier of house 1 (who is an architect) created the design, contacted the SIPs supplier to develop the design based on the panels dimensions and then handed the developed design to the draftsperson to produce the drawings. The owner then contracted the contractor who was in charge of obtaining all permits and building certificates from the regulating authority (the local council) in addition to contracting all the trades and suppliers during the construction phase. This made the main contractor the only bridge between the design phase and the certification/construction phase as illustrated in Figure 1(a).
Houses 2 and 3 were also designed by the owner occupiers (based on information from the SIPs supplier) with the help of the draftsperson who was in charge of finalizing the certified drawings with the council. The contractor communicated with all the trades and suppliers during the construction phase, making him the only link (bridge) between the design stage stakeholders and the construction stakeholders as well as the only person responsible for onsite execution work (Figure 1(b)). The contractors in houses 2 and 3 were recommended to the owners through the SIPs supplier (which explains the link between the SIPs supplier and the contractors).
The owner occupiers of house 4 had more connections with other stakeholders during the design and construction phases of the house due to their involvement in the construction business. The network (Figure 1(c)) shows that the owners were in charge of the design, getting the certifications, contacting the suppliers and trades and supervising them. The labourers in this case study were the only stakeholders who were not directly connected to the owners, since they were hired and supervised by the contractor.
House 5 has the least number of stakeholders compared to other case studies since it is an already existing house. The retrofitting was done to the house by its owner, to make it more energy efficient through the implementation of recommendations based on simulations done by the university. The owner in this case has contacted all the trades, instructed and supervised them, making him the central hub of communication between all the other stakeholders (Figure 1(d)).
The owner/contractor of house 6 included few extra stakeholders who are not usually a part of the common practice such as the service providers and the media. The network of this case study is denser (or less sparse) than the other networks (Table 4), due to the owner/contractor attention to bringing together a number of stakeholders (the regulator, service provider, subcontractor, designer, local university and suppliers) into one room to enhance their communication and to discuss the possible developments of energy-efficient housing construction that could be implemented in the case study house.
Case studies network density.

In all the case studies, the regulator, certifier and engineer form a clique (where every stakeholder is connected to all the others). This clique occurs during the certification phase of all the projects. The clique is a constant in all case studies since it is a necessary procedure in the Australian construction practice and hence does not reflect any preferences to a specific case study. Its significance, however, is in the effect on the stakeholder connected to it. In some case studies, only one stakeholder is connected to the legal authority clique, acting as a bridge between it and the rest of the stakeholders.
Having only one stakeholder acting as a bridge between subgroups of stakeholders could result in increasing the influence of this specific stakeholder on decisions that could affect energy efficiency (since information passed through that one stakeholder could be hidden or misinterpreted), disjoining the network into two or more groups and/or the loss of information held by the bridge stakeholder in case he or she is not part of the network anymore. Therefore, it is important for a functioning stakeholders’ network of the energy-efficient housing to have either more than one bridge stakeholder between the networks’ subgroups (such as the legal authority clique) and the rest of the stakeholders or to ensure the strength, presence and availability of information held by that stakeholder as a means of enhancing transparency and flow of information and preserving the connectedness of the network.
In all the case studies’ networks except house 6, there are one or more stakeholders who acted as bridges. The draftsperson acts as the bridge between this clique and the owner/designer in houses 2 and 3 (Figure 1(b)); the contractor acts as the bridge between the clique and the rest of stakeholders in house 1 (Figure 1(a)); and the owner/designer acts as the bridge between the clique and the rest of the stakeholders (except the labour) in houses 4 and 5 (Figures 1(c) and (d)). The clique in house 6, unlike the other case studies, is not isolated and is connected to the rest of the network through more than one bridge (Figure 1(e)).
Regarding the connections between the design and construction phases, the contractor in house 1 and the owner/designer in houses 2, 3, 4 and 5 act as the only bridge between the two phases. In house 6, there is more than one stakeholder who links the two phases, such as the owner/contractor, suppliers, engineer and subcontractors. Having more than one bridge between the different phases and cliques enhances connectivity, the flow/preservation of information and transparency and maximizes the number of cuts that would be needed to disjoin the network.
Discussion
Stakeholders’ centrality
Based on the network of each house, the centrality metrics for stakeholders were computed to help identify and compare their connectivity within the network. Figure 2 shows that in all the case studies, the contractor has higher or equal centrality measures to the owner and designer. There are two exceptions. The first is house 4’s contractor who has only betweenness centrality higher than that of the owner/designer’s, probably due to the high connectivity of the owner with all the stakeholders except the labour who can only be contacted through the contractor (Figure 1(c)), leading to increasing his betweenness centrality. The rest of his centrality measures are low due to the secondary role that this contractor had in the construction phase, compared to the contractors of the other case studies. The second exception is the contractors of houses 2, and 3, who have lower cross-clique centrality than the owner and designer. This is because they are not connected to the legal authority subgroup, when compared to the contractors of the other case studies.

Case studies centrality metrics.
House 6 shows stronger fluctuation patterns of stakeholders’ centrality metrics than the rest of the houses. This means that the high degree of connectivity is distributed among the different stakeholders’ categories, rather than being monopolized by one category. This is resulted from following a nontraditional procurement method that engaged the construction stakeholders during the predesign phase.
The aim of these remarks is to highlight the effect that the process/type of practice and the scope of duties of certain stakeholders have on the centrality metrics and network structure, rather than assigning centrality characteristics to specific stakeholders as a general rule. Further development of the analysis of the stakeholder network could follow Park and Barabasi’s approach to focus on analysing the effect of homophily (through studying the dyadicity and heterophilicity of the stakeholders’ network) on the formation of the network and distribution of specific features across it, and correlating the functional characteristics of the nodes (stakeholders) with the network topology. 49,50
Comparing case studies stakeholders’ centrality metrics
Figure 3 contrasts the case studies’ stakeholders’ levels of degree centrality (Figure 3(a)), closeness centrality (Figure 3(b)), betweenness centrality (Figure 3(c)) and cross-clique centrality (Figure 3(d)). The fluctuation patterns of all case studies (except house 6) show that each of the stakeholders’ groups mentioned in Table 3 shares similar levels of centrality. The highest category is the ‘upwards’ which includes the managers and decision-makers (the owner, contractor and designer) with the contractor being the highest in all case studies (except house 4), followed by the legal authority group responsible for certifying the house (the certifier, regulator and engineer), then the advisors (whenever they are considered as a stakeholders) and the lowest are the executors (plumber, electrician, labour and draftsperson) and suppliers (external influencer). House 6 showed different patterns of stakeholders’ degree centrality due to the different processes that were followed in it (arranging a meeting between various stakeholders prior to the design and construction stages).

Centrality metrics comparison.
The draftsperson’s centrality is higher in houses 2 and 3, due to the difference in the allocated responsibilities that resulted in stronger connections with the legal authorities. The bigger involvement in the decision-making of the draftsperson in these two case studies led to reaching almost the same centrality range of the manager’s category. Houses 5 and 6 had advisors (research institution and simulator) unlike the rest of the houses. Including the advisors in the decision-making process made their centrality level higher than the executors (who are not involved in the decision-making) but lower than the managers and the legal authority stakeholders (who have higher influence on the decision-making). This might mean that there is a correlation between the degree of involvement in the decision-making and the centrality.
The cross-clique centrality of house 6 is the highest (in terms of value and distribution among stakeholders) when compared to the rest of the houses, followed by house 4. The high well-distributed, cross-clique centrality is a sign of a strong healthy network. It shows that the survival of the network does not rely only on a few stakeholders.
Conclusion
This article analysed the relationships between stakeholders of six housing case studies. The first four houses followed (to some extent) the traditional sequence of procurement. House 6 followed a different approach that aims to enhance communication between stakeholders (even if direct links between them are not essential) and strengthen the link between design and construction. Analysing the network of communication between housing stakeholders of these case studies shows that: It is possible to identify and rank stakeholders based on their potential to communicate information and connect to other stakeholders. The case studies’ analysis showed that the upwards stakeholders (managers/controllers) have the highest centrality levels when compared to other stakeholders, with the contractor being usually the most central among the upwards stakeholders. The traditional procurement processes of communication among stakeholders’ results in networks that are characterized by the existence of bridges and isolated stakeholders, which can result in the breaking of the network or to the monopolization of information among certain stakeholders. Enhancing communication between stakeholders in a manner that transcends the common practice of focusing on only the essential relationships leads to increasing the number of links between stakeholders, potentially resulting in more robust networks. Networks with a higher number of links and stakeholders with high betweenness and cross-clique centrality (such as the network of house 6) tend to minimize the number of bridges, making it harder to disjoin the network or isolate certain stakeholders or cliques. Such a network strengthens the link between the different phases of housing procurement and enhances transparency and flow of information. The levels of centrality are correlated with the degree of decision-making authority that each category has.
The degree of connectivity is an important source of influencing other stakeholders’ decisions and consequently influencing the final outcomes of a project; however, there are other criteria that are used as a part of the stakeholder management approach can impact the degree of influence of stakeholders such as authority, power, knowledge, experience, involvement, interest, and so on. Connectivity (centrality) is one factor that helps increase the influence criteria, however, and accurate identification of the levels of influence of each stakeholder requires integrating SNA with stakeholder management approaches.
This article uses SNA as a first step for analysing stakeholders’ influence on energy efficiency in housing, based on their connectivity potential. The next step is to include this connectivity potential into a more comprehensive stakeholder analysis that combines SNA with the stakeholder management approach to reach accurate quantification of such degree of influence.
Footnotes
Acknowledgements
The research team sincerely thanks the owner occupiers, contractors and suppliers of the case studies homes for giving us the time to interview them and the valuable information for our analysis.
Declaration of conflicting interests
The author(s) declared no potential conflict of interest with respect to the research, authorship and/or publication of this article.
Funding
The author(s) disclosed receipt of the following financial support for the research, authorship and/or publication of this article: This research is part of an Australian Research Council project (ARC LP 130100650) ‘From innovators to mainstream market: A Toolkit for transforming Australian housing and maximizing sustainability outcomes for stakeholders’ funded by the Australian Government and industry. The funding bodies had no input into the study design; collection, analysis and interpretation of data; the writing of the report or in the decision to submit the article for publication.