
Abstract
The radio frequency identification (RFID) is one of the most promising new technologies of modern economy, with a high potential of improving the efficiency and productivity of enterprises. The main goal of this study is to determine the extent of RFID usage in European (EU) countries and to estimate whether there is a relation between countries’ competitiveness and their levels of RFID usage. First, the trend of RFID usage among EU enterprises is analyzed for the years 2009, 2011, and 2014. Second, a cluster analysis is applied with the goal to create homogenous groups of countries according to the RFID application across different industries. Third, countries from different clusters were compared according to their competitiveness in 2014. Results revealed that enterprises in Europe differ substantially according to their RFID usage. Also, RFID usage is not evenly distributed among countries across different industries, since some countries were leaders in RFID usage in one industry while lagging behind in RFID usage in other industries. Finally, countries from clusters with a higher RFID usage level also have a higher level of technological readiness and innovation, while smaller differences were found in business sophistication.
Keywords
Introduction
Usage of the latest information and communication technologies (ICTs) provides many benefits for enterprises, for example, better access to information, lower costs, understanding customers’ needs, higher product/service quality, and competitive advantage. 1 In order to enhance competitiveness and efficiently compete on the world market, enterprises have to implement and use the latest inventions in ICTs. Radio frequency identification (RFID) presents an innovative ICT that can improve the current business model, transform business processes, and support decision-making processes. 1,2
RFID technology has been used since World War II, 3 but it has caught the attention of large global enterprises, for instance, Wal-Mart in the United States, in the last few decades. After other large global retailers, such as Tesco, Metro, and P&G, started to use RFID technology, its importance and benefits have been recognized worldwide. The usage of RFID has increased in the last decade in other industries as well, and nowadays, RFID is used in logistics, medication treatment, finance, supply chain, retail, defense industries, manufacturing, and agriculture. Currently, the most positive impact of RFID usage is found in supply chain management, inventory management, and warehouse and retail stores, thus in industries in which moving objects have to be tracked, 4 with the promising prospect of its increased usage in the future. However, the enterprises that stagnate with the usage of RFID technology as one of the main tools toward the full utilization of the Internet of things could endanger their market position both in short- and long-term.
The goal of the article is threefold. First, we want to analyze the usage of RFID among enterprises in European (EU) countries in years 2009, 2011, and 2014. Second, we want to explore whether there are differences among EU countries according to the usage of RFID technology across different industry sectors, using cluster analysis. Third, we aim to investigate whether there are differences in competitiveness between different countries according to their RFID usage, using the global competitiveness index, and indicators from its pillars—the 9th pillar: technological readiness; the 11th pillar: business sophistication; and the 12th pillar: innovation. 5
In order to accomplish the goal of the article, we used the data about RFID usage in enterprises in 30 EU countries. Data were collected from the European Commission Statistics Database (Eurostat) for the years 2009, 2011, and 2014. We analyzed the changes of RFID usage in 2009 and 2011, and 2011 and 2014. A cluster analysis was conducted to organize EU countries into sensible groupings using Eurostat data for 2014, according to RFID usage in enterprises. 6 The Kruskal–Wallis test was used for the comparison of the competitiveness of cluster countries using the global competitiveness index and indicators from its pillars—the 9th pillar: technological readiness; the 11th pillar: business sophistication; and the 12th pillar: innovation. 5
The article is organized as follows. After the introduction as the first part of the article, the second part presents an overview of RFID technology and its usage in enterprises. In the third part of the article, data and methodology have been described. Results are described in the fourth part and discussed in the fifth part. The last part concludes the article.
RFID technology and its usage across industries
RFID is a form of wireless communication using radio waves, which enables automatic identification of objects, collecting data about them, and entering those data into enterprise information systems with little or without human help. 7 –9 RFID enables more effective operations, greater forecasting accuracy, reduced labor costs, shorter transportation time, and better quality of customer service and management of inventory 7,10 –12 through real-time data collection and object identification. 13 The RFID implementation has the best results if it is applied in several enterprises that are a part of a group or work together. 1,8,14
Before the implementation of RFID, enterprises should conduct several analytical studies: future usage planning, Strengths, Weaknesses, Opportunities, and Threats (SWOT), and cost–benefit analysis. 1 Several challenges can be mentioned regarding RFID implementation: integration of RFID with the existing IT applications, 15 a lack of technical expertise and complexity of the technology, 16 and a shortage of RFID skills and a lack of standardization. 17 Therefore, the success of the RFID implementation in enterprises depends upon several factors, for example, data management, existing IT infrastructure, size of enterprises, business value, and implementation complexity. 18
RFID technology has a positive impact on business performance in numerous industries, such as production, distribution, and retailing. 19 However, it is also widely used as a means toward the development of public operations, such as smart cities. In this article, we have focused on RFID usage in the following seven industries: manufacturing, electricity, construction, trade, transportation, accommodation, and ICTs.
RFID technologies enable manufacturing organizations to better handle raw materials, work in progress, products, and inventories, which have a positive impact on manufacturing organizations and the supply chain. 20,21 There is also research where authors confirmed that RFID usage significantly influences inventory, quality of products, delivery speed, customer satisfaction, and accuracy of information. 22
In relation to the construction sector, RFID is mostly used in outdoor environment since it enables timely tracking of the project status, location of materials, workforce, equipment resources, earthmoving operations, and safety hazards predicting. 23 Additionally, in the construction sector, RFID technology is mostly used for material management, such as 24 locating construction materials, maintenance, construction quality, and employees’ management.
RFID technologies used in the retail industry allow cost saving, improved service quality, reduced prices for clients, and better control of distribution. 25 –27 Advantages of RFID usage in the retail industry are improving efficiency, accuracy, and security in the supply chain and inventory management. 26
RFID technology has many applications in transportation industry, for example, reduction of operating costs, status and location monitoring, vehicle tracking, improvement of the work accuracy, and better visibility of ongoing operations. 28 Another advantage is a lower possibility of cargo being stolen, lost, or destroyed. 29
RFID usage in tourism could be grouped into four categories. 30 The first group of RFID usage is human tracking and control and refers to customer loyalty management, tracking people with special needs and airport security. 31,32 The second group of RFID applications in tourism includes assets and valuables tracking systems, and it refers to luggage tracking and food management. 33,34 The third group of RFID usage in tourism refers to contactless payment systems, and it is related to payments in hotels and keyless room entry. 35 In the last group, RFID-based information, RFID could be used for sightseeing tours. 36
RFID benefits are recognized and used the most in the ICT sector. 37,38 For example, Wu and coauthors have presented the design and development of an RFID-based health-care information system. 13 Barjis and Fosso Wamba present RFID usage in health care management regarding instant access to patient information, handling laboratory samples, and locating devices. 1
Methodology
Sample description
We have analyzed three sets of data: (1) the usage of RFID technologies in enterprises in the selected EU countries in 2009, 2011, and 2014; (2) the usage of RFID technologies in enterprises from the selected industry sector in the selected EU countries in 2014; and (3) competitiveness of cluster countries in 2014, using the global competitiveness index and indicators from its pillars—the 9th pillar: technological readiness; the 11th pillar: business sophistication; and the 12th pillar: innovation. 5
First, data on RFID usage were collected for 30 EU countries (EU countries—Iceland, Norway, and FYR Macedonia) from the Eurostat database, 39 for which the data were available. Data were collected for the years 2009, 2011, and 2014. The enterprises were asked whether in their business operations, they used: (1) an automatic identification method to store and remotely retrieve data using RFID tags or transponders or (2) an RFID tag, which is a device that can be applied to or incorporated into a product or an object and transmits data via radio waves. 6 If one of those usages is present in the enterprise, it is considered that the enterprise is using RFID technology.
Second, data on the usage of RFID in enterprises in the selected EU countries in 2014 across several industry sectors were collected from the Eurostat database. Seven different industry groups were selected for the purpose of the analysis due to the widespread RFID usage (manufacturing, electricity, gas, steam, air conditioning and water supply, construction, wholesale and retail trade, repair of motor vehicles and motorcycles, transport, accommodation, and information and communication). Data for both data sets were collected as the percentage of enterprises which have 10 or more employees and use RFID technology.
The third data set is used for measuring the competitiveness of the selected EU countries. The Global Competitiveness Report defines competitiveness as “the set of institutions, policies, and factors that determine the level of productivity of a country,” 5 and it measures the competitiveness with the overall competitiveness index, three subindices, and 12 pillars.
Data were collected for the competitiveness dimensions that could be related to the usage of RFID technology—the 9th pillar: technological readiness; the 11th pillar: business sophistication; and the 12th pillar: innovation and the global competitiveness index. The competitiveness indicators are defined and collected by the World Economic Forum, and the data are collected for the year 2014. 5 Three types of data are collected: (1) composite indices (e.g. the 9th pillar: technological readiness), (2) data on opinions of the respondents of the firms representing the main sectors of the economy (agriculture, manufacturing industry, nonmanufacturing industry, and services) collected using the Likert-type scale 1–7 (e.g. 9.01 availability of the latest technologies, 1–7), and (3) official statistical data (e.g. 9.07 mobile broadband subscriptions/100 inhabitants).
Statistical methods
The process of the statistical analysis consists on the following four steps:
Step 1: Analysis of trends in RFID usage in EU countries in 2009, 2011, and 2014.
Step 2: Exploratory analysis of RFID usage in EU countries in selected industry sectors in 2014.
Step 3: K-means cluster analysis of RFID usage in EU countries in selected industry sectors in 2014.
Step 4: Kruskal–Wallis test of the differences in competitiveness between clusters as the result of the step 3.
In step 1, we have used a descriptive statistical analysis in order to give an evaluation of the trends in RFID usage in 2009, 2011, and 2014. Step 2 refers to the exploratory analysis of RFID usage in EU countries in selected industry sectors in 2014, and it included a descriptive statistical analysis and outlier detection. Step 3 refers to the usage of the K-means cluster analysis 40 in order to organize EU countries into homogenous groups for the year 2014, regarding their usage of RFID across different industries. One of the best ways to understand a large amount of data is to separate them into homogeneous groups. 41,42 The cluster analysis is one of the knowledge discovery techniques used to find structure in data and to group data into clusters based on their similarities. Application of cluster analysis can be found in the following domains: data mining and knowledge discovery, data compression and vector quantization, optimization, finance, manufacturing, and medical organizations. 41,43 In the step 3, data on the usage of RFID in 28 EU countries were used for cluster determination. Using the nonhierarchical K-means cluster analysis, countries were grouped regarding indicators of competitiveness 9th, 11th, and 12th pillars. In step 4, we used the Kruskal–Wallis test 44 in order to compare identified competitiveness of cluster countries.
Results
Step 1: Analysis of trends in RFID usage in EU countries in 2009, 2011, and 2014
Trends in RFID usage are presented in Figure 1. As expected, usage of RFID increased in 2014 in comparison to usage in 2011 and 2009. In 2009, enterprises from the Netherlands (9%) and Finland (8%) used the RFID technology the most. In several other countries (Germany, Spain, Croatia, Austria, and Slovakia), about 4% of enterprises used RFID technology. For several EU countries, data on the usage of RFID technology were not available (Greece, Latvia, Malta, Iceland, and FYR Macedonia). The situation in 2011 is almost the same as the situation in 2009. The largest number of enterprises using RFID (8%) was in Finland and Slovakia, followed by Croatia, Lithuania, and Malta (7%). In 2014, RFID usage in enterprises was higher than 15% in several countries (Belgium: 17%, Malta: 15%, Austria: 18%, and FYR Macedonia: 15%). The highest percentage of enterprises using RFID was in Finland (21%). The lowest percentage of enterprises that used RFID in 2014 was in Greece (4%).

Trends in RFID usage in European countries in 2009, 2011, and 2014. Source: Authors’ calculation based on Eurostat data (2016a). RFID: radio frequency identification.
Changes in RFID usage are presented in Figure 2. The graph shows that changes between 2009 and 2011 are lower than changes between 2011 and 2014. The comparison of data from 2009 and 2011 indicates that there were no changes regarding Finland, Romania, and Italy. The data indicate that RFID usage was lower in 2011 than in 2009 in France, Poland, and the United Kingdom (1% point), while in the Netherlands, the decline of RFID usage among enterprises was 7% points. However, this data could be the result of the different sample used. Since the usage of RFID is still rather low, it is possible that the sample in those countries did not represent the population in the most representative manner. Comparing changes from 2011 to 2014, one can conclude that there was a rather high increase in RFID usage among countries. The highest progress was in the highly developed EU countries (Belgium, Luxembourg, the Netherlands, Austria, and Finland).
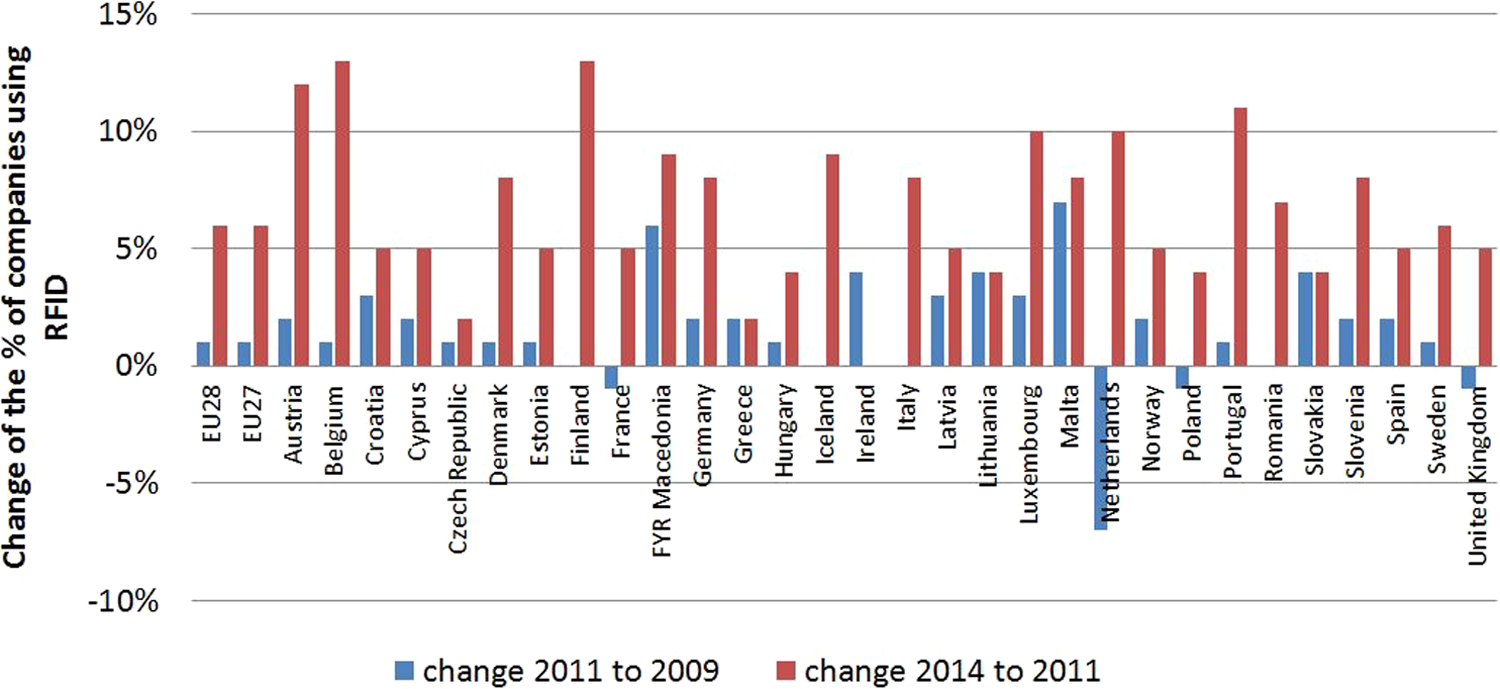
Changes in RFID usage in European countries in 2009, 2011, and 2014. Source: Authors’ calculation based on Eurostat data (2016a). RFID: radio frequency identification.
Step 2: Exploratory analysis of RFID usage in EU countries in selected industry sectors in 2014
Table 1 presents descriptive statistics of RFID usage according to the industry on the overall sample of enterprises from EU countries in 2014. The average grade is the lowest for the construction industry (6.45), while the highest average grade is for the ICT sector (22.14) and the energy industry (18.39). Other four industries that have almost the same average grade are the manufacturing (12.19), the sales (10.79), the transport (12.76), and the accommodation (12.04) industry.
Descriptive statistics of RFID usage according to industry of enterprises.

Source: Authors’ calculation based on Eurostat data (2016a).
RFID: radio frequency identification.
An outlier analysis was conducted, and since none of the countries are beyond the three standard deviations, we decided not to exclude any of the countries from further analysis. However, data were not available for the following countries: FYR Macedonia, Greece, and Belgium, which were therefore excluded from the analysis.
Step 3: K-means cluster analysis of RFID usage in EU countries in selected industry sectors in 2014
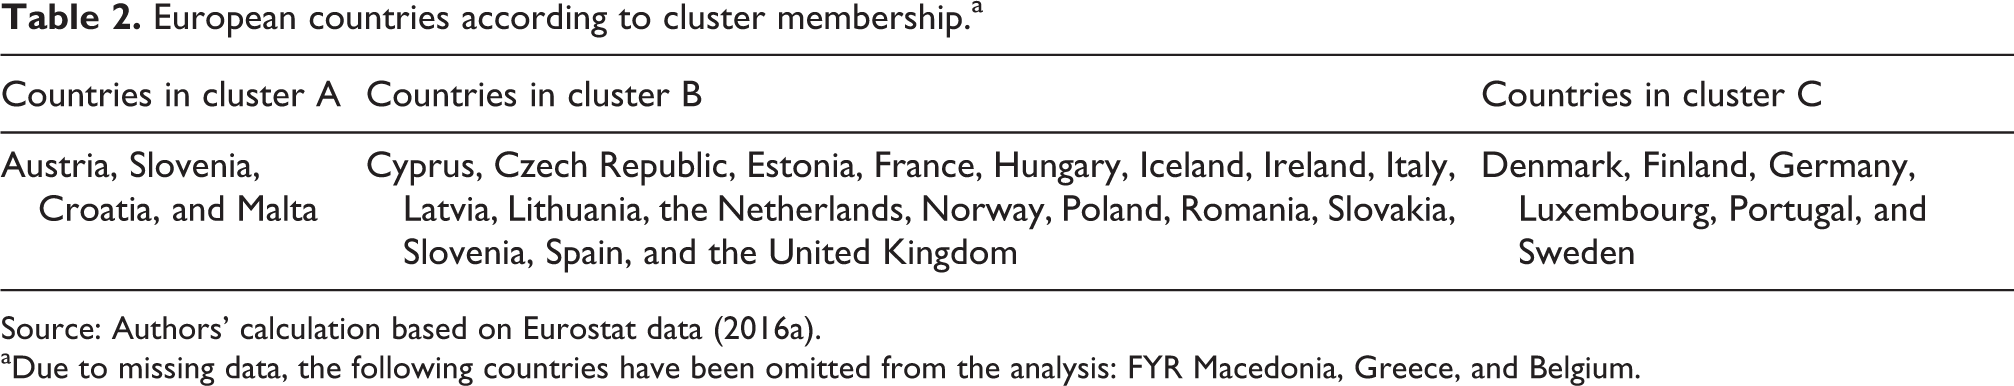
Table 2 presents the clusters of the selected EU countries grouped based on RFID usage in 2014, using the K-means algorithm. We have chosen to use a three-cluster analysis since the analyses with more clusters generate the clusters with a very small number of countries (e.g. one cluster consists of only one country with the overall highest level of RFID usage in selected industry sectors).
European countries according to cluster membership.a
Source: Authors’ calculation based on Eurostat data (2016a).
aDue to missing data, the following countries have been omitted from the analysis: FYR Macedonia, Greece, and Belgium.
Countries, which are grouped into cluster A, are: Austria, Slovenia, Croatia, and Malta, and they have the highest average usage of RFID in the information and communication sector (ICT). Good result for the RFID usage in Slovenia and Croatia is somewhat surprising, taking into account that both are post-transition countries with the higher corporate digital divide. 45 However, the high level of RFID usage could be the result of the cross-border cooperation among the software companies from Croatia, Slovenia, and Austria, with examples like Technology Park Ljubljana.
Countries which are grouped into cluster B are: Cyprus, the Czech Republic, Estonia, France, Hungary, Iceland, Ireland, Italy, Latvia, Lithuania, the Netherlands, Norway, Poland, Romania, Slovakia, Slovenia, Spain, and the United Kingdom. Those countries have the lowest level of RFID usage across all of the industries. Most of the countries in this group are post-transition countries (Estonia, Latvia, Lithuania, Poland, Romania, Slovakia, and Slovenia), which have lower usage of digital technologies than more developed EU countries. 46 However, other countries are more developed, like France, Iceland, Ireland, Italy, the Netherlands, Norway, Poland, Spain, and the United Kingdom, indicating that the RFID technology is not yet common used in the business settings, and there are number of barriers toward its usage, even in more developed environments. 2,12
Cluster C contains countries with the highest level of RFID usage, especially in the energy sector, construction, and sales. Those countries are Denmark, Finland, Germany, Luxembourg, Portugal, and Sweden. They mainly come from the central and the northern part of the Europe, with the exception of Portugal. This result is in line with the highly developed economies of these countries, which are also the leaders in the innovation, according to the Innovation European Scoreboard indicators. 46
An average ratio of RFID usage of different clusters (2014) is shown in Figure 3. It can be concluded that RFID is used the least in the construction industry (8%—cluster A, 5%—cluster B, and 9%—cluster C). Two industries with the highest level of RFID usage are electricity and other energies (19%—cluster A, 15%—cluster B, and 29%—cluster C) and ICT sector (37%—cluster A, 18%—cluster B, and 23%—cluster C). The results for these two industries are in line with their high level of innovativeness. 47
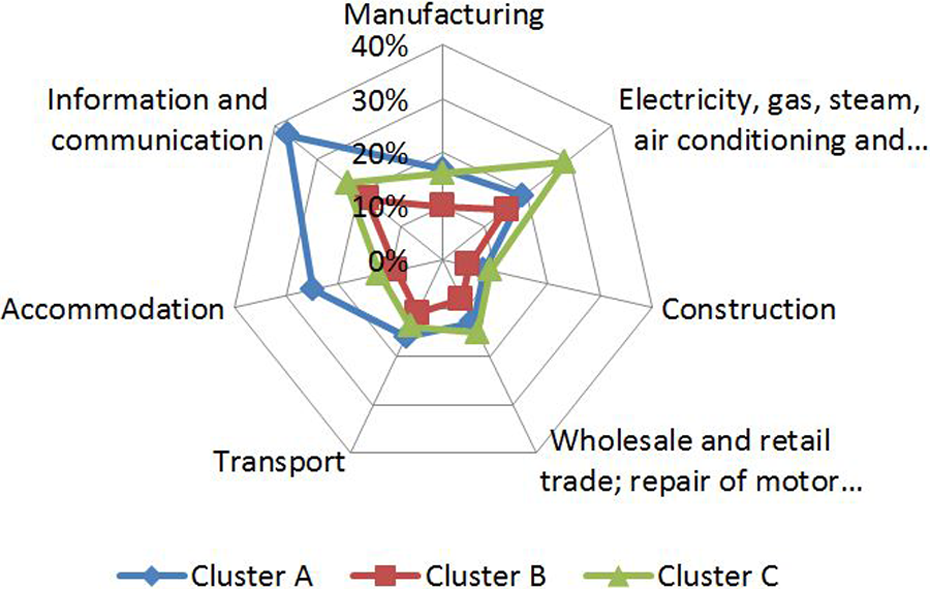
Average ratio of companies using RFID in different industries according to clusters, 2014. Source: Authors’ calculation based on Eurostat data (2016a). RFID: radio frequency identification.
Enterprises from selected EU countries in cluster A used RFID the most in the following industries: accommodation (25%) and ICT (37%). In addition, RFID usage by enterprises is also high in energy sector (19%), manufacturing (17%), and transport industry (16%). However, the enterprises from selected EU countries in cluster A used RFID the least in construction industry (8%). Enterprises from selected EU countries in cluster B used RFID the most in the following industries: energy (15%) and ICT (18%). The lowest usage of RFID by enterprises in cluster B is in construction industry (5%), just like in cluster A. However, the enterprises from selected EU countries in cluster B used RFID the least in all industries. In cluster C, RFID usage is the highest in the energy sector (29%) and ICT (23%). Like in the clusters A and B, the lowest usage of RFID by enterprises in cluster C is in construction industry (9%).
Step 4: Kruskal–Wallis test of the differences in competitiveness among clusters as the result of the step 3
In order to investigate whether there is a relation between the level of competitiveness and RFID usage, we have compared the countries from the clusters according to the competitiveness indices. The Kolmogorov–Smirnov test did not indicate the normality of the distribution of the competitiveness indices, and therefore, the nonparametric Kruskal–Wallis test was used in order to test the statistical significance of the differences.
The average values of indices of technological readiness are the highest in cluster C, in which countries whose enterprises use RFID the most can be found (Table 3). Countries from clusters A and B have lower average values of indices measuring the technological readiness, as well as the lower value of RFID usage. The Kruskal–Wallis analysis revealed that differences are statistically significant for four competitiveness indices—the 9th pillar: technological readiness (5% level); technological adoption (5% level); availability of the latest technologies (10% level); and firm-level technology absorption (5% level).
Competitiveness of cluster members according to the 9th pillar: technological readiness and Kruskall–Wallis test.

Source: Authors’ calculation based on Eurostat data (2016a) and World Economic Forum (2015).
ICT: information and communication technology, FDI: Foreign Direct Investment.
*Statistically significant at 10%.
**Statistically significant at 5%.
The average values of business sophistication are the highest in cluster C, with one exception, that is, the average value for local supplier quantity, which is the highest in cluster A (Table 4). Countries from clusters A and B have lower average values of competitiveness indices as well as lower values of RFID usage (with the exception of one index) (Table 5). The Kruskal–Wallis test revealed that differences are statistically significant for four competitiveness indices: local supplier quality (10% level), state of cluster development (10% level), nature of competitive advantage (5% level), and willingness to delegate authority (10% level).
Competitiveness levels of cluster members according to the 11th pillar: business sophistication and its composite measures and Kruskal–Wallis test.

Source: Authors’ calculation based on Eurostat data (2016a) and World Economic Forum (2015).
*Statistically significant at 10%.
**Statistically significant at 5%.
Competitiveness levels of cluster members according to the 12th pillar: innovation and its composite measures and overall competitiveness indices (innovation and general); Kruskal–Wallis test.

Source: Authors’ calculation based on Eurostat data (2016a) and World Economic Forum (2015).
R&D: research and development.
*Statistically significant at 10%.
**Statistically significant at 5%.
***Statistically significant at 1%.
The average values of innovation indices and global measure of competitiveness are again the highest in cluster C. Countries from clusters A and B have lower average values of competitiveness indices as well as lower values of RFID usage. The Kruskal–Wallis test revealed that differences are statistically significant for almost all of the analyzed competitiveness indices, except the 12.05 Gov’t procurement of advanced tech products and 12.07 Patent Cooperation Treaty (PCT) patents.
Discussion
In order to investigate the relationship between the competitiveness indices and the level of RFID usage according to the EU countries, the following procedure was used. First, using the Kruskal–Wallis test, we investigated that the differences in competitiveness between countries belonging to clusters are statistically different. Second, we identified the best and the worse clusters according to the average values of competitiveness indices per clusters.
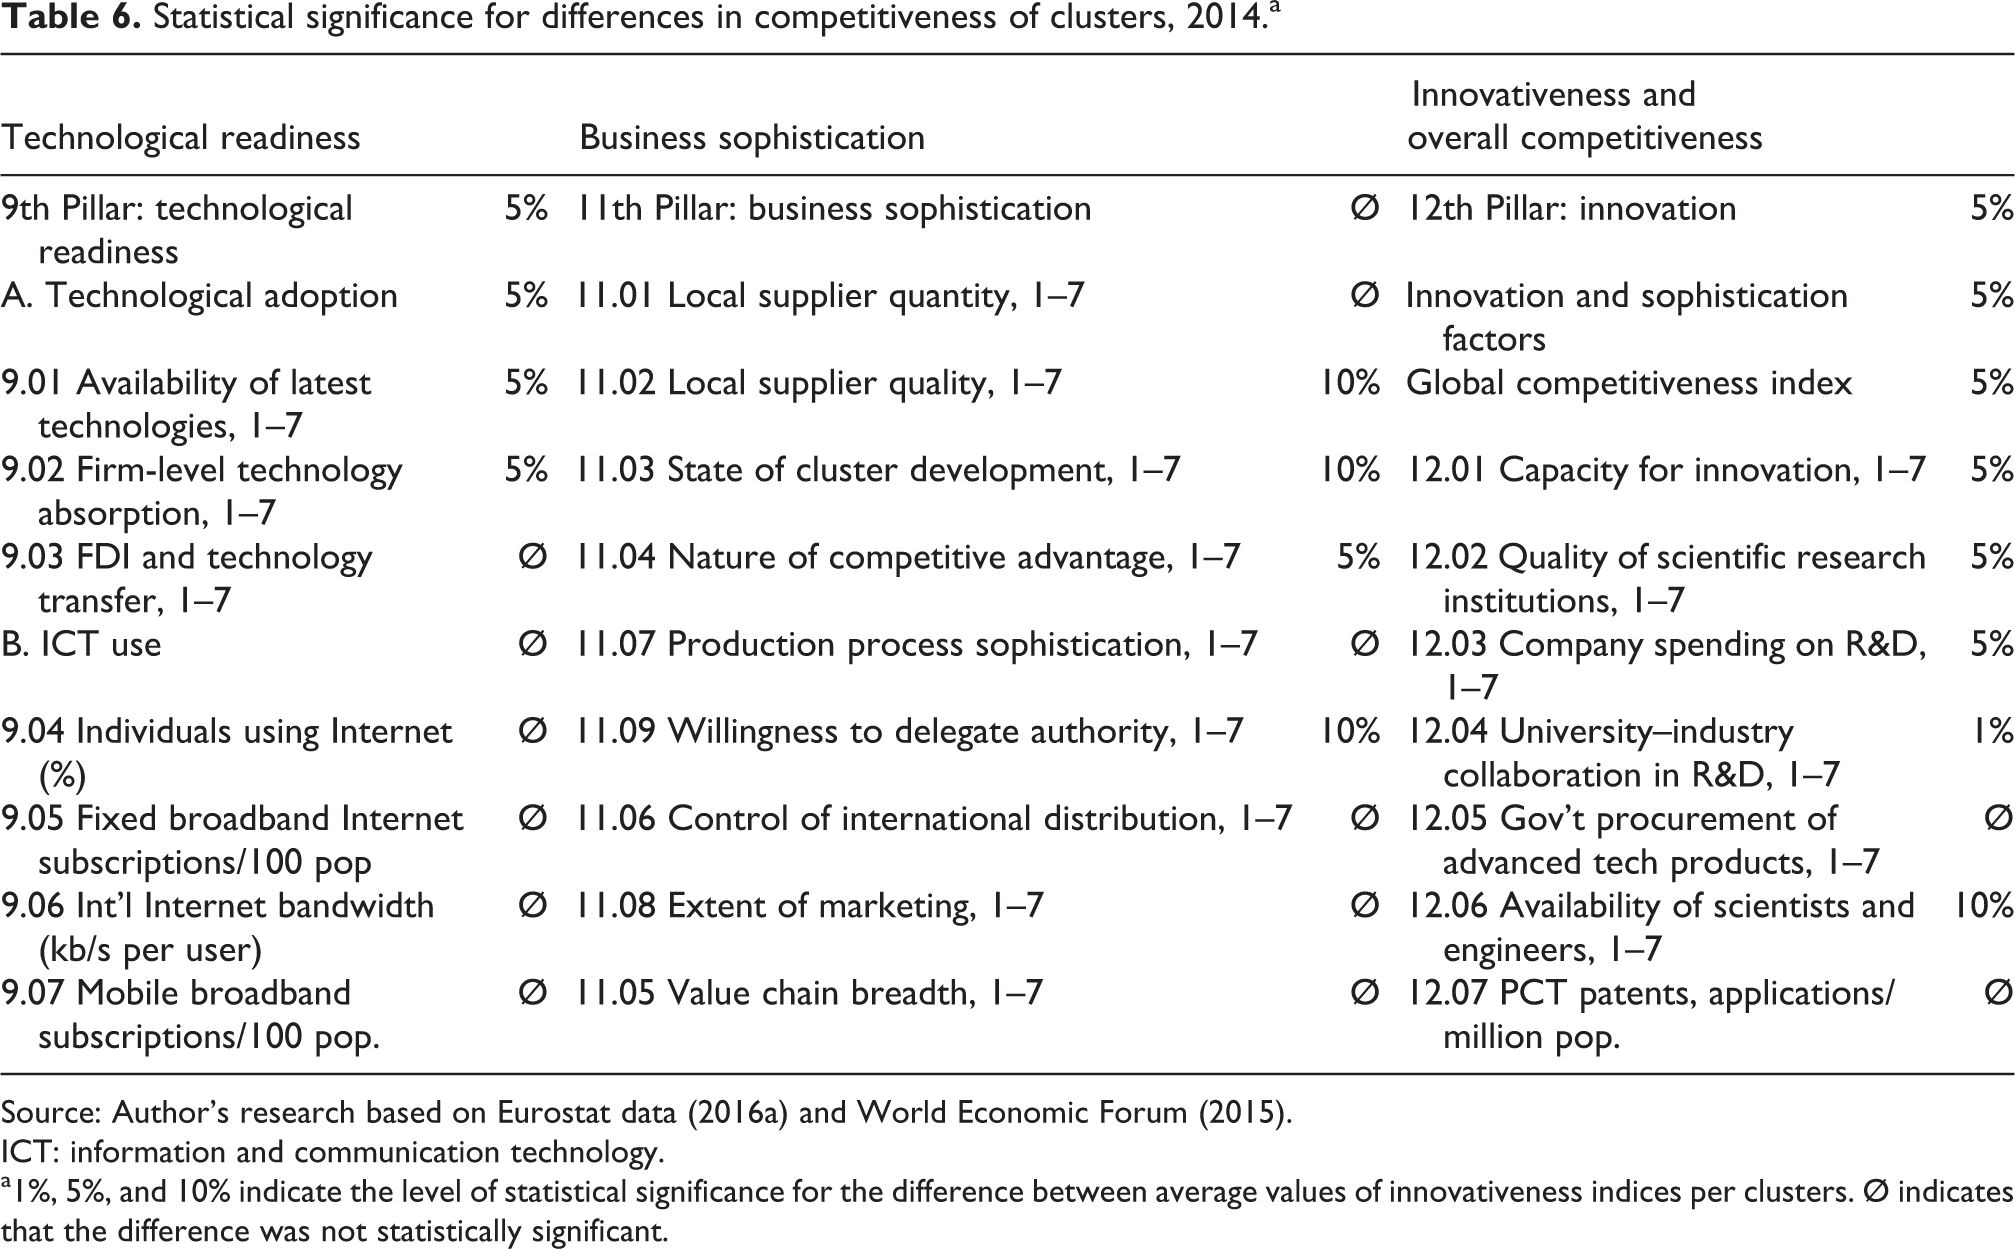
Table 6 summarizes the results of the Kruskal–Wallis test for the year 2014. The analysis reveals that the average index values of competitiveness are statistically significant for almost all indices regarding 12th pillar: innovativeness and overall competitiveness, mostly with the 5% level. These results indicate that the relationship between RFID usage and innovation is stronger than the relationship with 9th pillar: technological readiness and 11th pillar: business sophistication. Such findings could be the result of the fact that the RFID is the disruptive technology which is more related to the innovativeness than the regular development of technology and doing business. 48
Statistical significance for differences in competitiveness of clusters, 2014.a
Source: Author’s research based on Eurostat data (2016a) and World Economic Forum (2015).
ICT: information and communication technology.
a1%, 5%, and 10% indicate the level of statistical significance for the difference between average values of innovativeness indices per clusters. Ø indicates that the difference was not statistically significant.
Table 7 presents the clusters with the highest and the lowest average values of competitiveness indices. In most of the cases, the average competitiveness indices were the highest in cluster C and the lowest in cluster A in most of the cases (Table 6). These results had been expected, since cluster C includes some of the most developed countries of Europe, and previous research also indicated that the overall usage of the ICTs is related to the competitiveness. 49 Most of these are countries of Northern Europe (Denmark, Finland, Germany, Luxembourg, and Sweden), with the exception of Portugal. Cluster A includes the neighboring countries of Central and Southeast Europe (Austria, Slovenia, and Croatia) and Malta, among which only Austria could be considered as the highly developed country. Cluster B contains the EU countries from different regions (Cyprus, the Czech Republic, Estonia, France, Hungary, Iceland, Ireland, Italy, Latvia, Lithuania, Malta, the Netherlands, Norway, Poland, Romania, Slovakia, Slovenia, Spain, and the United Kingdom). The countries from this sector are of various levels of economic development, membership of the EU, and their geographical position.
Clusters with the highest and the lowest average values of competitiveness indices, 2014.

Source: Author’s research based on Eurostat data (2016a) and World Economic Forum (2015).
ICT: information and communication technology; R&D: research and development.
Therefore, the average values of competitiveness indices according to clusters are the highest for the clusters with countries that are leading in the usage of RFID, as one of the most relevant innovations nowdays. 26 Previous research indicates that the characteristics of new technologies challenges to the adoption of RFID are not just technological issues, but political and societal issues, as well as regarding privacy, health, and environment. 50
Conclusion
Development and usage of new information technologies, such as RFID, provide new possibilities for enterprises, which helps them to successfully compete in the global market. EU countries are aiming to increase their competitiveness by the usage of ICTs, under the Information Society Agenda, 51 which reinforces its radio spectrum policy. The contributions of this study are as follows: (1) analysis of trends in RFID usage in the selected EU countries in 2009, 2011, and 2014; (2) cluster analysis using K-means of the selected countries according to RFID usage in enterprises in selected industry sectors; and 3) analysis of the relationship between RFID usage in enterprises in selected industry sectors and the level of countries’ competitiveness.
The trend analysis revealed that RFID usage is increasing in EU countries, but not at an equal speed. When RFID usage in the period from 2009 to 2011 is compared to the usage in the period from 2011 to 2014, improvements are visible, but still a rather low percentage of enterprises in EU countries uses RFID technology. The cluster analysis revealed that countries in Europe can be partitioned into homogenous groups regarding RFID usage among enterprises in different industry sectors. The Kruskal–Wallis test revealed that countries that are in clusters with the highest level of RFID usage also have a higher level of competitiveness, measured using the global competitiveness index and indicators from its pillars—the 9th pillar: technological readiness; the 11th pillar: business sophistication; and the 12th pillar: innovation. The results on the relation between competitiveness and RFID are in line with the numerous previous researches on impact of ICT to the competitiveness. 46,52
The findings of this research could be considered as a valuable indicator for the future policy makers of strategies, such as the Digital Agenda for Europe. The results indicate that the level of RFID usage is still rather low. Only those countries that are well advanced in the usage of RFID technology will be able to use its positive impacts on the effectiveness of business processes, while other countries will be lagging behind. Results indicate that the most advanced countries in the usage of RFID technology are mostly countries from Central and Northern Europe (Denmark, Finland, Germany, Luxembourg, Portugal, and Sweden). Those countries are already among the technological leaders in Europe, which probably reinforces their success in the usage of RFID technology. Other countries still have the chance to catch up, but more efforts should be invested in promoting the radio spectrum policy. That approach could support the expansion of the information society and reduce the enterprise digital divide among EU countries.
Limitations of this research refer to data collection and analyses, which were made for only 3 years, that is, 2009, 2011, and 2014. Also, in our work, we have focused only on the EU countries, and future research should be oriented toward the detailed analysis of RFID usage among enterprises worldwide. Such research will probably reveal a very low level of RFID usage in the least developed countries, which could additionally reinforce the enterprise digital divide in their enterprises. 45 Data analysis on the level of the enterprises would also be beneficial for future analysis, since it could provide a deeper outlook into the benefits of the RFID usage, as well as incentives and obstacles toward its utilization. Such analysis could be conducted using well-known theoretical frameworks of the technology adoption, such as the technology adoption model or the technology-organization-environment framework. 53
Footnotes
Declaration of Conflicting Interests
The author(s) declared no potential conflicts of interest with respect to the research, authorship, and/or publication of this article.
Funding
The author(s) disclosed receipt of the following financial support for the research, authorship, and/or publication of this article: This work has been partially funded by the Innovative Technologies Centre S.A., Greece.