
Abstract
Location of urban distribution center (UDC) has played an important role in reducing distribution cost, environmental impact, and traffic congestion in urban areas. The article aims at evaluating potential location of UDC for sugar commodity using a combined approach that comprises two stages: spatial analysis and multi-objective mixed-integer linear programming. Results demonstrate that different locations of UDC correspond to different costs and environmental implications. It is suggested that a new UDC for the sugar commodity can be located at the east part of the city outskirt. Using more than two UDCs in the studied case appears to be not economically and environmentally beneficial.
Keywords
Introduction
City logistics has become an issue in big cities around the world. 1 In fact, most studies address urban passenger transport, while urban freight transport is still not well explored. On the other hand, dynamic and rapid economic activities in urban areas have promoted the growing need for urban freight movements. The increased urban freight movements create traffic congestion and inefficiency in transport, consequently reducing service level and increasing distribution costs. Moreover, intensive urban freight transportation contributes to pollution and unhealthy living condition in urban areas. According to European Union, 2 although urban freight transport represents only 10–18% of road traffic, it contributes up to 40% of air and noise pollutions.
Among alternatives to improve delivery efficiency and to mitigate negative externalities of freight transport, the establishment of urban distribution center (UDC) that consolidates freight movements seems to be promising. 1 The UDC separates logistics activities inside and outside a city. The UDC receives goods from long-distance freight transport, reorganizes, and delivers to final customers using smaller vehicles. Location for UDC, which is normally known as “location problem” in logistics, therefore becomes crucial. Some studies 3,4 have demonstrated the significant role of the UDC location. According to the traditional approach, there are two ways to determine facility location, namely, supply-oriented approach and market-oriented approach. When determining the UDC location, a trade-off however exists. For instance, if the UDC is located near to customers, it costs traffic congestions and pollutions in the urban areas. On the other hand, if the UDC is located far from the customers, the traffic congestions and the pollutions in the urban areas can be reduced, but distribution cost will be very high due to longer traveled distance.
Location problem has been widely discussed in transportation and logistics literatures. 5 –7 The selection of UDC location is a complex two-level hierarchical problem: first, macrolevel analysis for evaluating overall potential territory for UDC, and second, microlevel analysis for determining the most appropriate, specific location of UDC based on the selected area acquired from the macrolevel analysis. Existing literatures integrating micro- and macro-level analyses are however few. Because of the complexity of urban areas, determining UDC location involves many factors such as demographical, social, and environmental issues, and consequently, it requires a more comprehensive approach.
This present article, therefore, aims at both exploring the potential areas of UDC based on geographical and demographical criteria and evaluating the appropriate UDC location based on the trade-off between total cost and total CO2 emission. A combined approach integrating both ranking and optimization approaches is proposed. In the first stage, ranking approach for determining the rank of potential areas was conducted through spatial analysis using GIS data and analytical hierarchy process (AHP). This was done because spatial issues have arisen in the stage of UDC establishment—the location that seems to be potential with respect to cost and emission cannot be realized due to inaccessible, restricted, or high-risk areas. In the second stage, the optimization approach was conducted through the development of multi-objective mixed-integer linear programming (MOMILP) putting into account both the total cost and the CO2 emission. It is expected that by combining spatial analysis and multi-objective optimization, the appropriate and realistic UDC location can be obtained.
Logistics system of sugar commodity at Yogyakarta city with the size of 46 km2 and population density of 1161 people/km2 was taken as a studied case. Five sugar suppliers located at other provinces provide sugar demanded by 89 retailers that are scattered over Yogyakarta city area (see Figure 1). Existing UDC to serve the retailers is located at the west part of the city (see Figure 3). Because the region becomes denser, it is impossible to expand the capacity of the existing UDC. On the other hand, growing population causes an increasing demand of basic commodities. Appropriate location of new UDC hence needs to be evaluated. Many aspects related to economy (transportation cost, land price), environmental impact (pollution), and social aspect (target market) should be considered to facilitate better decision in determining UDC location. 8 This study contributes not only to provide insights on potential location of new UDC(s) but also to demonstrate the combined approach of spatial analysis and MOMILP in selecting the location of UDC.

Suppliers noted as S1 to S5 (blue dots) and scattered 89 retailers (red dots) within the center of Yogyakarta city.
The article is organized as follows: This section introduces the objectives of the present study and case background. The second section presents theoretical background that is followed by methodology in the third section. The fourth section presents results and discussion, before closing with conclusion and future work in the final section.
Theoretical background
UDC is a facility for goods transshipment for urban areas. 8 The UDC is used to consolidate delivery distribution process efficiently by increasing utility transport vehicle, thus minimizing the number of transport vehicles used. The UDC has been used for a wide variety of contexts and purposes. The purposes of distribution facilities in urban areas are to reduce the density of freight traffic, change the type of transport vehicle in the shipping process, reduce the environmental impacts arising in respect of goods transport activities, improve the efficiency of transport of goods, and minimize the need for storage of goods and logistics activities in the urban area.
Many literatures have demonstrated that the location of distribution center should be examined carefully because inappropriate location not only leads to inefficient and ineffective distribution but also creates pollution and traffic congestion. 9 The literatures on location problem can be classified based on the following criteria: approach (ranking vs. optimization), number of evaluation criteria (single vs. multiple objectives), uncertainty (deterministic vs. stochastic), and number of objects/locations (single vs. multiple facilities). The literatures basically indicate two approaches to determine the location of distribution center: ranking and optimization that are used at the macro- and micro-level analyses, respectively. 10
Ranking approach involves AHP, 11 multicriteria decision analysis, 12 fuzzy multicriteria decision-making, 13,14 and fuzzy The Techniques for Order of Preference by Similarity to Ideal Solution (TOPSIS). 15 The methods are normally used when a number of criteria and options are being considered in determining the distribution center location. The methods map the options through pairwise comparison of the relative importance between criteria. Many studies have discussed criteria to be used in location decision-making of distribution center. Common criteria to be considered are readiness of the infrastructure, labor availability and labor costs, congestion levels, geographical conditions, logistic costs, and government support. 14 –16 Following Alam, 16 closeness to the market contributes to minimize transportation costs and facilitate consumers an access to obtain goods, thus proximity to market should be put into account. Investment cost, expansion possibility, and availability of acquired material are also found to be considerate factors. 3 Other factors such as geographical condition and risk related to disaster should also put into consideration particularly in Indonesia. 17 In addition, land slope is another factor that is crucial for land transport such as trucks. The land transport ideally requires low land slope to smoothly move the goods. At last, the establishment of UDC also required the availability of suitable land according to government regulations. 16 Summarizing, the present article therefore uses infrastructure, proximity to market, land availability, land cost, land slope, and disaster risk as considerate factors in determining the potential location of UDC.
Optimization approach determines the location of UDC through mathematical models. The simplest method to determine location is center of gravity (COG), which has been particularly useful to determine a single-site facility by evaluating a central location of demand points. 18 The COG, however, ignores spatial constraints that are common in urban areas. Optimization has been the most common method used for evaluating UDC location, as the optimization method finds the best location, given demand constraint, supply constraint, and capacity constraint, which provides more realistic setting than COG. Linear programming and mixed-integer linear programming have been the most common models used by researchers. 5,9,19,20
Current literatures, however, have focused on either ranking approach or optimization approach. Literatures using ranking approach aims at selecting the most desirable area for locating UDC in a given territory, whereas literatures using optimization approach focus mostly on reducing transportation cost. According to the best of the authors’ knowledge, the combined approach of ranking and optimization has not been reported in the literatures. Moreover, from the practical point of view, the establishment of UDC is not only to minimize costs but also to minimize environmental impact that arise in the region; it is, therefore, necessary to combine macro- and micro-level approaches to obtain a better location of UDC. The present article, therefore, combines both ranking and optimization approaches. Spatial analysis was used to rank potential areas of UDC based on weighted spatial data, whereas optimization was developed to select the specific location of the UDC. As most of the existing studies have applied single-objective linear programming extensively (normally using cost), 9,19 –21 the present article therefore implements MOMILP to deal with conflicting objectives related to both cost and emission.
Methodology
This section details a specific methodology of the study that is divided into two steps: spatial analysis and MOMILP.
Spatial analysis
Spatial analysis was conducted to discover potential areas for UDC. Six important factors in determining the location of UDC, namely, infrastructure, proximity to market, land availability, land cost, land slope, and disaster risk, were considered. Spatial data that stores specific attribute/feature data of the geographic areas related to those six important factors was then collected.
As spatial data of those factors was not entirely available, some factors were measured indirectly. For instance, infrastructure related to road accessibility can be measured through vehicle per road capacity ratio (V/C ratio), representing road density or road accessibility, which was obtained from Department of Transportation. 22 Population density was used as a proxy to measure proximity to the market. Spatial data of land availability is based on land-use planning and government regulation. Land price, one of the most important factor for facility investment, was based on real estate market. To represent spatial data of disaster risk, disaster index issued by regional disaster management agency (Badan Penanggulangan Bencana Daerah) was then applied. Spatial data of indicators representing those factors shown in Figure 2 were acquired from different sources and shown in Table 1.
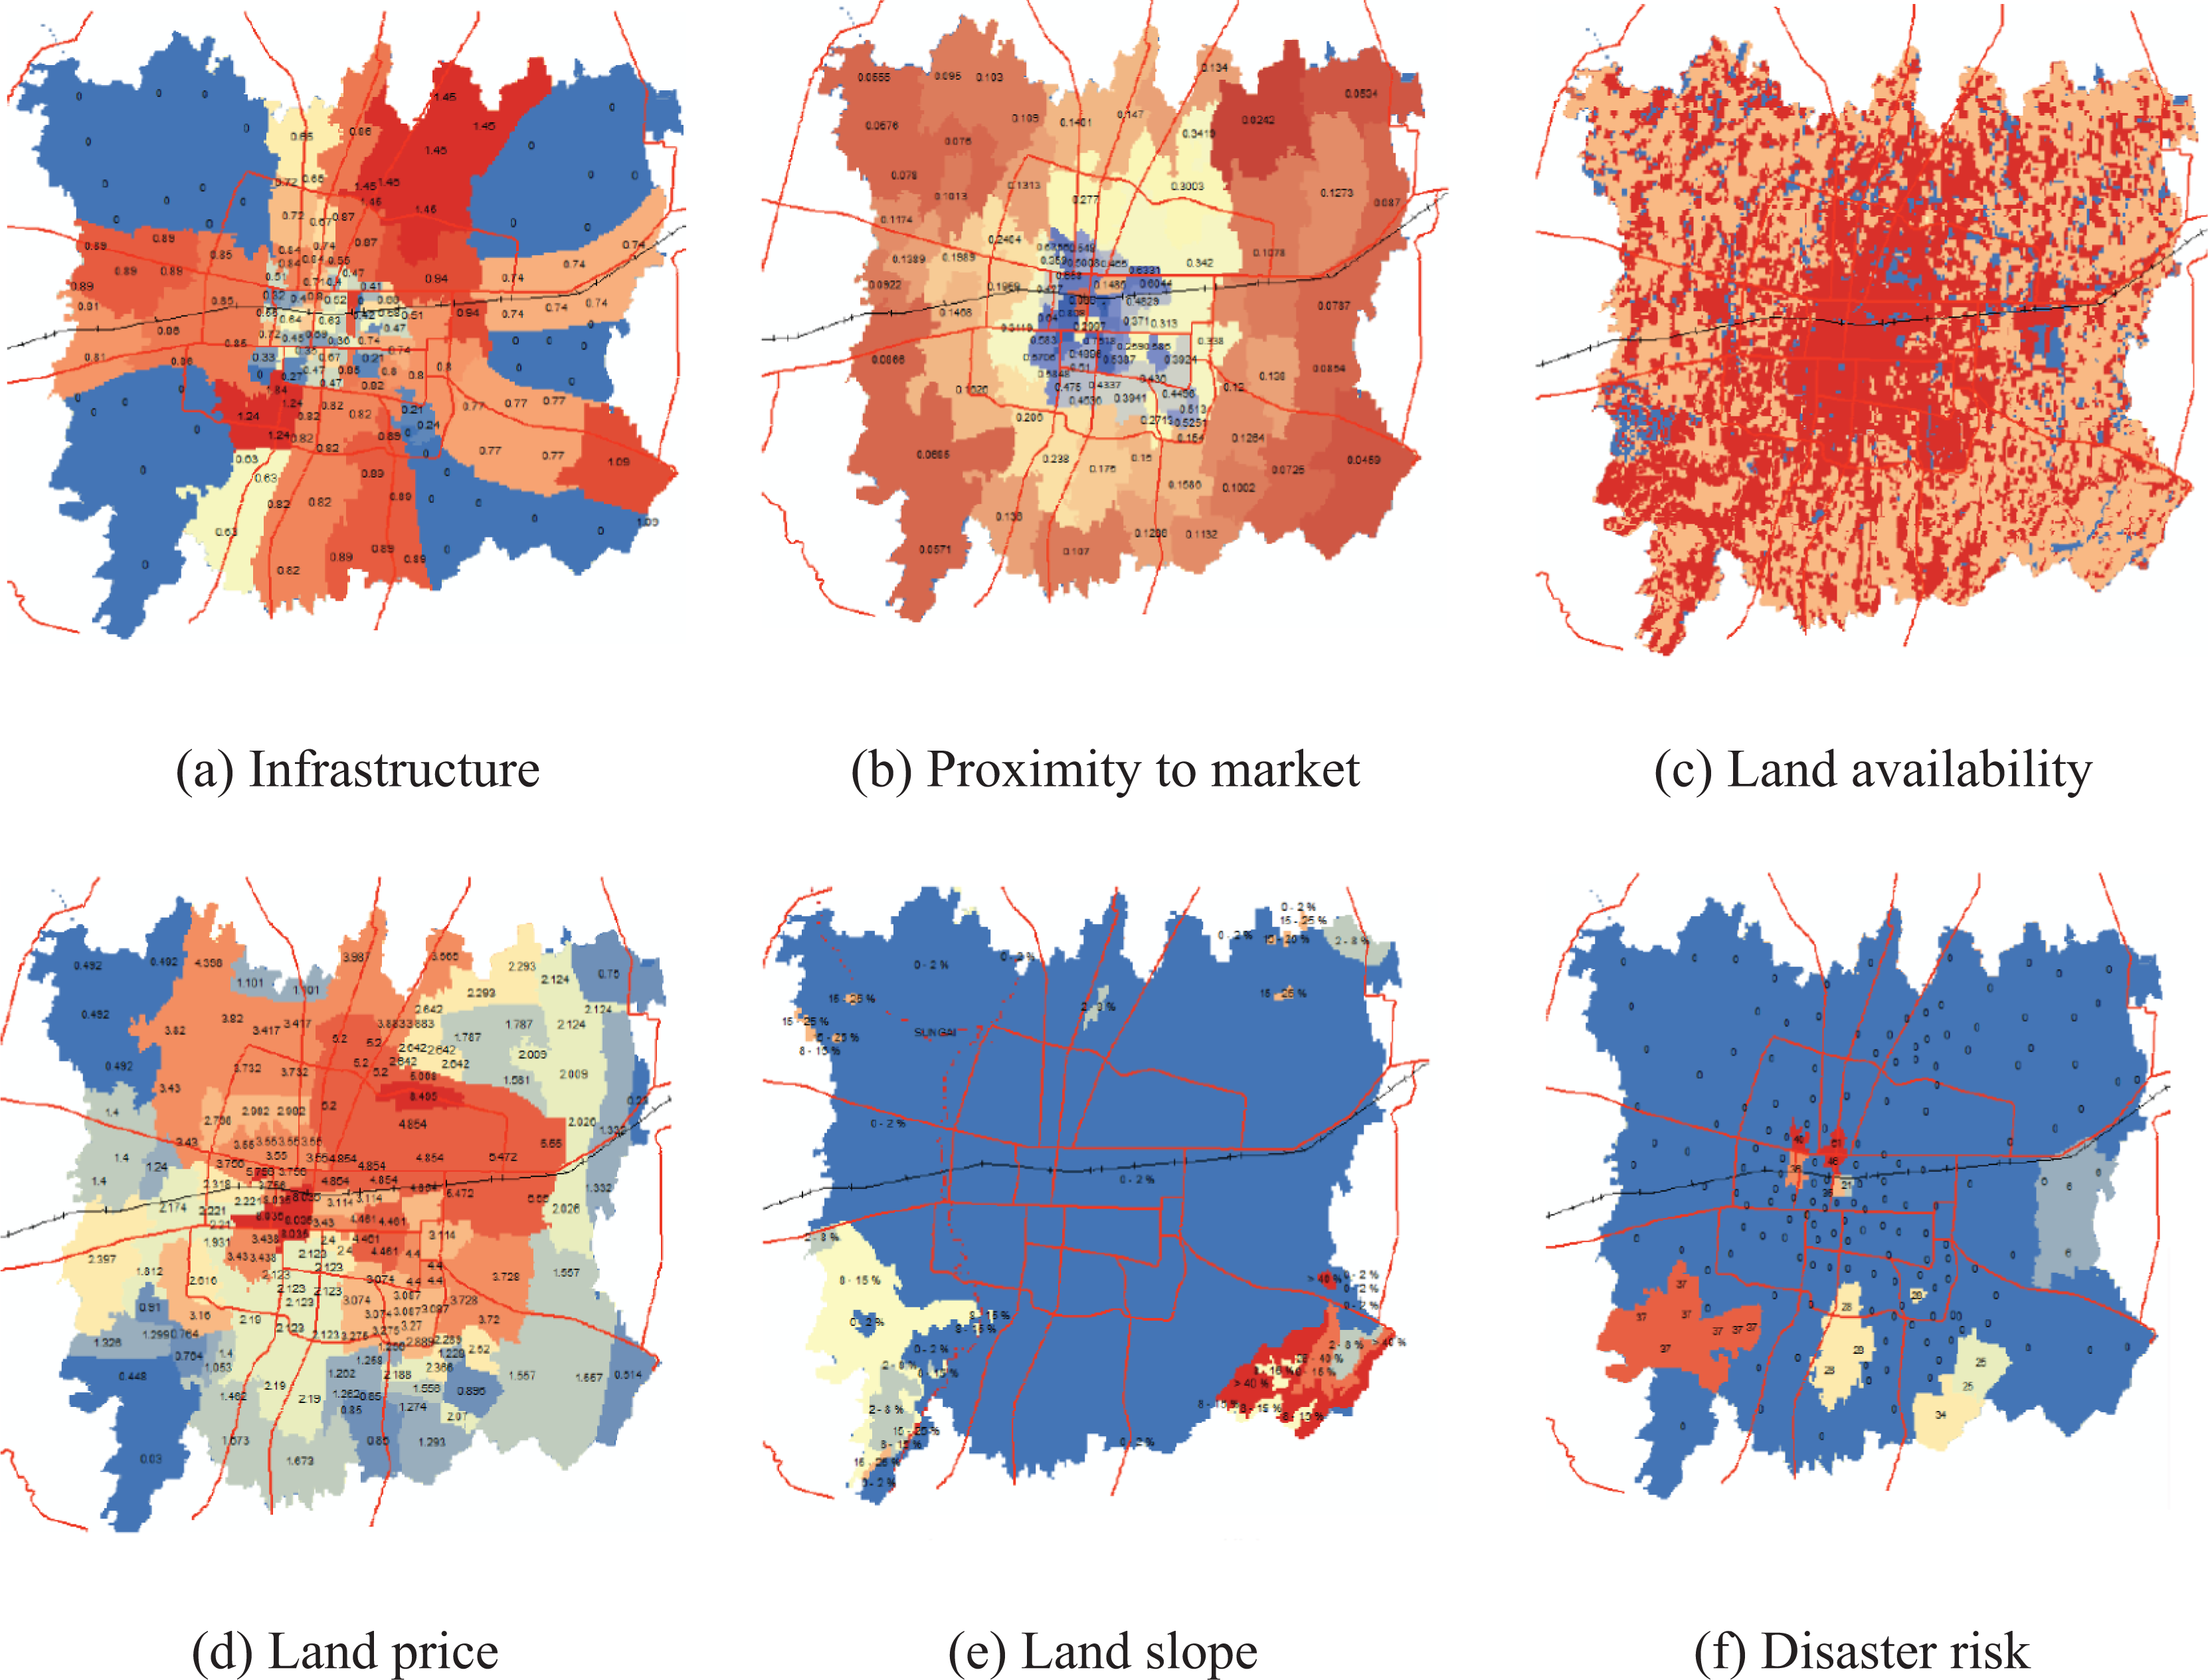
Spatial data of infrastructure (a), proximity to market (b), land availability (c), land price (d), land slope (e), and disaster risk index (f) with red representing non-potential areas and blue representing the most potential areas.
Indicators of spatial data of infrastructure, proximity to market, land availability, land price, land slope, and disaster risk and their sources.

Given the criteria, it is necessary to determine the relative importance of those criteria. AHP was implemented to obtain weights of the individual criteria (refer to the work by Saaty 27 for a detailed procedure of AHP). Following AHP procedure, pairwise comparisons between criteria were conducted. The pairwise comparison compared a criterion to another criterion so that the value of relative importance of each criterion was determined qualitatively. The relative importance was based on the subjective judgment that was acquired from an interview. The structured interview was conducted with senior business development manager who have worked in the field of warehouse and distribution for more than 10 years. The present study uses a 9-point scale to quantify the importance with scale of 1 refers to that the two criteria being compared are equally important and scale of 9 indicates that the one criterion is absolutely important over another. If the criterion i when compared to the criterion j has the value of 2, the criterion j has therefore the reciprocal value, that is, 0.5, when compared to the criterion i. After all comparison values are evaluated, the weight of each criterion can be examined.
However, inconsistency may occur. To ensure that the result was consistent, the consistency test was conducted by calculating consistency ratio (CR). CR was evaluated by using geometric mean. A local error value was also calculated in order to identify the consistency level of responses. The results were considered consistent if the CR value was less than or equal to 0.10. Tables 7 and 8 show pairwise comparison matrix based on the interview and weight of each criterion, respectively. The obtained weights were then used to evaluate overall spatial values by multiplying the weights and associated spatial data specified in Figure 2. This was done by using ArcGIS10 software.
Multiobjective mixed-integer linear programming
UDC location candidates obtained from spatial analysis were examined through MOMILP to acquire the optimum location of UDC by considering the trade-off between the total cost and the total CO2 emission. The description of the proposed mathematical model for UDC location is presented in four subsections: problem definition, model elements, model formulation, and multiobjective formulation.
Problem definition
The mathematical model regarding the UDC location problem is devoted to accommodate three echelons, namely, suppliers, UDCs, and retailers. Associated with each connection, transportation activities relate to both from suppliers to UDCs and from UDCs to retailers. Some assumptions are taken in developing the mathematical model, such as demand of all customers is known and deterministics, the product is not deteriorated along the chain, every demand is always satisfied by any suppliers through any UDCs, transportation capacity is unlimited, and the product is not stored in UDCs.
Most studies 9,20,28 use financial indicator as an optimization target. This present study addresses both total cost and total environmental impact. The total cost is composed of both investment cost and operational cost, whereas the environmental impact is measured using CO2 emission generated from transportation.
Model elements
UDC location model involves a set of parameters and decision variables as shown in Tables 2 and 3.
Parameters of the model.

UDC: urban distribution center.
Decision variables of the model.

UDC: urban distribution center.
Model formulation
The optimization model is divided into two parts: objective functions and constraints. The proposed model has two objectives, that is, to minimize the total cost and to minimize the total CO2 emission. The mathematical model is presented as follows: Objective functions:


The total quantity of goods delivered from a supplier to any UDC through any transportation should be less than or equal to the production capacity of the suppliers:

The total quantity of goods entering a UDC from any suppliers through any transportation should be less than or equal to the capacity of the UDC:

The total quantity of goods distributed from UDC to any retailers through any transportation must be less than or equal to the total quantity of goods that enters the associated UDC:

The total quantity of goods delivered from any UDC to a retailer must be greater than or equal to the demand of the respective retailer:

The flow of goods from a supplier to a UDC through a transportation and the flow of goods from a UDC to a retailer through a transportation should be greater than or equal to zero:

Binary variable, which is used to describe the existence of UDCs, is

Multiobjective formulation
As the mathematical model composes two conflicting objectives, a set of efficient solutions known as Pareto-optimal set may exist. A solution is considered Pareto-optimal when none of the objectives can be improved without sacrificing another objective. The present article uses a weighted sum method, a classical method that has been widely used to identify the optimal solution to the problem of multi-objective optimization. The weighted sum method changes the multi-objective optimization into single-objective by multiplying each objective function with a weight. Consequently, the multiobjective optimization is converted into a single-objective optimization problem using w 1 (weight for cost objective function) and w 2 (weight for CO2 emission objective function). The mathematical formulation using the weighted sum method is as follows:

The mathematical model was implemented in spreadsheet and computation for optimization purpose was conducted using Microsoft Excel Add-ins of OpenSolver 2.6.1.
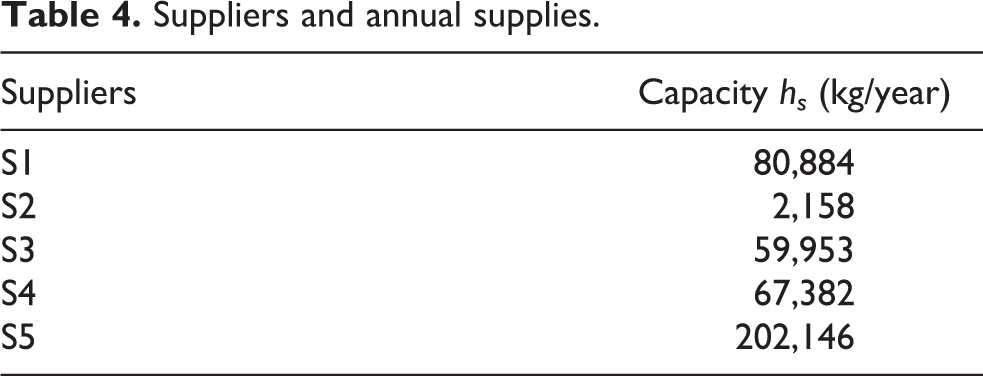
Supplier and demand data presented in Tables 4 and 5, respectively, was directly obtained from suppliers and retailers. The location of each supplier is shown in Figure 1, while retailer locations are spread all over the city with higher concentration in northeast part (Figure 3). Retailer demand is ranging from 261 to 27375 kg/yr with that the five highest demand retailers are located in the center and north part of the city. Detail retailers and their annual demand are provided in Table A1. Distance matrix was estimated from Google earth and available upon request. Freight capacity of 8000 ton and freight transport unit cost of Indonesian Rupiah (IDR) 3000/km were estimated from Department of Transportation. 22 Emission factor of 0.062 kg CO2/km was used. Fixed cost for each UDC candidate that constitutes land and construction costs is depicted in Table 6.
Suppliers and annual supplies.

Number of retailers and their total demand in certain demand ranges.

Fixed cost for establishing new UDC.
UDC: urban distribution center.

Heatmap of potential areas for urban distribution center (UDC) and selected UDC location candidates.
Results and discussions
This section is divided into two parts following the research objectives: potential UDC locations based on spatial analysis and optimized location of the UDC.
Potential UDC locations
Based on the interview, pairwise comparisons between each criterion following AHP procedure are shown in Table 7. Using AHP procedure, Table 8 shows the resulted weights of each criterion based on AHP analysis.
Pairwise comparisons following AHP.

AHP: analytical hierarchy process.
Weight of each criterion based on AHP analysis.

AHP: analytical hierarchy process; CI: consistency index; RI: random index; CR: consistency ratio.
The weights were then incorporated into the spatial data using ArcGIS. Overall spatial values that were obtained from the summation of weighted spatial data of infrastructure, proximity to market, land availability, land price, land slope, and disaster risk level are presented as heatmap, as shown in Figure 3. The heatmap demonstrates that the most potential areas are located at the outside of the city center.
There are however some potential areas that lie within the city center. However, the areas are not options because local regulation prohibits big-sized trucks to enter the city. In other words, the desirable locations for UDC are those that fall on the blue areas that are outside the arterial road. Seven candidates of UDC location are determined by selecting the most desirable locations that are as close as possible to the urban area. Figure 3 also presents the selected UDC candidates to be examined further in the next section. Moreover, the selected locations of UDC were among the candidate locations planned by the government.
Evaluation of potential UDC locations
The selected potential locations of UDC are then examined with respect to the total cost and the total CO2 emission. Conceptually, there exists a trade-off between cost and emission objective functions. The best solution for one objective function is often the worst solution for another objective. It implies that the solution of multiobjective optimization is not singular, rather a set of solutions that are called Pareto front.
Using the developed mathematical model, the Pareto front with weights of the total cost and the total CO2 emission being equal was evaluated. First assessment was conducted to identify the configuration of UDC candidates that result in the lowest cost, whereas second assessment was to identify the configuration of UDC candidates that resulted in the lowest emission. Other configurations were also evaluated (see Figure 4); however, only those that are the outermost regions of the set of alternative configurations are shown in Table 9. The set of configurations can be categorized as Pareto-optimal frontier as there is none of dominated solutions. Configuration 1 is better than configuration 2 when it comes to total cost, but configuration 2 is better than configuration 1 with respect to the CO2 emission.

Trade-off between the total cost and the total CO2 emission of Pareto-front.
Configurations of Pareto front.

UDH: urban distribution center.
*0 means UDC is closed, 1 means UDC is opened.
Figure 4 indicates that the trade-off between the total costs and the exhaust CO2 emission exists. The more opened UDCs, the lesser the CO2 emission and the higher the total cost. On the other hand, one opened UDC would lead to lesser incurred total cost but higher CO2 emission due to more frequent freight transportation activities. Figure 4 also shows that different configurations of UDC lead to different total costs and CO2 emissions. With respect to one opening UDC (configurations 1, 2, and 3), it appears that the location of UDC determines the total cost and emission.
Figure 5(a) further describes the change of the fixed-location cost, distribution cost, and total cost for different configurations of Pareto front. The distribution cost accounts for 5–15% of the total cost. The figure further indicates that although the configurations 1, 2, and 3 consist of one UDC, they have different costs implication due to different locations. It implies that location indeed affects the distribution activities. Among them, configuration 3 gives the lowest distribution cost, but highest fixed-location cost and eventually highest total cost. As the number of UDC increases (see configurations 3, 4, and 5), the fixed-location cost and the total cost are sharply increasing. However, it is interesting to note that the distribution cost of using two UDCs and three UDCs is almost similar. It entails that providing more than two UDCs at the outskirt of the city would be no longer reducing the distribution cost. Further, Figure 5(b) depicts that, in line with the distribution cost, the CO2 emission gets lower for different locations of UDC. The increased number of opening UDCs also leads to reduced the CO2 emission. However, with more than two opening UDCs (see configuration 5), the distribution cost does not change and neither does the CO2 emission. It indicates that two opening UDCs are sufficient to reduce both the distribution cost and the CO2 emission. The results may imply that satellite UDC might be another alternative to further reduce the distribution cost.
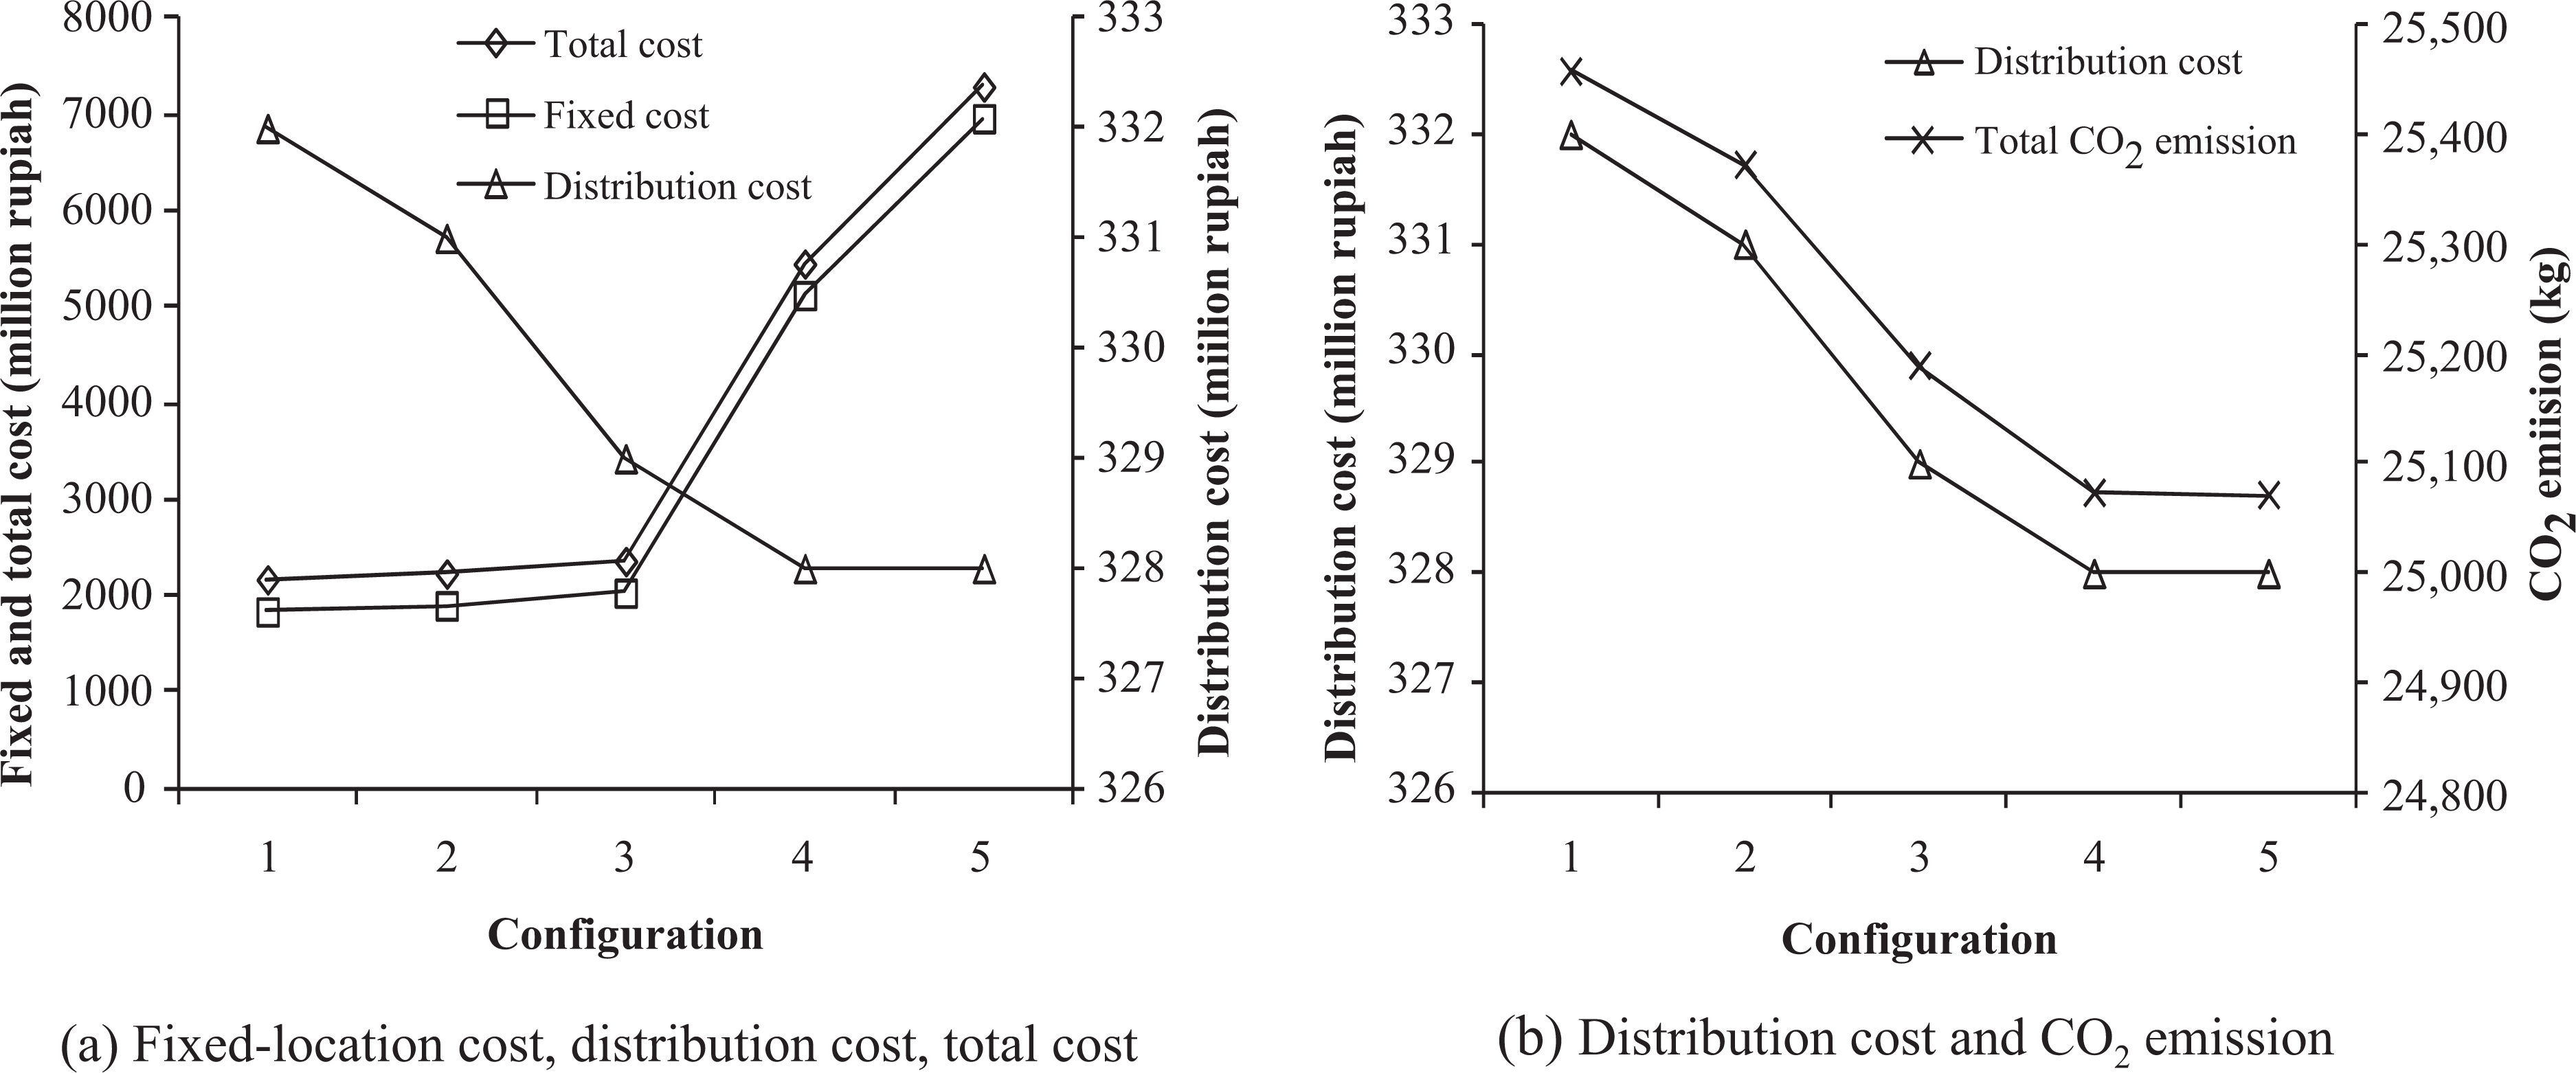
Fixed-location cost, distribution cost, total cost and distribution cost, and CO2 emission for each configuration.
To summarize, the results suggest that there are four configuration candidates for the future UDC—each of which has its associated costs and CO2 emission. With respect to economical and environmental considerations, configuration 3 appears to be the best location of future UDC (eastern part of the city outskirt) as the configuration gives higher saving of the CO2 emission for every unit cost spent. It is also worth to mention that more than two opening UDCs do not necessarily reduce distribution activities and the emission in the studied case because the UDC locations are not optimal. The prospective locations that can reduce the distribution activities further might not be appropriate with respect to demographical, geographical, and social perspectives based on the spatial analysis.
Conclusion
This study has demonstrated the combined approach of spatial analysis and MOMILP to determine the potential location of UDC by addressing economy, environmental, and social aspects. The combined approach enables to support better and more realistic decision-making related to UDC location. The results have indicated that the optimum location of UDC for sugar commodity is suggested to be at the east part of the Yogyakarta city. Establishing two UDCs results in reduced the CO2 emission than opening one UDC. Furthermore, opening more than two UDCs in the studied case appears to be not economically and environmentally beneficial. Although the research has met the objectives, some limitations need to be highlighted. First, transportation cost from UDC(s) to retailers was evaluated based on direct delivery. Indeed, freight transport normally visits many retailers following predefined optimal route before returning to the UDC. Second, as the research only deals with one commodity product, a multicommodity product is necessary for future research to represent the case even more realistic. Third, it is also interesting to analyze whether the proposed methodology can be applied to other city with respect to UDC location problem. It is believed that the mathematical model should be stable over products and cities, but the factors used for spatial analysis might vary. For example, disaster risk factor is substantial in this studied case; however, in cities that are less prone to disaster, the factor may be less important. Avenues for future research may focus on the integration of location-routing problem, expanding toward multicommodities and applying the combined approach to different contexts.
Last but not least, the present study provides theoretical and managerial contributions. The study has contributed to the development and the demonstration of the combined ranking and optimization approaches. By the combined approach, it is expected that the suggested UDC location is technically feasible, economically beneficial, and socially acceptable. From managerial perspective, the study provides insight that trade-off between transportation cost and CO2 emission exists. It is worth to note that more UDC does not necessarily decrease the CO2 emission. It is, therefore, necessary to investigate the trade-off profile between the total cost and the CO2 emission.
Footnotes
Declaration of Conflicting Interests
The author(s) declared no potential conflicts of interest with respect to the research, authorship, and/or publication of this article.
Funding
The author(s) received no financial support for the research, authorship, and/or publication of this article.
Appendix 1
Retailers and their annual demand.

| Retailers | Demand dr (kg/year) | Retailers | Demand dr (kg/year) | Retailers | Demand dr (kg/year) | Retailers | Demand dr (kg/year) |
|---|---|---|---|---|---|---|---|
| R1 | 652 | R29 | 304 | R47 | 3042 | R70 | 1304 |
| R2 | 652 | R30 | 4563 | R48 | 4563 | R71 | 3042 |
| R3 | 3042 | R24 | 2920 | R49 | 9125 | R72 | 9125 |
| R4 | 2281 | R25 | 1304 | R50 | 3042 | R73 | 261 |
| R5 | 2607 | R26 | 2607 | R51 | 3042 | R74 | 3042 |
| R6 | 6083 | R27 | 1304 | R52 | 9125 | R75 | 3042 |
| R7 | 6083 | R28 | 652 | R53 | 2607 | R76 | 3042 |
| R8 | 3042 | R31 | 3042 | R54 | 3042 | R77 | 9125 |
| R9 | 17,885 | R32 | 1304 | R55 | 3042 | R78 | 9125 |
| R10 | 4563 | R33 | 9125 | R56 | 9125 | R79 | 18,250 |
| R11 | 2607 | R34 | 9125 | R57 | 2607 | R80 | 9125 |
| R12 | 1304 | R35 | 10,950 | R58 | 2607 | R81 | 9125 |
| R13 | 1825 | R36 | 1304 | R59 | 1304 | R82 | 9125 |
| R14 | 3042 | R37 | 1304 | R60 | 304 | R83 | 9125 |
| R15 | 4563 | R38 | 9125 | R61 | 3042 | R84 | 9125 |
| R16 | 3042 | R39 | 1304 | R62 | 2190 | R85 | 9125 |
| R17 | 1825 | R40 | 1304 | R63 | 304 | R86 | 1304 |
| R18 | 652 | R41 | 1825 | R64 | 3042 | R87 | 4563 |
| R19 | 1304 | R42 | 2607 | R65 | 1304 | R88 | 1043 |
| R20 | 4563 | R43 | 27,375 | R66 | 4563 | R89 | 3650 |
| R21 | 2607 | R44 | 27,375 | R67 | 3042 | ||
| R22 | 652 | R45 | 1304 | R68 | 2607 | ||
| R23 | 6083 | R46 | 9125 | R69 | 3650 |