
Abstract
It is widely known that market orientation (MO) and customer value help companies achieve sustainable sales growth over time. Nevertheless, one cannot ignore the existence of a gap on how to measure this relationship. Following this idea, this study proposes six fuzzy key performance indicators that aims to measure customer retention and loyalty of the portfolio. The work uses 300 sales executives. This exploratory study concludes that indicators such as MO, customer orientation (CO), degree of CO value of sales force, innovation capability, lifetime value, and customer service quality positively influence customer retention and loyalty portfolio.
Introduction
Key performance indicators (KPI) help senior managers measure the performance of their organization with an integrated global vision on a balanced scorecard (BSC). 1 In this respect, organizations assess performance and achieve long-term success. The benefits these indicators lie within the evaluation standards applied on staff performance, defining criteria for the evaluation of human resource development, identifying valid interventions, and defining new organizational objectives. 2
A number of studies suggest that market orientation (MO) and customer value aid companies to achieve sustainable sales growth over time. 3 This could possibly be attributed to the sales force, in which in this case, is also capable of meeting the needs of customers 4 establishing a long-term relationship. Moreover, the aim of this relationship should be focus on their loyalty and consequently transform it into the most valuable asset of the company. 5 This brings out a reflection on the relevance the study has on existing synergies in customer relationships 6 over time and not just the presence of their transactions. For this reason, in order to obtain better financial results, a clear MO is needed. 7 In other words, it is fundamental to obtain, analyze, and communicate information and consequently respond to the facts collected. 8
Considering the facts mentioned above, the research proposes fuzzy key indicators for the management to study customer retention and their loyalty. The proposed model derives from the relationship analyzed through indicators such as “MO,” “customer orientation (CO),” “innovation,” “profile of the sales force,” “customer lifetime value (CLV),” and “quality of service.” The empirical study presented throughout this article comprises of the data collection of the sales force within a Chilean mobile phone company.
The article is organized as follows: section “Conceptual framework and hypothesis development” provides a literature review through a conceptual framework as well as the hypothesis development. Followed by the proposal of the methodology in section “Methodology.” The analysis of the case study is applied and discussed in section “Empirical results and discussion” finalizing with the main conclusions in section “Conclusions.”
Conceptual framework and hypothesis development
Customer value orientation is understood initially to be the value perceived by a customer based on the relationship experience attained with the company, which must be powered by the same. 8 These strategic elements imply that a company receives from its customers a different level of value. Consequently, the modern approach to sales and marketing aims at creating value and establishing a relationship between the parties under a long-term win–win perspective. 9
From the demand’s point of view, “value” encompasses all dimensions and variables that customer really value and subsequently influences their purchase decision-making process. For this reason, the company should know these dimensions as well as how they rank and weigh, therefore, increasing the level of satisfaction (meeting or exceeding the firm’s expectations) to furthermore maintain lasting relationships. 9
There are an endless number of definitions of customer value mostly based on Zeithmal’s definition. 10 Zeithmal explores the concepts of perceived price, perceived quality, and perceived value, concluding that customers “think value is” attained in four ways: (1) “low price”; (2) “what I want from a product”; (3) “ quality I get for the price I pay”; and (4) “what I get for what I give.”
Woodruff 11 defines the value to the customer being a primary purpose of the value chain, focused in the desired attributes of the product, the fulfillment of the objectives and purposes of the client. Parasuraman 12 deepens the analysis that customer value may change depending on the stage of the customer life cycle, purchase stage (prepurchase, post-purchase), and long-term criteria for the assessment of value. 13
Considering all the above, the question lies on how the organization can acquire customer value? First, it is essential that firms obtain marketing information systems in order to store, debug, sort, and update large amounts of data. Secondly, it is necessary to implement management strategies to generate knowledge on customer value. Value should be based on performance results, determined by the customer in reference to deliver value, measured through among others sales, purchasing intentions, customer retention rates, and degree of satisfaction. 13 Measuring clients as well as staff recommendations and suggestions has a positive effect on the creation of value. 14 This type of feedback can be found in a linguistic format and therefore needs to be transformed into a quantitative indicator in order to improve its understanding within management teams of the companies.
Fuzzy KPI
During recent years, the study on “KPI” has increased significantly driven by business needs affected by the current business environment. Pioneers on this subject state that KPI was popularized after it was once called “management for objectives” 15 and was taken later up by the “movement” of performance measurement. 16
The beginnings of the fuzzy logic pertain to the investigations conducted by Zadeh, 17,18 in which he presented a number of sets lacking clear or exact limitations, noting that they play an important role in the recognition of forms, interpretations of definitions, and abstractions. In this respect, specifying that the elements pertain in certain degree to a set. Following this idea, the main contribution of this theory is that it allows the study of ambiguity, expressing the most logical relations related to human expression, “natural language,” Calabrece et al. 19 When referring to fuzzy logic, it must be understood that the concept is basically subjacent, hence a linguistic variable, and therefore, it is a variable of which its values are words and not numbers. 20
The idea behind fuzzy sets indicates that “given a referential set, subsets are build, in such a way that the function of membership µA(u), or the degree of membership, can attain its values not only from set {0,1} but also from the segment [0, 1]”. In this respect, “0” and “1” are also intermediate values. This way a value will designate nearer to the unit the closer it is to the element, considering the property or established proposal; noting the element’s degree of membership “u” to set A. Moreover, the degree in which the element “u” has the attribute of “A.” 21
The semantic concepts applied in the presentations and diagrams of the performance measurement systems are rarely elaborated considering these attributions. Nevertheless, the users have the necessity to adapt, in a flexible manner, the representation of their own taste complemented with textual explanations. 22
The fuzzy KPI developed with linguistic data allows the measurement of the level of organizational performance on uncertainty. These indicators contribute to the delivery of knowledge, based on qualitative information, captured through closed questions with a standard fixed text and the open question with free text, like, for example, used on polls, publications on among others, Twitter, Facebook, blog, and so on. 23
Considering the above mentioned, the following conceptual model is proposed (Figure 1).

Conceptual proposed model.
The CLV
24
concept takes into consideration that a company’s long-term value is determined largely by the value of their entire customer base, existing and potential, which is called customer equity. Moreover, this measurement is useful for identifying the most profitable customer and distributes resources according to the value that such buyers bring.
25
Based on that:
Day and Wensley
26
propose a source of differentiation that companies apply to their workers who have skills and drivers that enable better performance, creating an inimitable competitive advantage. In this regard, the company must have the guideline to resolve and meet the needs of sellers.
27
This leads to the following hypothesis:
Innovation is considered as the implementation of new ideas, products, or processes.
28
This helps break the inertia of the markets,
28
having a positive impact on the long-term success improving performance and creating knowledge and skills.
29
This leads to the following hypothesis:
The best way to ensure loyalty, customer retention, and increased market share is a clear focus on the needs of current and potential customers.
8
In fact, this would have a direct and positive effect on economic or financial value of the company. Therefore, the value of a company’s long-term period is determined largely by the value of their entire customer base.
6
The following hypothesis is proposed:
Customer-oriented employees should help create stable relationships, increase customer–company cooperation, and create value.
30
Subsequently, an organization with a high degree of MO tends to actively encourage their employees to adopt thoughts and behaviors to guide, care, or benefit the client. In fact, the degree to which the service is adapted to customer needs has a direct effect on loyalty intentions, which is three times stronger than the indirect effect of customer satisfaction.
31
In this respect, customer focus by sellers leads to higher sales volume through the increase in cross sales,
32
customer retention, and immediate purchases
33
:
Customer-oriented firms regard consumers as an asset to the company; therefore, firms focus their activities on meeting the client’s needs.
34
In this context, the customer retention rate, that is, the probability that an individual customer will remain loyal to a company and continue to produce the expected income, is a variable directly related to the customers lifetime value.
35
Based on that:
A number of studies indicate that a better understanding of customers causes positive changes in client management portfolio
36
as well as sales results. Therefore, firms should be carefully allocating customers with a higher value for the companies since they are the ones that bring success to the company.
37
This leads to the following hypothesis:
Fritz
38
states that human resources within organizations must be a central resource. Valenzuela
6
suggests that a sales force oriented toward the customer generates a positive reciprocity to the clients via positive word of mouth and, subsequently, increasing loyalty, attracting additional customers, and generating further value for all parties involved. This leads to the following hypothesis:
CO through sales force is understood as the ability of the salesperson to help its customers through the client’s commitment, obtaining improved quality of services perceived and increasing customer satisfaction.
31,39
This leads to the following hypothesis:
The development and introduction of new products leads to an improvement in competitiveness and business performance. New products require complex efforts if companies wish to remain competitive in the dynamic global market.
40
Moreover, research demonstrates that the existence of a strong MO is a determining factor in a way that influences the perceived quality of service.
41
This leads to the following hypothesis:
Customer satisfaction enables firms to lead in brand loyalty and high income. Consequently, the key to avoiding customer leaks toward the competition is to achieve a sustainable satisfaction,
42,43
which is an emotional connection beyond behavioral and attitudinal. Arising to the following hypothesis:
Methodology
The design of this research is considered as a tool to capture information with a structured seven-point Likert-type scale, where “1” corresponds to Strongly disagree and “7” to Strongly agree. The methodology applied for evaluation is consistent with a series of investigations carried out on measuring the perceptions of stakeholders. 14,44 –46 Experts in the telecom study reviewed the instrument and a pretest was applied. The target population has been defined as the sales executives from a Chilean company of mobile phones. Subsequently, the target population was divided into the following groups. Firstly, individualized management executives: Sales executives who work with a defined customer base in which a relationship exists through constant communication (executives lower turnover). Secondly, the non-individualized management executives: Sales executives seeking every day opportunities with nonvalid clients, new and/or from competitors. Finally, the third group comprised of executives from the metropolitan region of Santiago versus executives from other regions of Chile. The sampling was not probabilistic by installments. The final sample accounted for 300 people surveyed.
For the analysis of the proposed approach, the model was reviewed unidimensionally. Convergent validity and reliability of the constructs were revised under the following criteria: Kayser–Meyer–Olkin greater than 0.6, Eigenvalue greater than 1, the Bartlett’s test of sphericity less than 0.5, factor loadings greater than 0.7, and Cronbach’s α greater than 0.7.
The method used to develop fuzzy key management of customer retention is based on fuzzy inference systems. These methods are very representative of human thought; they represent knowledge and inaccurate data. For instance, studies support that methods based on a fuzzy theory are able to convert the decision-makers’ relative judgments into priorities for aspects. 19,47 –49 This model of inference is based on the proposal of Zadeh.17,18
As mentioned in previous sections, a diffuse linguistic variable is a variable that has value expressed in linguistic terms that compose the fuzzy set A of (g + 1) elements:

Each and every element has a degree of membership to the set A, given by the number of members of the function µT ∼(X), as an extention to the classical notion of membership to a set, where the element belongs or not to the set. As a complement, the theory of diffused subset provides a gradual evaluation of the composition of the elements within set A, providing a description of the linguistic terminology. In this study, triangular diffuse numbers were applied, T = (l, m, u), where l ≤ m ≤ u and l ≥ 0.
The “degree of membership” function has been defined as follows:

It defines a nonlinear mapping between one or more input variables (input) and output variable (output). 50,51
Empirical results and discussion
To set the value of the commercial premium, insurance policies are divided into five risk profiles. A group of experts, each one from a market segment, forecast for the profile that corresponds to the expected benefits of different pricing values considering different surcharge alternatives and economic scenarios.
The final sample of the 300 people surveyed comprised of 57% males, which corresponds to 170 surveys. Women contributed to the study by 43% corresponding to 130 surveys. Regarding the age of the sample, 77.5% of respondents were between 26 years and 45 years. Executives were distributed evenly with a share of 50% individualized management and not individualized management with 50%. That is, the sample is composed of 150 cases representing each group. Furthermore, 37.1% of the sample had been employed at the company less than 6 months and 42.4% of the sample had worked more than 1 year, which represents 128 respondents.
Scale validation
All constructs were measured together in a factor with a level of statistical significance that supports the unidimensional of each of the constructs. The Kayser-Meyer-Olkin (KMO) was greater than 0.5. The Cronbach’s αs were all greater than 0.7 (Table 1).
Unidimensional of the scale.

DOCS: Degree or orientation to the customer value of the sales; AI: ability to innovate; CO: customer orientation; MO: market orientation; CLV: customer lifetime value; RLP: retention and loyalty of the portfolio; SQ: service quality.
Results
In order to observe the significant differences among the four groups of interest (individualized and non-individualized management, metropolitan region and other regions), a series of analysis of variance tests have been performed. In general, it is possible to observe that there are no significant differences for all the constructs in the variables of executive type, age, and sex.
Nevertheless, in reference to the degree of orientation to customer value by sales force, customer profitability, and innovation capacity, significant differences have been observed when analyzing them against the time variable. Executives who have been in their companies for a longer period under the study (1 to 2 years or more) have a higher degree of customer value orientation, innovation capability, and customer profitability than those who have been in their companies less time. It was also possible to observe significant differences for the constructs, CO, MO, and value of customer lifetime respect to the variable workplace. Hence, executives from regions perceived greater by the executives of the metropolitan region. On the other hand, the quality of service is not be related to any of the constructs tested. This is relevant because it leaves open the search for the reasons include on this topic, which, as noted, has an important role in customer satisfaction.
Hypothesis corroboration
To corroborate the hypothesis, we analyze the correlations between the constructs. All relationships were found to be positive. Those who possess higher correlation are CO and MO (0.711) following the relationship between MO and innovation (0.553) and of CLV and MO (0.576; Table 2).
Correlations matrix.

DOCS: degree or orientation to the customer value of the sales; AI: ability to innovate; CO: customer orientation; MO: market orientation; CLV: customer lifetime value; RLP: retention and loyalty of the portfolio; SQ: service quality.
With the aim of verifying the proposed model, a linear regression analysis was performed between the constructs. As can be seen, the 12 hypotheses are tested with a statistical significance of 0, less than 0.05 required to validate, with a 95% confidence level. Furthermore, all relationships between the constructs are positive, with different levels of impact depending upon the value of the β (Table 3).
Linear regressions.

Fuzzy inference implementation
At this stage of the research, we aim to provide a solution for the analysis of the opinions entered by customers in a survey and transformed into performance indicators for organizations. The diffused inference system used is Mamdani and Assilian, 52 perfect for sets of linguistic rules (Figure 2).
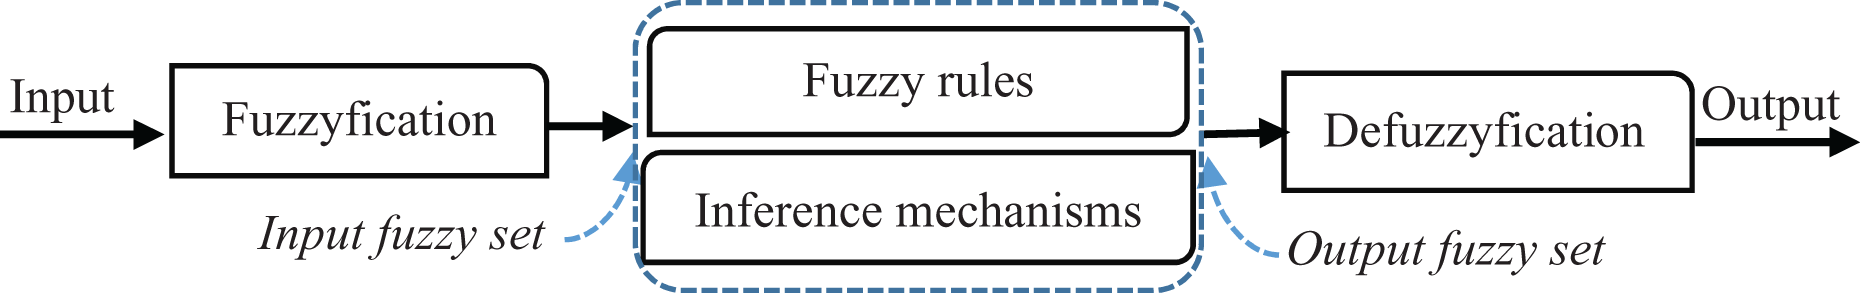
Stages of a fuzzy inference system. Source: Fuzzy interface module belonging to MATLAB. Adapted from Jang et al. 14
The proposed Mamdani fuzzy inference system is based on the theory of fuzzy sets. To set as a reference so that subsets of the membership function, µA(u), can not only take values in the set {0,1} but in the segment [0,1], so that a little more value close to unity, the closer to comply with the element considered or established proposition, indicating the degree of membership of the element to the set a. That is, the degree to which the element “u” has the attribute of “A.” 21
Usually the fuzzy subsets are represented as:

where, µA(u) is called the degree of membership of the element “or” the set A (equation 1). The transition from value between “0” and “1” is gradual, based on that: “A proposition can be both true and false, by assigning a grade to the truth and falsehood.” 21 The most important feature of these numbers is that they are likely to represent phenomena from objective or subjective estimates. Linguistic associations, defined by a word or adjective linguistic label, 53,54 form these sets. For the analysis, Matlab software 2013a was used, and it has the fuzzy inference module.
Fuzzy controller design
For the design, we established a range of substantial operations, which were a result of acquisition of values from minimum to maximum for both inputs to outputs. The same grouping was considered for each construct.
Thus, the design of the structure for outputs considered a scale measuring from 1 to 3 points, where “1” corresponds to Bad (responses between 1 and 2) and “3” to Good, with responses values between 4 and 5. On the other hand, the structure for inputs is wider, it’s considered a scales measuring from 1 to 5 points, where “1” corresponds to Very bad (with responses values 1 and 2) and “5” to Excellent (responses between 6 and 7).
Fuzzification of membership functions
Fuzzification considers membership functions as trapezoidal functions in order to consider the tolerances in case a range falls or rises beyond their limits. For the rest of the process, triangular functions have been used (Figure 3).
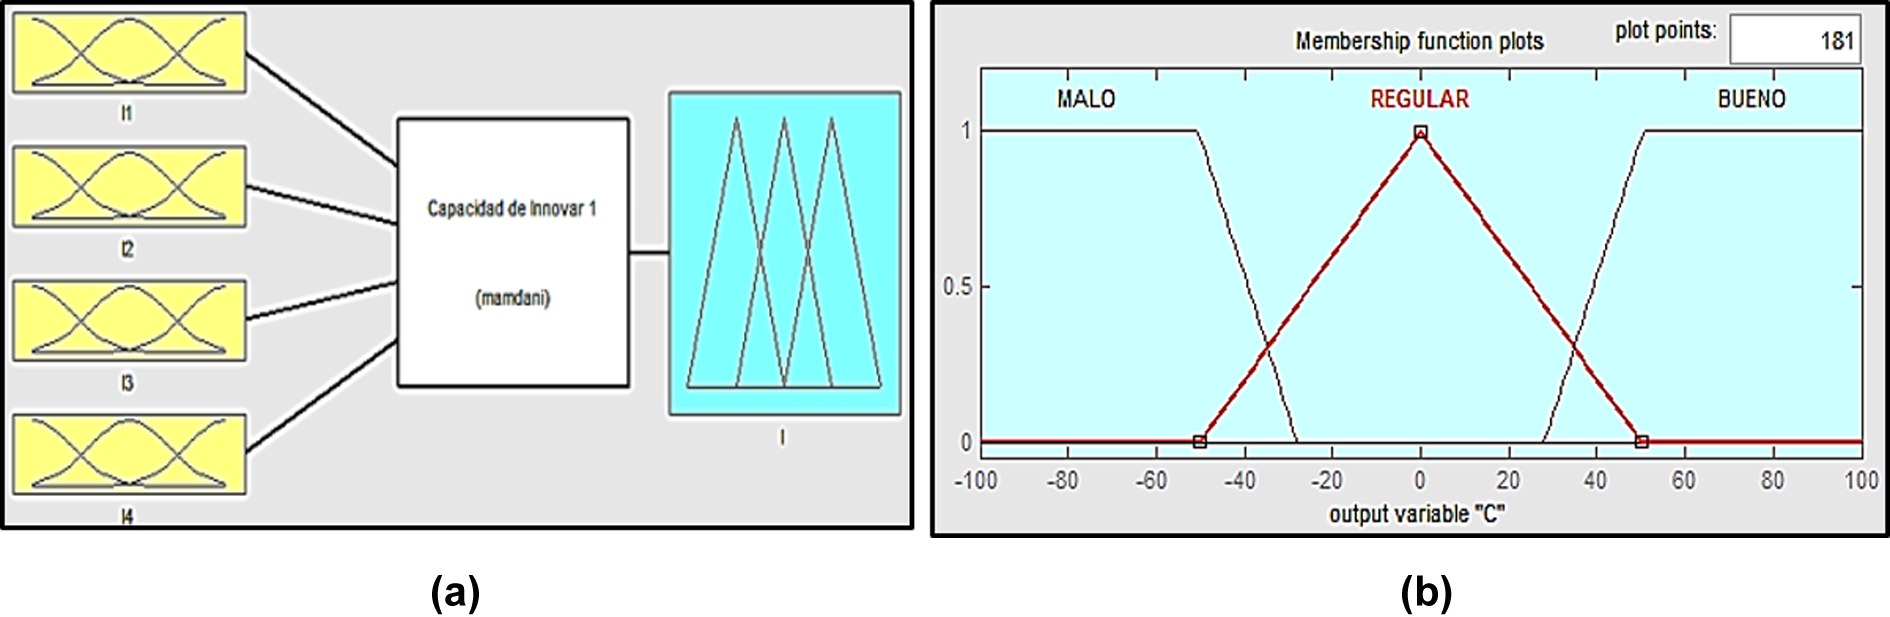
(a) Variable example input and (b) variable example output.
Unlike traditional analysis, with the fuzzy control when there is the possibility at an intersection of two ranges, it automatically calculates the centroid (average of highs) thereof resulting in a single value. Thus, fuzzy indicators obtained (Figure 4) can take a value in the range (−100% to 100%), which indicates the presence of positive indicators numerically.

Model with fuzzy indicators on customer retention management.
Conclusions
Until recent years, the company only analyzed the quantitative data with computers. However, the recent linguistic labels contribution is allowing hurting the essence of some explanations or comments turning it into numeric values “classic.” This method of treatment for these values will reflect mathematically the reasoning of clients by factors of rational type and emotional influences. Therefore, the fuzzy indicators suggested have an advantage over the classical measures and the ability to work with not exact information, that is, fuzzy information, which more accurately represents what the customers express.
The study investigated the variables that explain customer RLP. The results indicate that the proposed model is confirmed, showing that the variables, MO, CO, degree of CLV orientation that the sales force, innovation capability, CLV, and quality of service positively influence RLP.
In particular, in the telecommunications industry, under the scenario of number portability, this study provides important recommendations to improve the management of customer relationships from a long-term perspective, as in the case of MO that most of the items present relatively low (average of 4.4) response. Then, MO becomes an opportunity for improvement to avoid massive client leaks. 8 In this regard, it is essential that marketers strive to strengthen the personal and social level and its long-term relationship with buyers. 55
Innovation is another point that should be strengthened (average around 4). Perhaps, this can be a signal to current telecommunications companies to worry about capturing new ideas from the vendors, who are finally the ones who have the closest relationship with the customer, and who, in turn, try day by day to improve the profitability of each one offering more and better benefits. CO directly affects the profitability of the portfolio of customers, so it should enrich the sellers of valuable information regarding changes in preferences, brand evolution, aspects of decision-making, satisfaction elements, among others. Regarding the differences between the sales forces, there is no significant differences between the constructs, depending on the variable type of executive. However, there are differences in the varying of time by executives in a company and workplace. This could be for two reasons: (1) executives who have been in the company for a longer period of time are more likely to engage in longer term relationships with its customers and (2) the cultural differences between people who live in the capital and in regions.
The limitations of this study relate to the sample collection, since the respondents are limited to sales executives of a particular company and a particular segment. The results obtained from the measurement scale given help generate progress in the determination of the variables that affect the retention and loyalty of the clients portfolio. Therefore, it is a challenge to debug and implement other service industries to different segments and in different cultural contexts. This model could be evaluated in different dimensions with a more heterogeneous sample of the market.
Footnotes
Declaration of conflicting interests
The author(s) declared no potential conflicts of interest with respect to the research, authorship, and/or publication of this article.
Funding
The author(s) disclosed receipt of the following financial support for the research, authorship, and/or publication of this article: This work was supported by FONDECYT Chile (Project no. 11100163).