
Abstract
Childhood and adolescence are critical periods for the maturation of functional brain networks, supporting cognitive and behavioral development. While normative developmental trajectories of functional networks have been well documented, patterns of individual variability and their developmental changes remain to be clarified. Using cross-sectional resting-state functional magnetic resonance imaging datasets from 257 children (aged 6–12 years) and 60 healthy adults (aged 18–29 years), the authors characterized the spatial organization of individual variability in functional networks and its developmental progression. Additionally, a longitudinal resting-state functional magnetic resonance imaging dataset of 137 children (baseline age 6–12 years) was used to examine the individual uniqueness of functional network organization over an approximately one-year developmental interval. In children and adolescents, individual variability exhibited an adultlike spatially heterogeneous pattern, with lower variability mainly in primary visual and sensorimotor cortices and higher values primarily in association regions (e.g., frontoparietal network) involved in higher-order cognition. Spatial similarity to the adult variability pattern increased linearly with age. Developmental changes in individual variability were functional-systems-specific, showing a significant decrease in the visual system but relatively modest changes in the default mode and ventral/dorsal attention systems. Longitudinal identification analyses further demonstrated high individual discriminability based on whole-brain connectivity, as well as higher-order systems including the frontoparietal, default mode, and dorsal attention networks. These findings advance understanding of how individual-variability and individual-specific functional-connectivity signatures are organized and evolve during late childhood, providing a developmental reference for connectome-based individualized characterization.
Keywords
Introduction
During childhood and adolescence, the brain undergoes substantial maturation, accompanied by progressive refinement of motor, cognitive, and social interaction abilities. Advances in resting-state functional magnetic resonance imaging (rs-fMRI) and human connectomics have provided powerful tools for mapping the brain's intrinsic functional networks (Biswal et al., 1995; Fox & Raichle, 2007; He & Evans, 2010). Functional brain networks undergo fine-grained reorganization throughout childhood and adolescence. At the connectivity level, developmental maturation is characterized by a shift from predominantly local connectivity toward stronger long-range interactions, accompanied by increasing functional integration and segregation within large-scale networks (Fair et al., 2009; Luo et al., 2024; Supekar et al., 2009; Tooley et al., 2022). At the modular level, the maturation of large-scale systems such as the default mode network becomes increasingly consolidated and adultlike across development, reflecting strengthening within-network coherence and refinement of network organization (Fair et al., 2009; Fan et al., 2021; Supekar et al., 2010). However, although previous studies have described typical developmental changes in functional brain networks in detail, individual differences in these networks and how they develop during childhood and adolescence remain insufficiently understood.
Individual variability in brain structure and function may underlie individual differences in cognitive and behavioral performance (Amunts et al., 2000; Burgel et al., 2006; Grabner et al., 2007; Kanai & Rees, 2011; Mangin et al., 2004; Newman et al., 2003; Rypma & D’Esposito, 1999). Prior research in adults has shown that the functional-connectivity profiles of brain regions vary substantially across individuals, with greater variability in association cortices and lower variability in primary sensory and motor regions (Mueller et al., 2013). Such variability in functional connectivity has been observed as early as the third trimester and continues to change markedly with age from approximately 30 weeks of gestation to 2 years of age (Gao et al., 2015; Stoecklein et al., 2020; Xu et al., 2019). Moreover, recent evidence suggests that developmental changes in individual variability are organized along a connectional axis and linked to cognitive function (Yang et al., 2025). Further studies have demonstrated that functional-connectivity patterns are individually distinctive and can serve as “brain fingerprints” to identify individuals within a group, with frontoparietal networks related to higher-order cognitive functions making particularly important contributions (Airan et al., 2016; Finn et al., 2015; Pena-Gomez et al., 2018). Interestingly, these individual-specific patterns have been present even in newborns (Wang et al., 2021). Kaufmann et al. (2017) reported that functional-connectivity uniqueness increases with age from 8 to 22 years and that this developmental trajectory can be disrupted by brain disorders. In adolescents, Horien et al. (2019) further demonstrated that individual-specific connectivity patterns remain stable over longer intervals (13–18 years), with medial frontal and frontoparietal networks showing the highest identification accuracy. However, the characteristics of individual variability in functional connectivity during childhood and adolescence remain insufficiently understood, and whether functional connectivity can maintain individual distinctiveness over a relatively long-term developmental period has yet to be fully elucidated.
To address these issues, we investigated the individual variability of brain functional networks and their developmental changes during childhood and adolescence at the whole-brain, system, and voxel levels based on rs-fMRI data. First, using cross-sectional rs-fMRI data from 257 healthy children (aged 6–12 years) and 60 healthy adults (aged 18–29 years), we explored the spatial pattern of functional-connectivity variability, its age-related changes, and its similarity to the adult pattern. Second, leveraging longitudinal rs-fMRI scans from 137 healthy children and adolescents (aged 6–12 years at the baseline), we examined whether functional brain networks retain individual-specific characteristics over a relatively long interval (approximately one year) during this developmental period.
Methods
Participants
This study utilized a longitudinal rs-fMRI dataset from 257 healthy children and adolescents (aged 6.18–12.45 years; 126 boys and 131 girls) collected by the Children School Functions and Brain Development Project (Beijing Cohort; Lei et al., 2022; Zhao et al., 2019). The dataset included 394 scans in total, with 137 participants scanned twice. Dataset 1 consisted of the first (baseline) scan from all 257 participants and was used to characterize individual variability in functional connectivity. Dataset 2 comprised the longitudinal subset of 137 participants who completed two scanning sessions approximately one year apart (baseline age range 6.18–11.95 years; 63 boys and 74 girls) and was used for individual identification analyses. To evaluate the similarity of individual variability patterns between children/adolescents and adults, we additionally included an independent adult rs-fMRI dataset of 60 healthy adult participants (aged 18.10–28.85 years; 23 males and 37 females; Dataset 3). All participants had no history of neurological or psychiatric disorders, had not taken neuroactive medications, and reported no major brain injury or serious physical illness. Written informed consent was obtained from the guardians of all child participants and from all adult participants. The demographic characteristics of the participants are presented in Table 1.
Demographic Characteristics of the Participants.

Data Acquisition
The MRI data for all three datasets were acquired using a Siemens Prisma 3T scanner with identical scanning protocols at the Peking University Magnetic Resonance Imaging Research Center. During scanning, foam padding was used to stabilize the participants’ heads, and earplugs were provided to reduce the noise from the scanner. On the day of the MRI scan, the participants were instructed to refrain from taking any medications and consuming caffeinated beverages. The rs-fMRI data was collected using an echo-planar imaging sequence with the following parameters: repetition time = 2000 ms; echo time = 30 ms; flip angle = 90°; field of view = 224 × 224 mm2; matrix size = 64 × 64; 33 slices; slice thickness = 3.5 mm; inter-slice gap = 0.7 mm; total = 240 volumes. Prior to scanning, the participants were instructed to keep their eyes open, remain relaxed without engaging in any specific thoughts, and minimize head movement throughout the scan. After scanning, a brief inquiry was conducted to confirm that the participants had not fallen asleep during the procedure. High-resolution three-dimensional (3D) T1-weighted structural images were acquired with the following parameters: repetition time = 2530 ms; echo time = 2.98 ms; flip angle = 7°; field of view = 256 × 224 mm2; matrix size = 256 × 224; 192 slices; voxel size = 1 × 1 × 1 mm3.
Data Preprocessing
All of the rs-fMRI data was preprocessed using Statistical Parametric Mapping (SPM12) software and the Data Processing Assistant for Resting-State fMRI (Yan & Zang, 2010). Similar preprocessing procedures were applied to all three datasets.
Dataset 1 and Dataset 2
We removed the volumes in the first 10 time points and performed slice timing correction and head-motion realignment. During the realignment, the framewise displacement (FD) at each time point and the mean FD across all time points were calculated for each participant. The participants with large head motion were excluded if they met any of the following criteria: translation > 3 mm; rotation > 3°; mean FD > 0.5 mm; or more than 50 time points with FD > 0.5 mm. The functional images were spatially normalized to a customized template to reduce normalization errors. Specifically, each participant's T1-weighted structural image was first registered to the motion-corrected functional images and segmented into different tissues (i.e., gray matter, white matter, and cerebrospinal fluid) based on an age-specific Chinese pediatric atlas (Zhao et al., 2019) as a reference template. This atlas provides age- and population-matched anatomical priors for Chinese children, improving the accuracy of segmentation and spatial normalization. Then, the resulting individual gray matter, white matter, and cerebrospinal fluid probability maps in the Chinese pediatric atlas space were averaged to generate customized tissue probability templates. These customized templates were subsequently used as references for the second segmentation of the T1-weighted images. Based on the transformation parameters obtained from the second segmentation, the motion-corrected functional images were normalized to the customized space and resampled to 3-mm isotropic voxels, completing the spatial normalization. Spatial smoothing was applied using a Gaussian kernel with a full width at half maximum of 4 mm. Linear trends were removed to reduce low-frequency drifts. Nuisance covariates were regressed out, including 24 head-motion parameters (Friston et al., 1996), and mean signals from white matter, cerebrospinal fluid, and the whole brain. In addition, we used scrubbing to further minimize residual motion effects (Power et al., 2014). Temporal band-pass filtering was applied in the frequency range of 0.01–0.08 Hz.
Dataset 3
The preprocessing procedures for Dataset 3 were largely consistent with those applied to Datasets 1 and 2, with the exception of the head-motion exclusion criteria and the spatial-normalization procedure. Compared with the rs-fMRI data from children, more stringent head-motion criteria were applied to the data from adults: translational motion < 2 mm; rotational motion < 2°; mean FD < 0.5 mm; and no more than 50 time points with FD > 0.5 mm. For the spatial normalization, the standard white matter, gray matter, and cerebrospinal fluid templates provided by SPM12 were used as reference images. The functional images of the adults were normalized to the Montreal Neurological Institute standard space.
Different motion exclusion criteria and spatial-normalization procedures were used for children and adults to account for age-related differences in data quality and brain morphology. Children generally exhibit more head motion during scanning than adults, and pediatric brains differ substantially from adult brains in size and structure. Therefore, motion thresholds and normalization templates were chosen to optimize the data quality and anatomical alignment within each age group. For children, a customized pediatric template was used to improve the normalization accuracy (Zhao et al., 2019), whereas the standard Montreal Neurological Institute template was used for adults.
Individual Variability of Functional Brain Networks
Using the rs-fMRI data from Datasets 1, 2, and 3, we constructed voxel-level functional networks to comprehensively investigate individual variability in functional connectivity and its developmental patterns in children and adolescents aged 6–12 years at the whole-brain, system, and voxel levels, and further examined age-related changes and similarity to the adult variability pattern.
For each dataset, we first averaged the gray-matter probability maps obtained from each participant's spatially normalized, segmented T1-weighted images to generate a group gray-matter template with a probability threshold greater than 0.2. This template included both cortical and subcortical regions and covered the common scanning area across all of the participants’ rs-fMRI data. Owing to computational constraints and to improve processing efficiency, both the preprocessed functional images and the customized gray-matter template were resampled to a voxel size of 5 × 5 × 5 mm3. After resampling, the gray-matter template for the healthy child group in Datasets 1 and 2 contained 8,426 voxels, whereas the gray-matter template for the healthy adult group in Dataset 3 contained 8,718 voxels. Each voxel was defined as a node in the functional network. Based on the dataset-specific gray-matter templates, individual-level functional-connectivity matrices were computed. Specifically, for each participant, Pearson correlation coefficients were calculated between the time series of every pair of voxels. These correlation coefficients were then transformed using Fisher's z transformation, and the absolute values of the resulting z scores were taken. The absolute value transformation was applied to retain the magnitude of both positive and negative connectivity, such that interindividual variability was quantified with respect to the overall strength of the functional-connectivity profile rather than the sign of each individual connection. This approach has been used in prior studies of interindividual variability in functional connectivity, including developmental work in early life samples (Gao et al., 2015; Xu et al., 2019). Consequently, for each child participant in Datasets 1 and 2, an 8,426 × 8,426 functional-connectivity matrix was obtained, and for each adult participant in Dataset 3, an 8,718 × 8,718 functional-connectivity matrix was obtained.
For children and adolescents, both qualitative and quantitative analyses were conducted to examine age-related developmental changes in the individual variability of the functional networks. To qualitatively characterize the developmental changes of individual variability in the functional networks, a sliding-window analysis was performed on all child and adolescent participants in Dataset 1. The participants were first sorted in ascending order by age. The first 40 participants were selected to form the initial window, and the window was then shifted forward with a step of one participant in the direction of increasing age. In total, 218 windows were generated, with the mean age of the participants within each window ranging from 7.27 to 11.52 years. For each window, the individual variability of the voxel-level functional brain networks was calculated across the 40 participants. For a given voxel i, the individual variability in its functional-connectivity pattern was computed as follows:
Here, p, q = 1, 2, …, M (p ≠ q), where M denotes the number of participants within each sliding window (40 participants). Fi(Sp) represents the functional-connectivity profile of voxel i for participant p, defined as the vector of functional-connectivity values between voxel i and all other voxels in the brain (i.e., a connectivity vector of length N, where N is the total number of voxels). Corr(⋅) denotes the Pearson correlation coefficient, and E [⋅] denotes the mean across all participant pairs within the window. This approach to quantifying individual variability in functional connectivity has been previously applied in studies of adults, neonates, and preterm infants (Gao et al., 2014; Mueller et al., 2013; Xu et al., 2019).
To further examine developmental trends in the individual variability patterns in children and adolescents, we analyzed the similarity between the variability patterns observed in children/adolescents and in adults. Specifically, voxel-wise individual variability in functional connectivity was first computed for the 60 adult participants in Dataset 3. Subsequently, the spatial similarity between the individual variability patterns of the 218 sliding windows in the child/adolescent group and the adult variability pattern was assessed. Because the image spaces of the adult and child/adolescent groups differed, the following procedure was adopted: the adult gray-matter template in the Montreal Neurological Institute standard space was nonlinearly registered to the customized space used for the child/adolescent group, and the resulting template was intersected with the child/adolescent gray-matter template to obtain a common gray-matter mask shared by both groups. Based on this shared template, voxel-wise individual variability values at the corresponding voxels were extracted for both the adult group and the child/adolescent group (across the 218 windows). Pearson correlation coefficients were then computed between each pediatric variability map and the adult variability map. This procedure ensured that the child–adult comparison was performed only within matched anatomical regions and reduced the potential influence of differences in the spatial-normalization procedures across the groups.
To quantitatively characterize developmental changes in the individual variability of functional brain networks during childhood and adolescence, we performed age-stratified group-based analyses to enable distinct comparisons across distinct stages of childhood and adolescence. The participants in Dataset 1 were divided into three groups representing early, middle, and late childhood. The youngest 40 participants were selected as Group 1 (mean age = 7.27 years; age range = 6.18–7.95 years); 40 participants from the middle age range were selected as Group 2 (mean age = 9.14 years; age range = 8.88–9.38 years); and the oldest 40 participants were selected as Group 3 (mean age = 11.52 years; age range = 10.92–12.45 years). No significant between-group differences were observed in the sex distribution or head-motion parameters (p > .05). The individual variability was statistically compared across the three groups to quantitatively assess age-related changes. The individual variability in functional connectivity for each group was calculated using Equation 1.
To further investigate developmental patterns in the individual variability across different functional systems, we incorporated seven a priori cortical functional systems (Yeo et al., 2011) and subcortical regions from the automated anatomical labeling atlas (Tzourio-Mazoyer et al., 2002). Eight functional systems were considered in total: the somatomotor system, visual network, ventral attention network, dorsal attention network, frontoparietal network, default mode network, limbic system, and subcortical system. As this priori template is defined in the Montreal Neurological Institute standard space, it was transformed into the customized space used for the child and adolescent data to ensure the accurate localization of the functional systems. For each sliding window or age group, the mean individual variability across all voxels within each system was computed and taken as the system-level measure of individual variability.
Individual Identification Analysis
We next examined whether functional brain networks retain individual-specific characteristics over a relatively long interval (approximately one year) during this developmental period. Functional-connectivity-based individual identification analyses (Finn et al., 2015) were conducted using Dataset 2, which included longitudinal rs-fMRI scans acquired approximately one year apart from 137 children and adolescents.
Due to computational constraints, region-level functional-connectivity matrices with a size of 1,024 × 1,024 were constructed. Using the customized gray-matter template described above, we generated a random parcellation into 1,024 regions of interest (ROIs; NROI = 1,024) using the randomization algorithm proposed by Zalesky et al. (2010). For each ROI, the voxel time series were averaged to obtain a mean ROI time series, and Pearson correlation coefficients were then computed between the mean time series of every pair of ROIs, yielding a 1,024 × 1,024 correlation matrix.
From these correlation matrices, three types of functional-connectivity profiles were derived: whole-brain connectivity, system-level connectivity, and region-level connectivity. The whole-brain functional-connectivity profile was constructed by vectorizing the correlation values between all pairs of ROIs, resulting in a vector of length NROI × (NROI − 1)/2 = 523,776. To construct system-level connectivity profiles, each ROI was first assigned to a functional system using the eight-system parcellation described in the previous section. Specifically, an ROI was assigned to a system if more than 40% of its voxels belonged to that system. ROIs that did not meet this criterion for any system were excluded. Ultimately, all ROIs were either assigned to one of the functional systems or excluded from the system-level analyses. For each system, the correlation values between all ROI pairs within that system were vectorized to form the system-level functional-connectivity profile. The region-level functional-connectivity profile for a given ROI was defined as the vector of correlation values between that ROI and all other ROIs, yielding a vector of length NROI − 1 = 1,023.
Based on these three types of functional-connectivity profiles, individual identification rates were computed at the whole-brain, system, and regional levels (Finn et al., 2015; Horien et al., 2019). For a given participant i, Pearson correlation coefficients were calculated between the functional-connectivity profile from the first scan (whole-brain, system, or region) and the corresponding profiles from the second scan of all participants. The participant with the highest correlation was identified as the best match; the identification was considered successiful, if this best-matched participant corresponded to participant i. This procedure was performed for all participants based on their first scan, and the proportion of successful identifications was calculated as the individual identification rate. Ultimately, individual identification rates were obtained for the whole-brain, each functional system, and each brain region.
Statistical Analysis
Nonparametric permutation tests were used to quantitatively assess between-group differences in individual variability in the group-based analyses, with the aim of identifying significant developmental changes. Specifically, 10,000 permutation tests were performed. In each permutation, participants from two groups were randomly reassigned into two new groups, after which the voxel-wise individual variability map was recalculated for each new group. This procedure was repeated 10,000 times, and the resulting between-group differences in individual variability obtained from these permutations were used to construct a null distribution of group differences for each voxel. For cluster-level correction, each permutation-derived voxel-wise between-group difference map was thresholded, and voxels with p < .01 were retained. Among these suprathreshold voxels, the largest connected cluster was identified, yielding a maximum cluster size for that permutation. This process resulted in a null distribution of maximum cluster sizes based on 10,000 permutations. Statistical significance of the empirically observed between-group difference map was determined using a cluster-based multiple-comparison correction, with a voxel-level threshold of p < .01 and a cluster-level threshold of p < .05.
The same permutation procedure was also applied to assess between-group differences in the mean and standard deviation of whole-brain individual variabilty, with Bonferroni correction for the three pairwise group comparisons. For the system-level analyses, statistical comparisons were performed separately for each functional system, and Bonferroni correction was applied across the three pairwise group comparisons within each system.
The individual identification analyses described above yielded identification accuracy at the group level, reflecting the overall distinctiveness of functional-connectivity patterns within a given cohort. To further assess the robustness of individual identification beyond the full-sample identification rate, and to characterize individual-specific uniqueness at the participant level, a bootstrap resampling approach was employed to statistically evaluate individual identification performance for each participant. Specifically, in each bootstrap iteration, 100 participants were randomly sampled with equal probability from the 137 participants in Dataset 2. Whole-brain or system-level functional-connectivity profiles were then used to perform individual identification, and the participants who were correctly identified within this subsample were recorded. After each iteration, the 100 participants were returned to the full pool, and a new sample of 100 participants was drawn. This procedure was repeated 10,000 times. For each participant, the ratio of the number of times they were correctly identified to the number of times they were included in the bootstrap samples was calculated. This ratio represents the probability of individual identification for that participant based on whole-brain or system-level functional connectivity. Higher values indicate the greater individual-specific distinctiveness of functional-connectivity patterns.
Results
Development of Individual Variability in Functional Brain Networks During Childhood and Adolescence
Using the sliding-window approach, we computed individual variability patterns of functional connectivity across 218 windows (40 participants per window) in children and adolescents. Six representative windows are shown in Figure 1A. Visual inspection revealed that individual variability patterns were highly similar across different age ranges. Specifically, higher variability was consistently observed in regions such as the lateral prefrontal cortex, lateral temporal cortex, posterior cingulate cortex, hippocampus, and parahippocampal gyrus, whereas lower variability was found in visual and somatomotor regions. The spatial distribution of individual variability in these windows closely resembled the variability pattern observed in adult participants (Figure 1A). These findings indicate that, within the age range of 6–12 years, the spatial pattern of individual variability in functional connectivity is already similar to that of adults and remains relatively stable with increasing age.
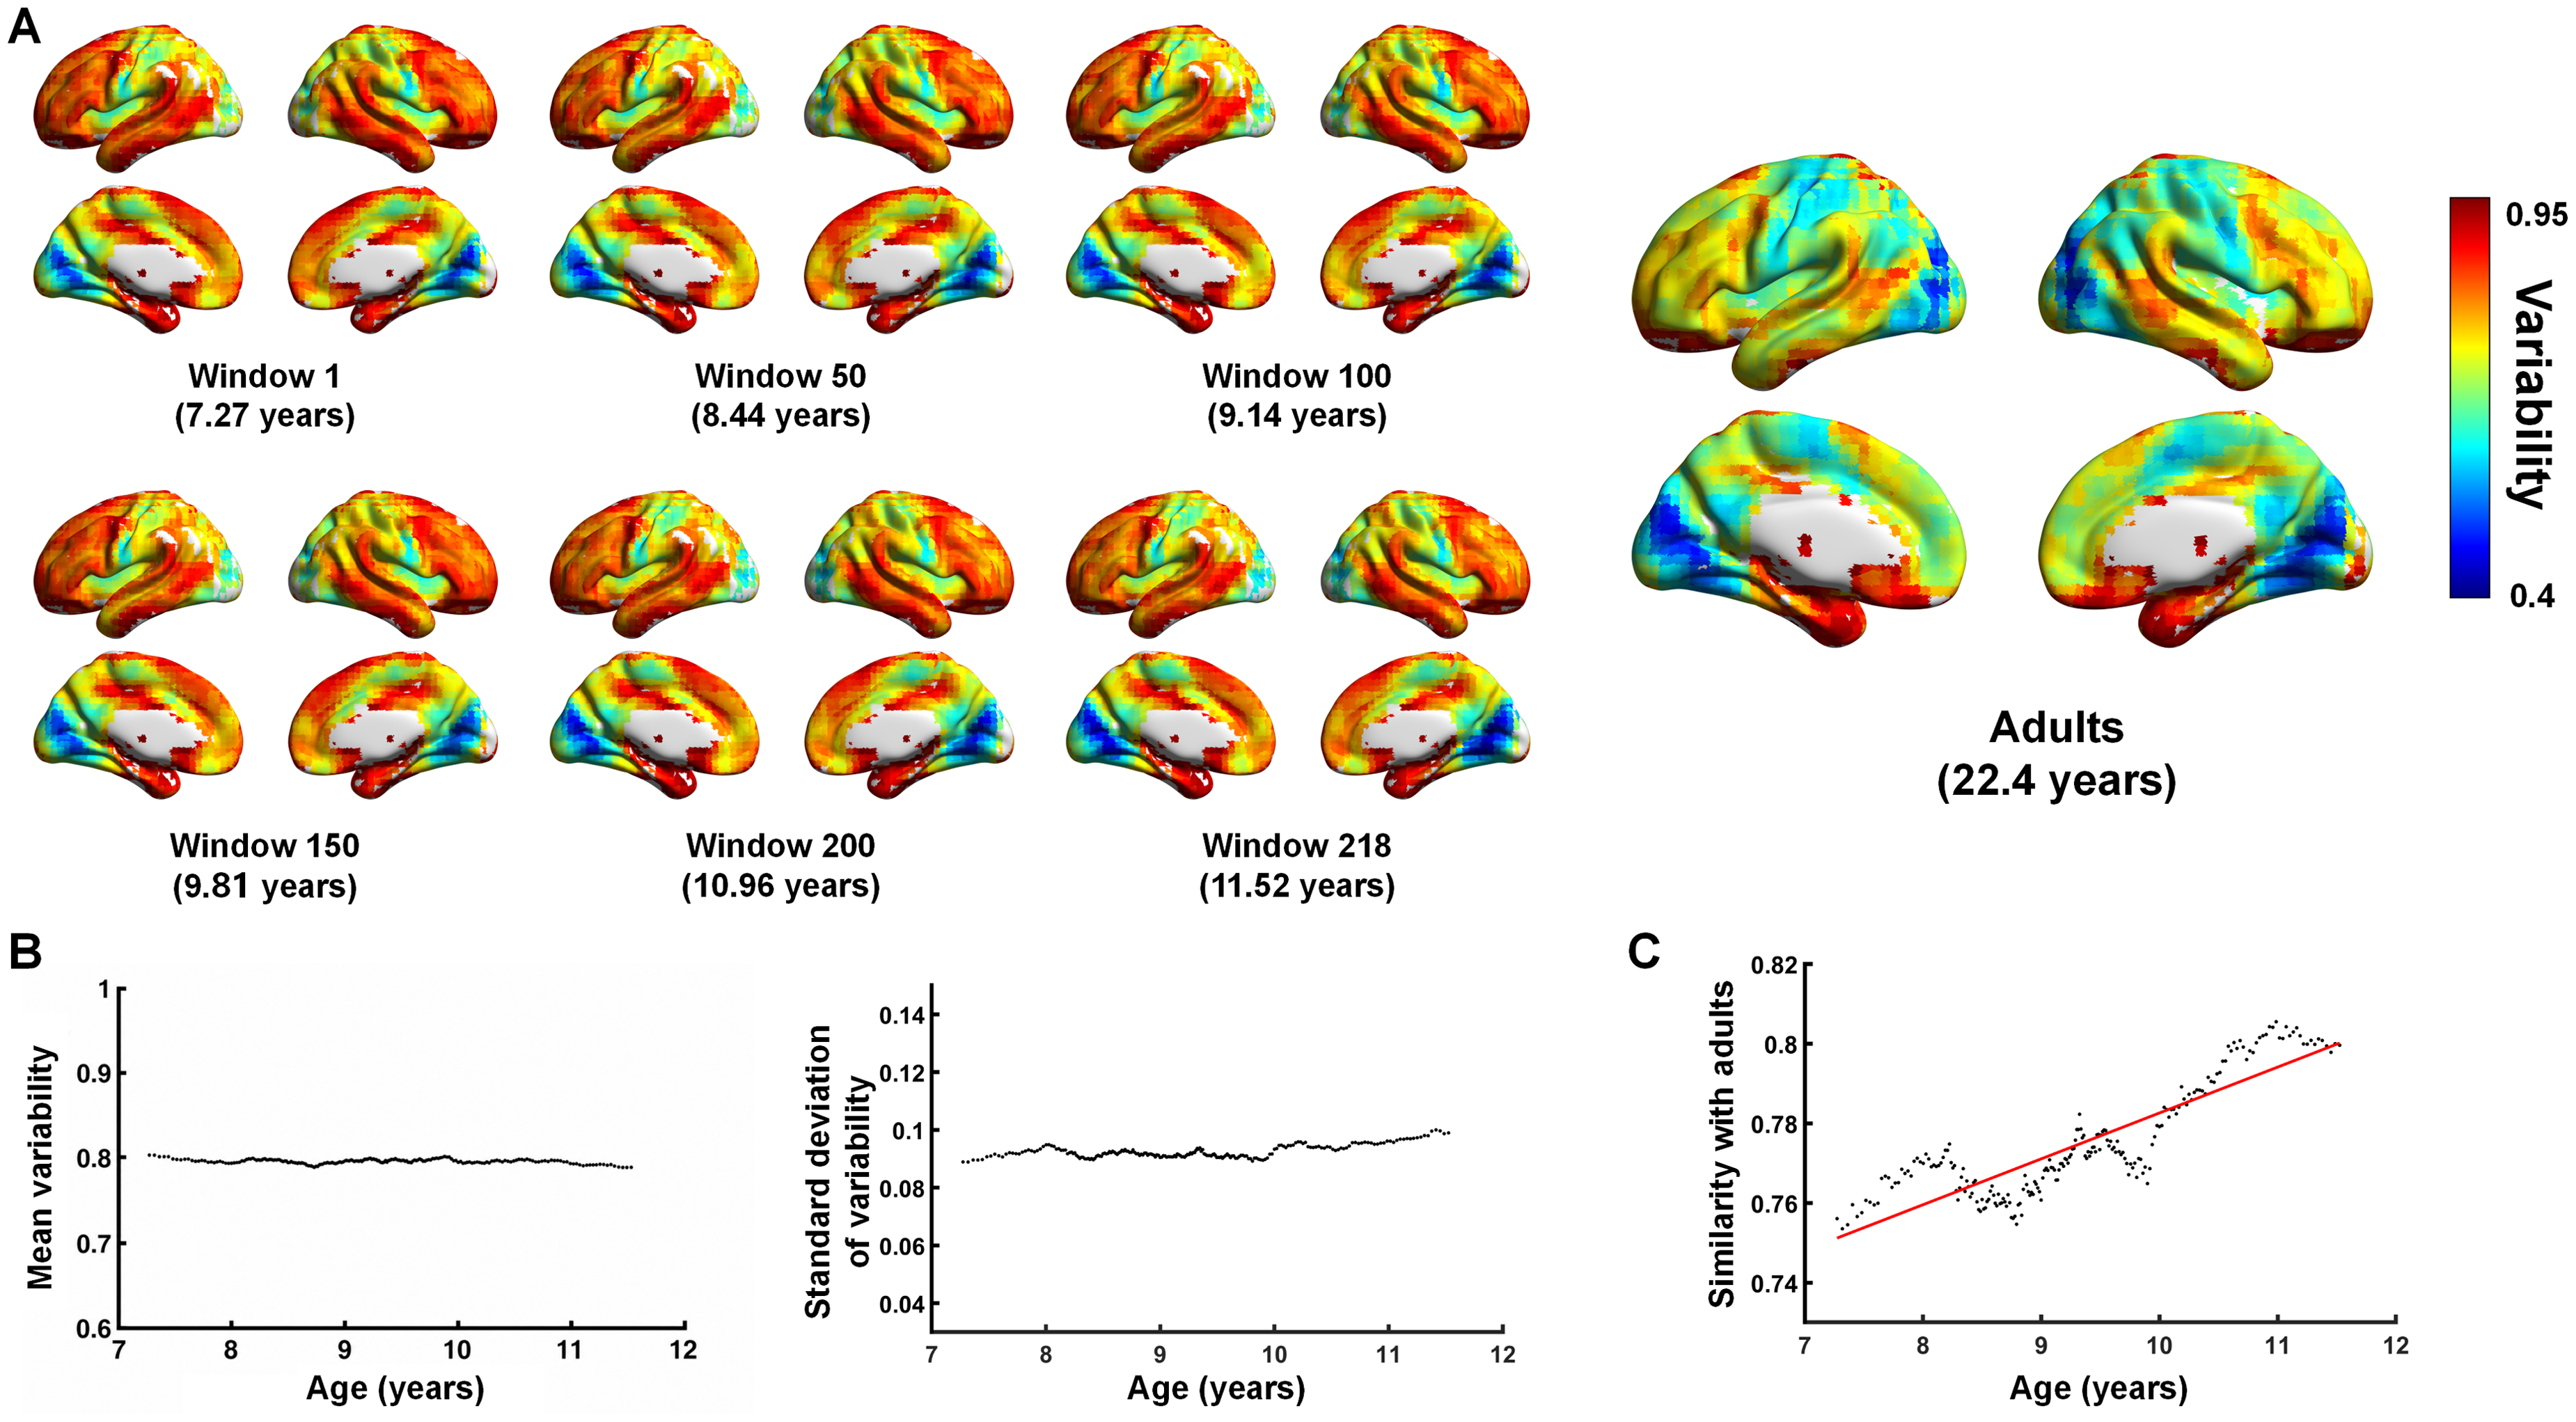
Sliding-window analysis of individual variability in functional connectivity.
To further characterize age-related trends, we calculated the mean and variance of voxel-wise individual variability within each window. This yielded scatter plots of the mean and standard deviation of individual variability as a function of age across all windows (Figure 1B). The results showed that both the mean and standard deviation of individual variability remained largely unchanged across windows, with no clear age-related trend. In analyses examining spatial similarity to adult variability patterns, we found that children and adolescents exhibited a high degree of spatial similarity to adults (.7748 ± .0139; range: .7535–.8055). Moreover, the spatial similarity between each window's individual variability pattern and the adult pattern increased significantly with age (r = .8733; < .001; Figure 1C).
To quantitatively characterize developmental changes in the individual variability of functional brain networks during childhood and adolescence, group-based statistical analyses were conducted. First, spatial distributions of individual variability in functional connectivity were obtained for the three age groups (Figure 2A). Visual inspection indicated that the overall spatial patterns of individual variability were largely similar across the three groups. Pairwise between-group comparisons revealed that, relative to Group 1, Group 3 exhibited a significant decrease in individual variability within visual regions (Figure 2B; voxel-level p < .01; cluster-level p < .05; 10,000 permutations). No other between-group differences survived multiple-comparison correction for the comparisons between Group 3 and Group 2 or between Group 2 and Group 1. In addition, the mean and standard deviation of whole-brain individual variability in functional connectivity were calculated for each group (Figure 2C). The results showed that the mean whole-brain individual variability in Group 3 was significantly lower than that in Group 1 ( = .011; survived Bonferroni correction; 10,000 permutations). Conversely, the standard deviation of whole-brain individual variability in Group 3 was significantly higher than that in Group 1 ( < .0001; survived Bonferroni correction; 10,000 permutations) and Group 2 ( < .0005; survived Bonferroni correction; 10,000 permutations).

Group-based results of individual variability in functional connectivity.
Next, we examined developmental changes in the individual variability of functional connectivity at the functional-system level. As shown in the sliding-window results in Figure 3A, the visual system exhibited the lowest individual variability compared with other systems and showed a clear decreasing trend with increasing age. In contrast, individual variability in subcortical regions increased with age. Among the remaining six systems, the limbic system showed the greatest individual variability, followed by the frontoparietal network, the default mode network, the ventral and dorsal attention networks, and the somatomotor system. For these six systems, individual variability fluctuated only modestly and did not show a clear age-related trend. Figure 3B presents the group-based analysis of individual variability in functional connectivity across the systems. Across all three age groups, primary systems (the visual network and somatomotor system) exhibited lower individual variability than the other six systems. In contrast, the subcortical system, limbic system, frontoparietal network, and default mode network showed relatively higher individual variability. Between-group comparisons (Figure 3C) revealed that individual variability in the visual system decreased significantly with age (Group 3 versus Group 1: = .0002, survived Bonferroni correction, 10,000 permutations; Group 3 versus Group 2: = .0052, survived Bonferroni correction, 10,000 permutations). Conversely, individual variability in subcortical regions increased significantly with age (Group 3 versus Group 1: = .0121, survived Bonferroni correction, 10,000 permutations; Group 3 versus Group 2: puncorr = .0014, survived Bonferroni correction, 10,000 permutations). In addition, individual variability in the frontoparietal network was significantly lower in Group 3 than in Group 1 (puncorr = .0114, survived Bonferroni correction, 10,000 permutations).
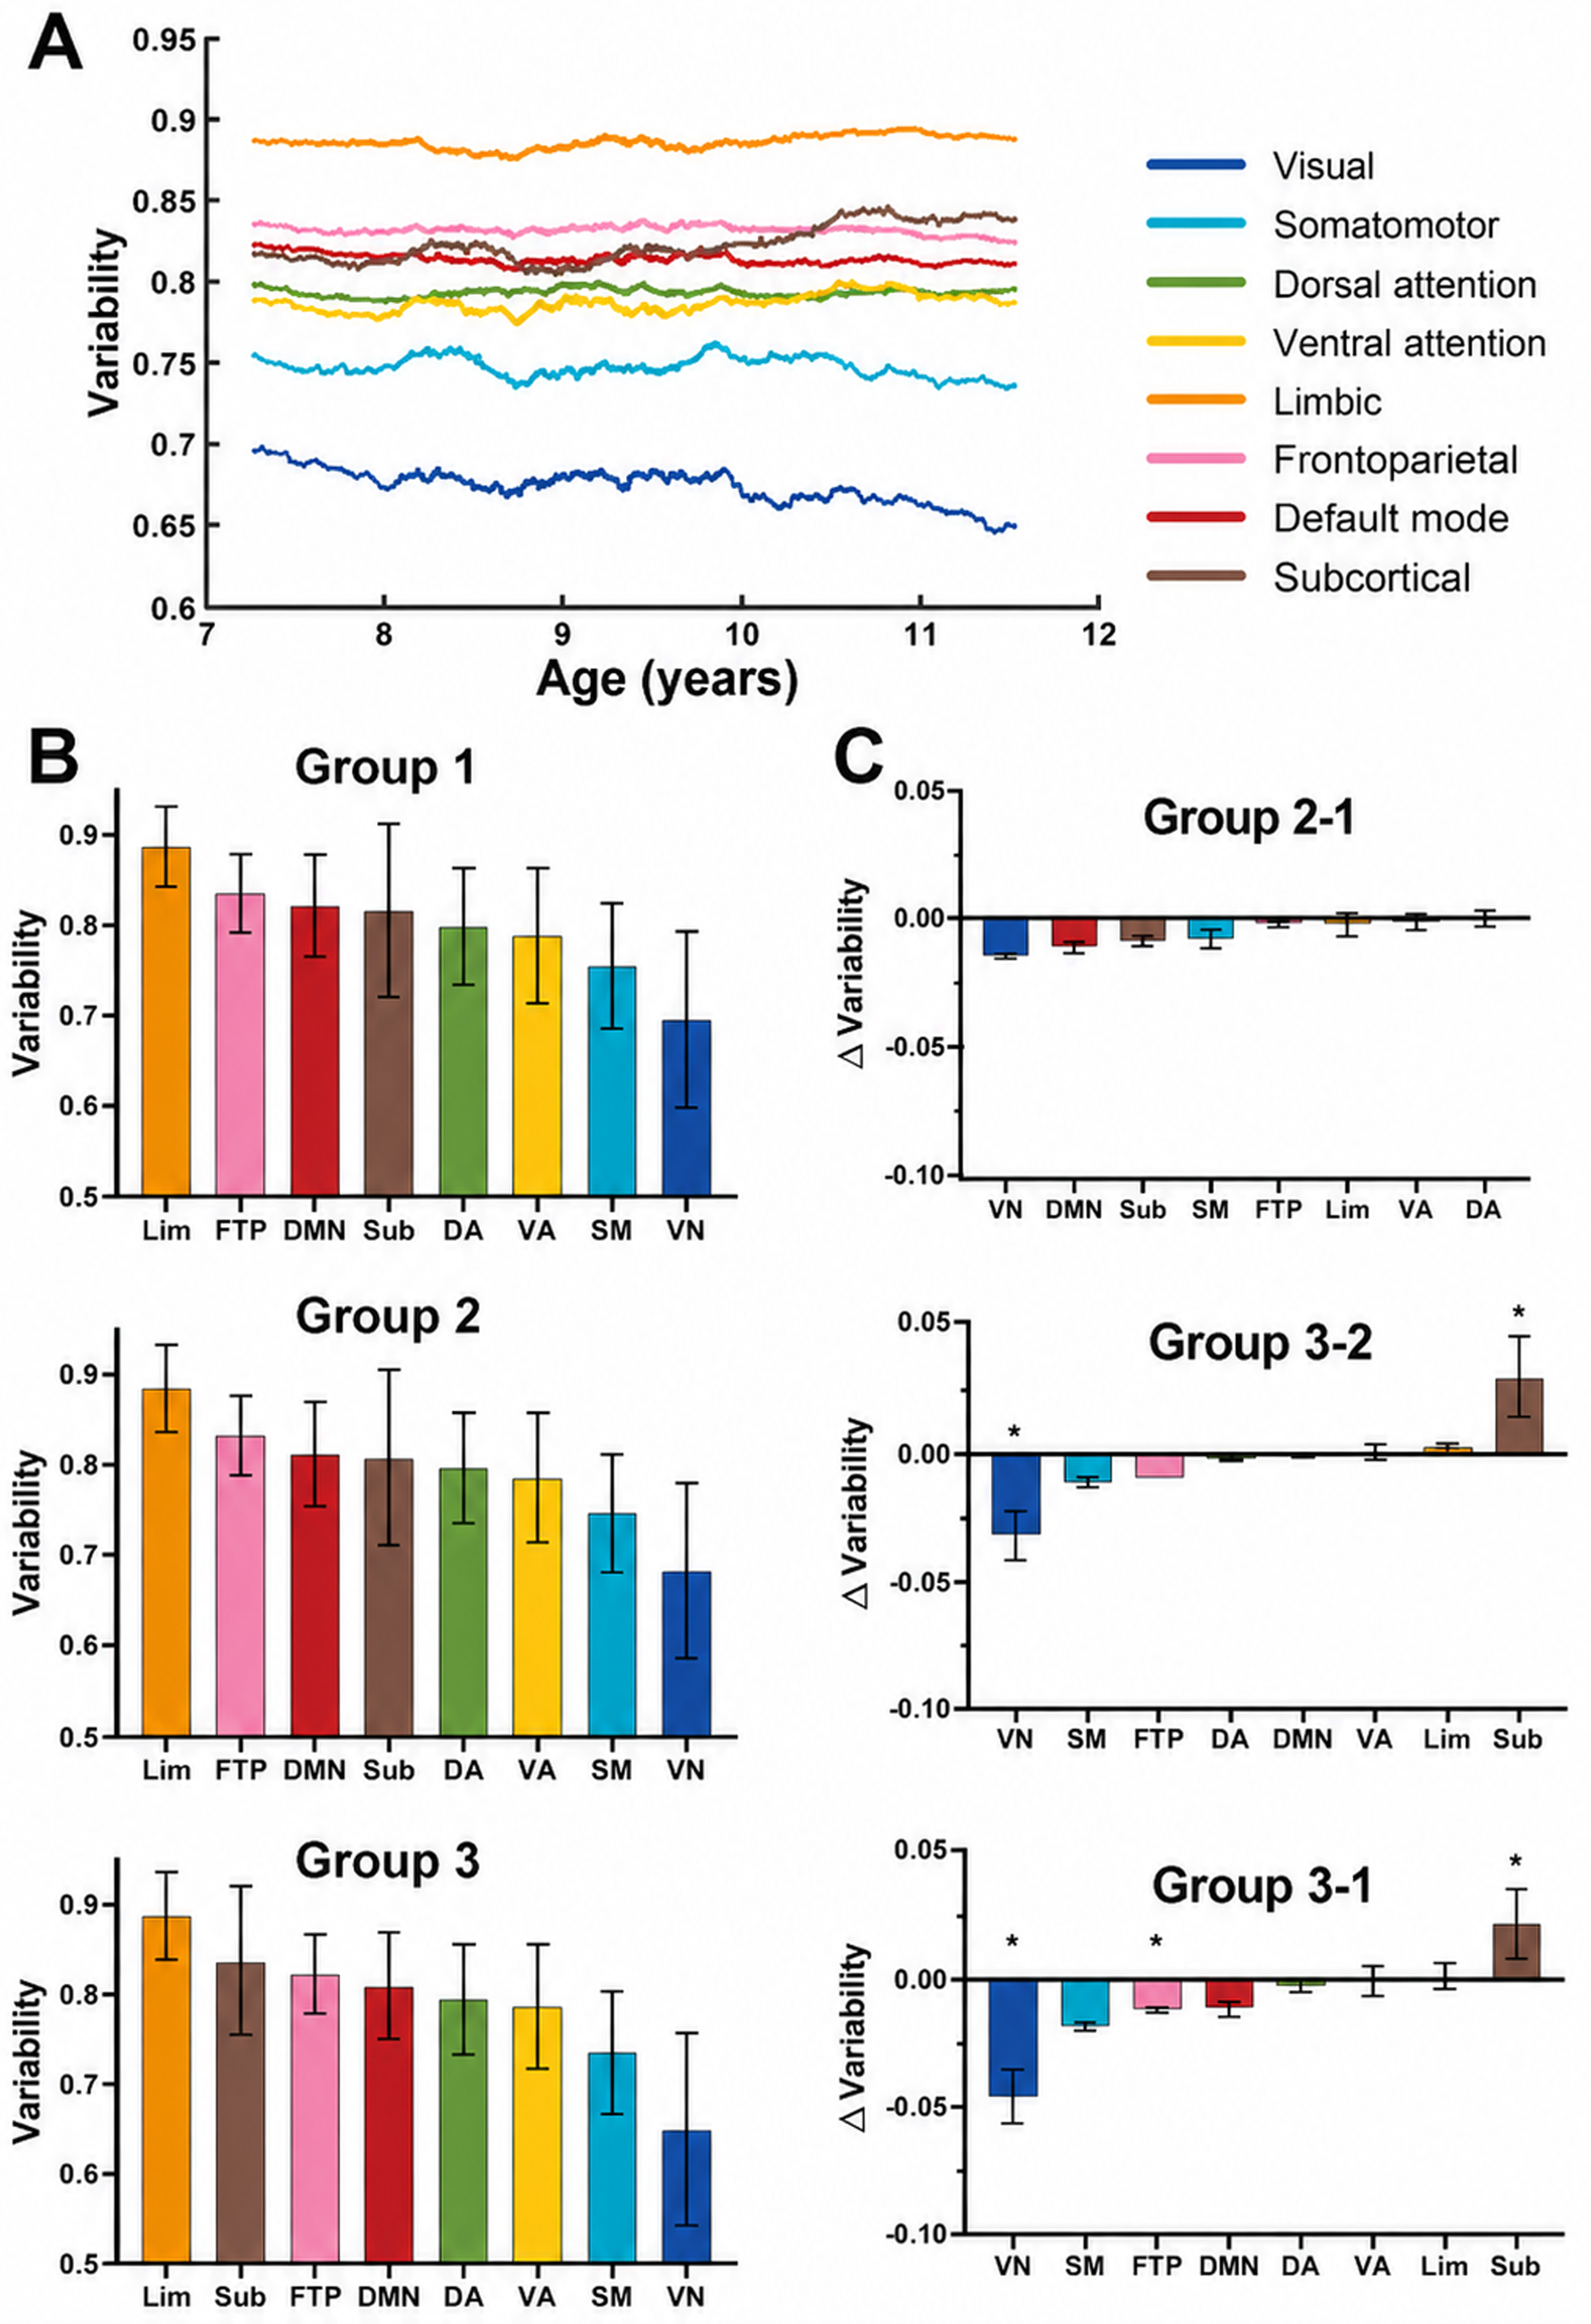
Developmental changes in individual variability of system-level functional connectivity.
Longitudinal Individual Identification of Functional Connectivity Across a One-Year Interval
We conducted individual identification analyses using Dataset 2 to test whether functional connectivity retains stable individual-specific signatures over an approximately one-year developmental interval in children aged 6–12 years. For the entire cohort of children and adolescents, the individual identification rate based on whole-brain functional connectivity was 0.927 (127/137), indicating high identification accuracy. The results of the system-level identification analysis are shown in Figure 4A. The frontoparietal network achieved a 100% identification rate (137/137), followed by the default mode network, dorsal attention network, and ventral attention network, with identification rates of .98, .96, and .88, respectively. In contrast, the subcortical system and limbic system exhibited the lowest identification rates, at .31 and .43, respectively. Among the primary systems, the visual network and somatomotor system showed identification rates of .79 and .70, respectively. Figure 4B presents the individual identification rates based on the functional-connectivity profiles of single brain regions. Regions with particularly high identification rates included the dorsolateral prefrontal cortex, medial prefrontal cortex, posterior cingulate cortex, precuneus, and middle temporal cortex.

Individual identification results based on system- and region-level functional-connectivity profiles.
Next, we applied a bootstrap resampling approach to compute the probability of successful individual identification for each participant, providing a participant-level measure of functional-connectivity uniqueness. Figure 5 shows a scatter plot of individual identification success probabilities based on whole-brain functional connectivity and system-level functional connectivity for the eight functional systems. Notably, participants as young as approximately 6 years already exhibited a 100% probability of successful identification, and 129 of the 137 participants had an identification probability of 1. The remaining eight participants had probabilities close to 0–.1. All participants exhibited a probability of 1 for the frontoparietal network, and only two participants had probabilities below 1 for the default mode network and dorsal attention network. In contrast, many participants showed identification probabilities below .3 for the subcortical and limbic systems, and a subset of participants also showed probabilities below .3 for the visual and somatomotor systems. After approximately one year, functional connectivity remained highly individual-specific in the frontoparietal, default mode, and dorsal attention networks but was less distinctive in subcortical, limbic, and visual systems in children aged 6–12 years. Moreover, participants with low identification success probabilities were distributed across all ages, suggesting that reduced individual specificity in these systems may be largely independent of age.
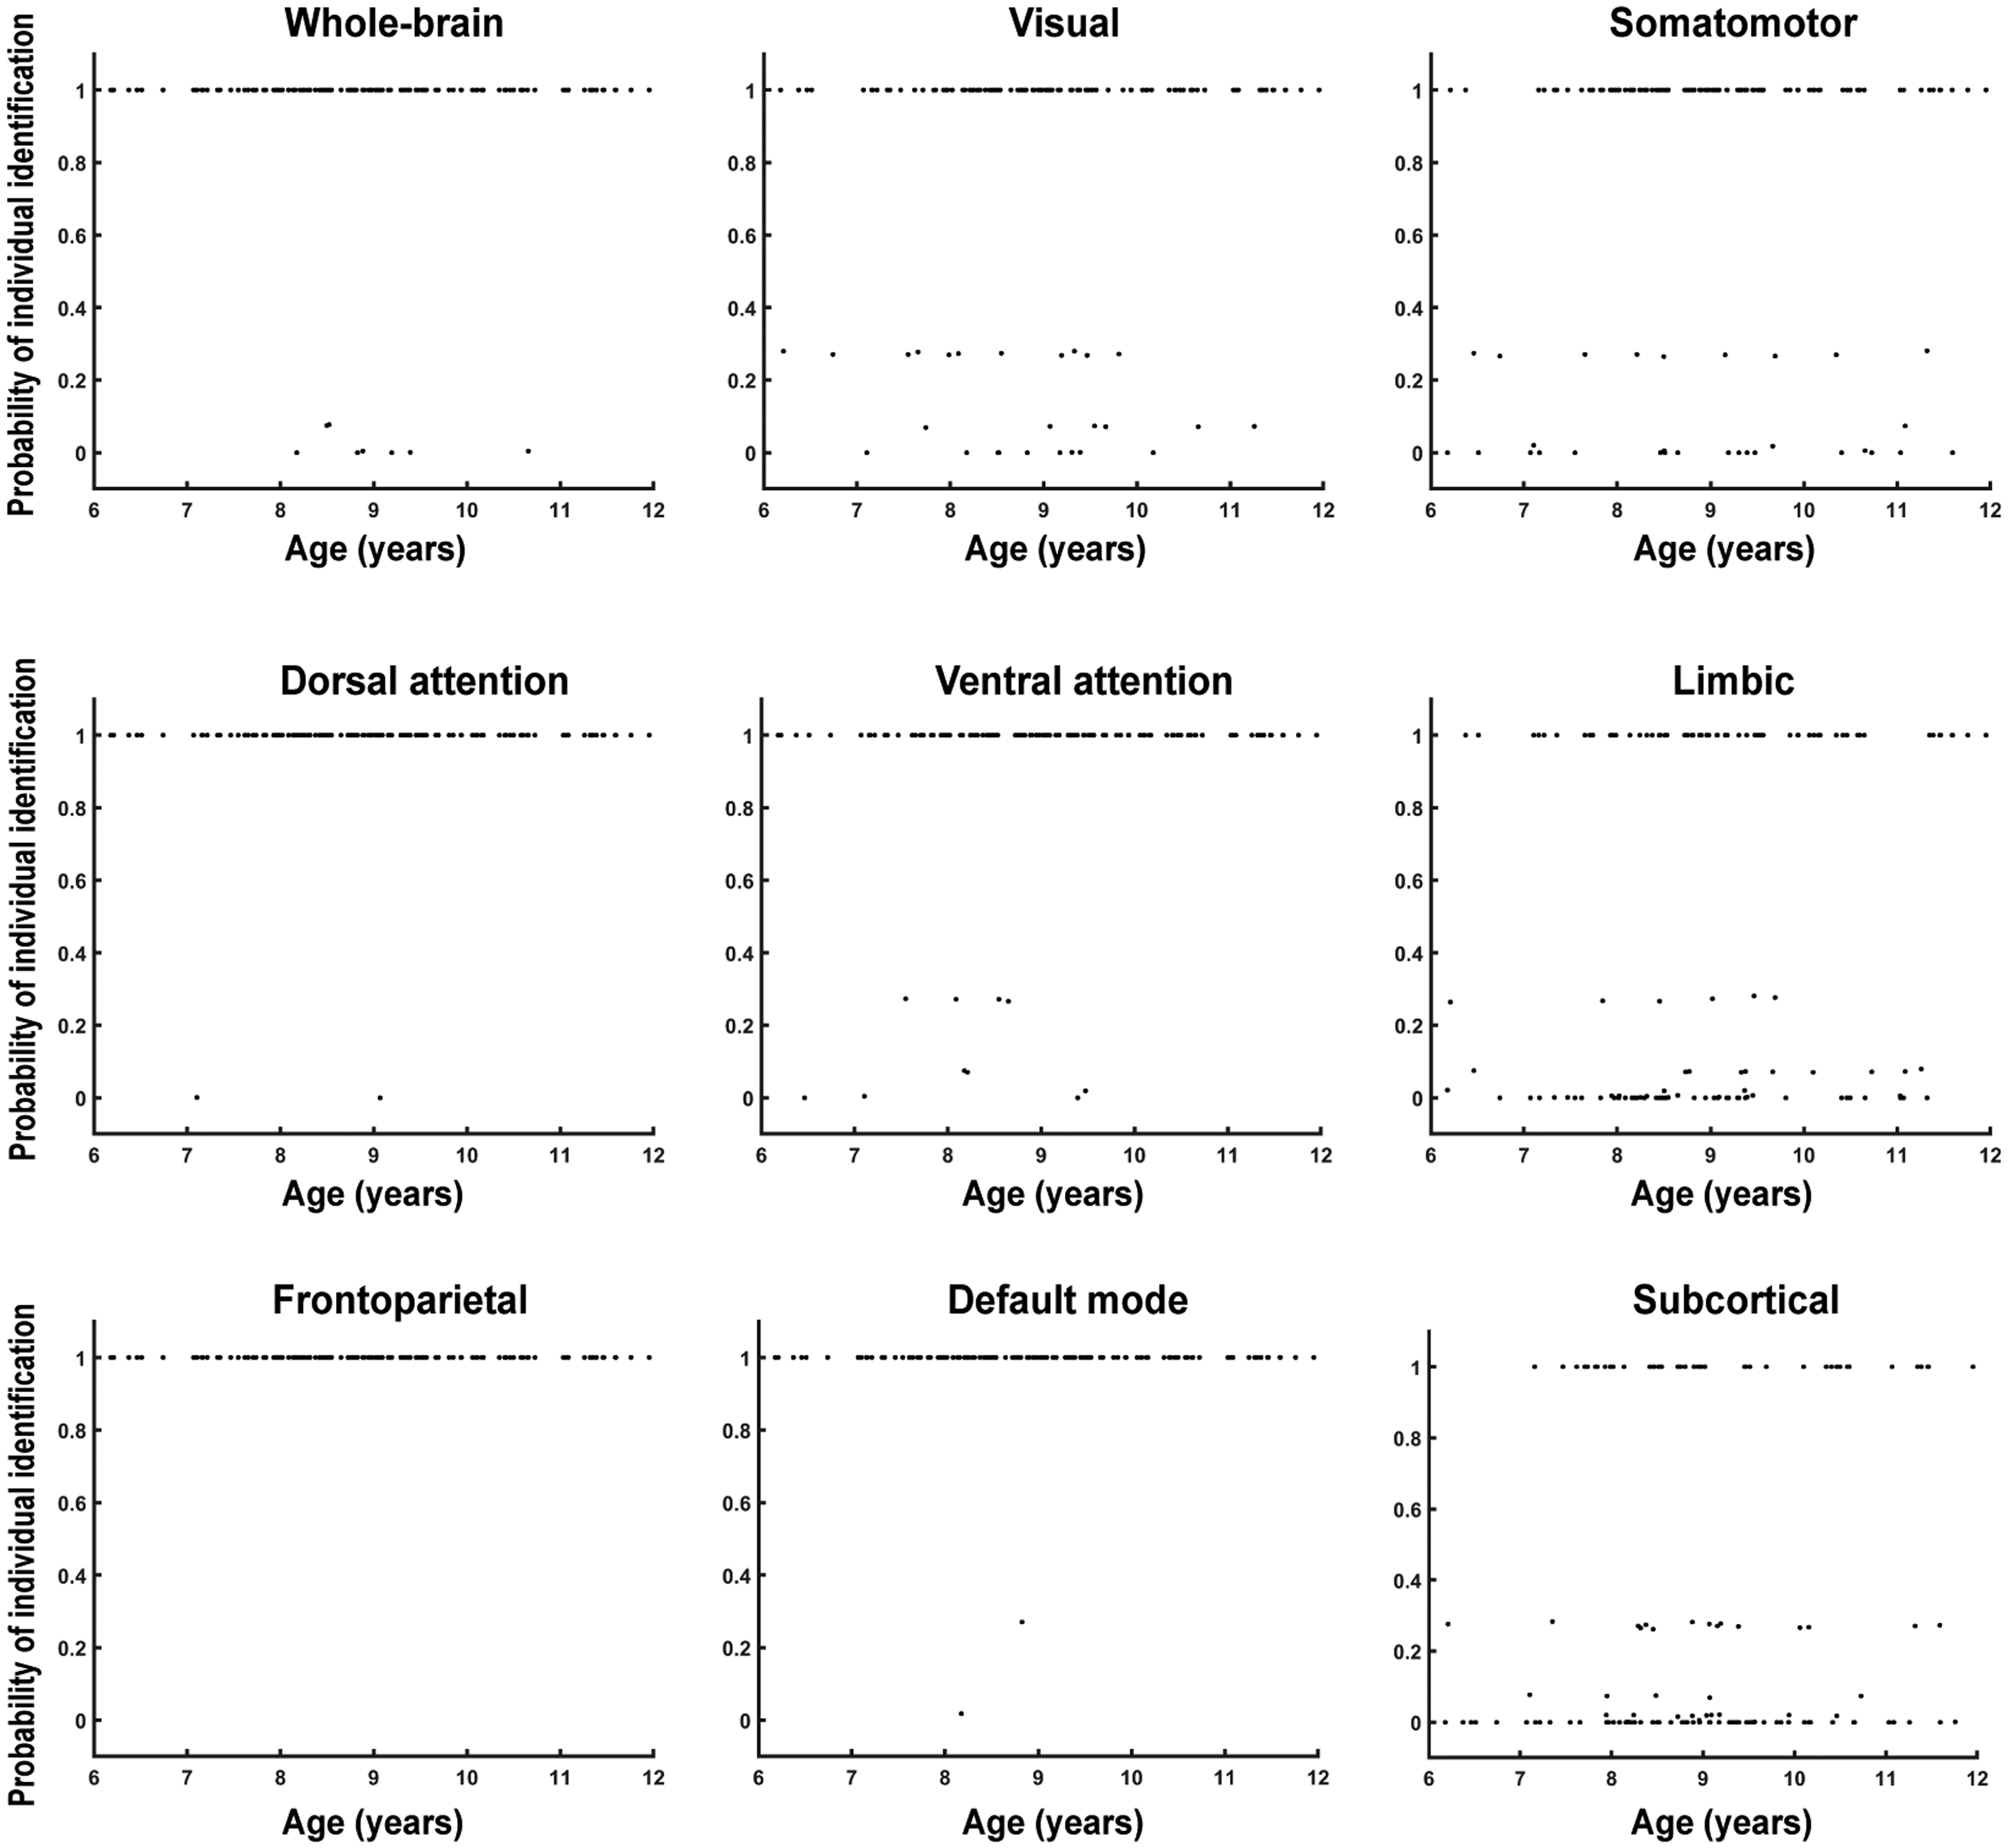
Scatter plots of individual identification success probabilities for each participant at the system level. Note. Individual identification success probabilities were calculated based on the functional-connectivity profiles of the whole brain and the eight functional systems. A bootstrap resampling approach was used to statistically estimate the individual identification performance for each participant. In each iteration, 100 participants were randomly sampled with equal probability from the 137 participants in Dataset 2, and individual identification was performed using whole-brain or system-level functional-connectivity profiles.
Discussion
In this study, we comprehensively examined individual variability in functional brain connectivity and its developmental changes in children and adolescents aged 6–12 years at the whole-brain, system, and regional levels. We found that individual variability was relatively low in primary sensorimotor and visual regions, whereas systems associated with higher-order cognitive functions, such as the frontoparietal network, exhibited higher variability. This spatial distribution closely resembles patterns observed in the adult brain. Across development, individual variability in the visual system and the frontoparietal network decreased significantly with age, whereas variability in subcortical regions increased significantly. Furthermore, whole-brain functional connectivity and connectivity within key systems (frontoparietal, default mode, and dorsal attention networks) retained strong individual-specific uniqueness over an approximately one-year interval, supporting their role as reliable “brain fingerprints” for identifying individuals within the cohort. Together, these findings advance our understanding of the neural mechanisms underlying individual differences in cognitive and behavioral development during childhood and adolescence, and provide a scientific basis for individualized assessment approaches grounded in brain developmental patterns.
Spatial Distribution of Individual Variability in Functional Brain Networks During Childhood and Adolescence
In this study, we observed a spatially heterogeneous pattern of individual variability, with lower variability in primary sensorimotor and visual areas and higher variability in higher-order association networks, such as the frontoparietal and default mode systems. This spatial pattern of variability is consistent with previous findings in adults (Luo et al., 2024; Mueller et al., 2013). In addition, we found that the spatial distribution of individual variability was largely consistent across different age groups of children and adolescents, with no substantial age-related changes. This age-invariant spatial pattern parallels findings from prior studies of functional-connectivity variability in infants aged 0–2 years (Gao et al., 2014), which reported highly similar variability patterns at 1 month, 12 months, and 24 months of age, with all resembling adultlike distributions. Together, these results suggest that between the ages of 6 and 12 years, the spatial organization of individual variability in functional brain networks is already adultlike and remains relatively stable during this developmental period.
Notably, the overall magnitude of individual variability in functional networks among children and adolescents (∼.79–.80) was lower than that reported for neonates and preterm infants (∼.87–.92; Xu et al., 2019) and infants aged 0–2 years (∼.84; Gao et al., 2014), but higher than that observed in adults (∼.78, Dataset 3). This pattern suggests developmental changes in which individual variability is relatively high early in life and gradually decreases with age. One possible explanation is that early functional networks are immature and relatively disorganized, becoming more structured over time through processes such as synaptic pruning, myelination, and the accumulation of experience (Huttenlocher & Dabholkar, 1997; Paus, 2005).
We further found that the limbic system exhibited the highest individual variability among the eight functional systems in children and adolescents aged 6–12 years. This may reflect the rapid development of limbic regions involved in emotion and memory during this age range (Ahmed et al., 2015), with substantial individual differences in developmental changes contributing to heightened variability in limbic functional networks. Similarly, networks related to higher-order cognition, including the frontoparietal and default mode networks, also showed relatively high individual variability, likely because these systems are still undergoing active development during late childhood and early adolescence (Fair et al., 2007, 2008; Stevens et al., 2009). In contrast, individual variability was lower in the sensorimotor and visual networks, which may be attributable to the fact that these primary networks are largely established during infancy (Lin et al., 2008; Smyser et al., 2010) and thus exhibit more uniform functional organization across individuals.
Development of Individual Variability in Functional Brain Networks During Childhood and Adolescence
In the sliding-window analysis, we observed that both the mean and variance of whole-brain individual variability remained largely stable across the age windows, whereas the spatial similarity between the variability patterns in children/adolescents and adults increased significantly with age. These findings indicate that, between 6 and 12 years of age, the overall magnitude of individual variability and its heterogeneity at the whole-brain level remain relatively unchanged, while the spatial organization of variability progressively becomes more adultlike. Further voxel-level quantitative analyses revealed that variability decreased significantly in the visual system, suggesting increasing inter-individual convergence of visual functional-connectivity organization during late childhood. This finding is consistent with recent studies indicating the continued refinement of sensory systems during childhood, including increases in network segregation and more adultlike functional differentiation (Dong et al., 2021; Luo et al., 2024; Sanders et al., 2023; Tooley et al., 2022). We also observed reduced variability in the frontoparietal network. Because this network supports executive control and continues to mature through childhood, the decrease in variability may indicate that its functional organization becomes more stable and consistent across children. This interpretation fits with large-scale developmental evidence showing increasing long-range integration and clearer hierarchical organization of functional networks across development, which may constrain individual differences and promote the convergence of frontoparietal connectivity patterns (Luo et al., 2024). Together, these findings suggest that during the 6–12-year developmental period, the visual and frontoparietal networks continue to mature, with their connectivity patterns becoming more similar across individuals and exhibiting increased commonality.
Conversely, we found that individual variability in subcortical regions increased significantly with age (Figure 3C). Previous studies have reported reductions in gray-matter volume and cortical thickness in subcortical structures during childhood and adolescence (Giedd, 2008; Giedd & Rapoport, 2010), along with the strengthening of resting-state functional connectivity (Qin et al., 2012). The developmental changes of subcortical structure and function during this period may vary substantially across individuals, which could contribute to the observed increase in individual variability in subcortical functional networks.
Individual Specificity of Functional Brain Networks in Children and Adolescents
In the individual identification analyses, we found that whole-brain functional networks exhibited a high identification rate (92.7%). This indicates that after a relatively long developmental interval (approximately one year), functional brain networks in children and adolescents aged 6–12 years retain strong individual specificity and can serve as reliable “brain fingerprints” to successfully distinguish individuals within a cohort. The results from the bootstrap analysis further showed that the vast majority of participants had an individual identification success probability of 1, and that participants as young as approximately 6 years already demonstrated a 100% probability of successful identification. These findings suggest that whole-brain functional networks achieve a high degree of individual specificity by around 6 years of age, and that this specificity is preserved throughout the rapid developmental period between 6 and 12 years.
A small subset of eight participants exhibited identification success probabilities close to 0–0.1. These participants were distributed across different ages, suggesting that the low individual specificity of functional networks is unlikely to be developmentally driven. Instead, it may reflect large differences in emotional or mental states between the two scanning sessions, leading to substantial variability in functional network organization and, consequently, the failure of individual identification (Lurie et al., 2020; Shine et al., 2016; Wong et al., 2013).
Previous studies have demonstrated that the frontoparietal network makes a critical contribution to individual specificity (Finn et al., 2015; Kaufmann et al., 2017; Waller et al., 2017) and retains high individual distinctiveness and stability even over long-time intervals (Horien et al., 2019). Consistent with this literature, we found that the frontoparietal network achieved a 100% identification rate, with converging results at the individual level. This indicates that functional connectivity within the frontoparietal network already exhibits strong individual specificity by around 6 years of age. This finding aligns with evidence that individual-specific functional connectivity emerges early in life, as individual uniqueness has been observed even in the neonatal functional connectome and remains detectable across development (Wang et al., 2021). Although previous work has shown that frontoparietal connectivity patterns undergo developmental reorganization during childhood and adolescence (Giedd et al., 1999; Gogtay et al., 2004; Gu et al., 2015; Vasa et al., 2018), such developmental changes do not appear to disrupt individual specificity, which remains stable across ages. One possible explanation is that the frontoparietal network follows an individual-specific developmental trajectory or undergoes refinement based on a stable connectivity scaffold. As a result, despite changes in the detailed structure or strength of connections, the overall functional-connectivity pattern remains highly self-similar within individuals across development.
In addition, we found that other systems associated with higher-order cognition, including the default mode network and the dorsal and ventral attention networks, showed relatively high identification rates. In contrast, individual specificity was lower in the subcortical system, limbic system, and primary visual and sensorimotor systems. Previous analyses of individual variability have shown that the visual system exhibits relatively low variability across individuals, which may account for its lower identification performance. Although the limbic and subcortical systems show higher individual variability, their lower identification rates may reflect greater fluctuations in functional connectivity between the two scanning sessions, limiting the capture of stable individual-specific information or indicating the absence of strongly individualized developmental patterns. Moreover, participants with low identification success probabilities for these systems were distributed across all ages, suggesting that reduced individual specificity in these functional networks is largely independent of age and may be influenced by fluctuations in emotional or mental states at the time of scanning (Lurie et al., 2020; Shine et al., 2016; Wong et al., 2013).
Methodological Considerations and Limitations
This study has several limitations. First, our main age range (6–12 years) did not include later adolescence, when puberty-related changes may further affect the extent of inter-individual variability and individual uniqueness (Blakemore, 2012; Vijayakumar et al., 2018). Second, the comparison between children and adults should be interpreted with caution because the two datasets differed in sample size, head-motion exclusion criteria, and spatial-normalization procedures. Although these choices were made to account for age-related differences in data quality and brain morphology, and child–adult similarity was evaluated only within a common gray-matter mask after spatial alignment, some systematic bias may still remain. Third, we quantified variability using the absolute magnitude of functional connectivity, which does not distinguish between positive and negative connections. Future work could examine whether sign-specific connectivity patterns show distinct developmental trajectories and make additional contributions to individual variability and connectome uniqueness. Fourth, although individual identification was performed across two independent scanning sessions and supplemented by bootstrap resampling, we did not apply additional cross-validation or split-sample validation procedures, especially for region-level analyses. Finally, we focused on static functional connectivity. Because functional connectivity is time-varying, dynamic analyses may better capture transient network states and state-dependent individual differences (Hutchison et al., 2013; Lurie et al., 2020). Future work integrating time-varying connectivity and edge-based approaches may provide complementary insights into the dynamics of individual variability and fingerprinting in development.
Conclusions
Together, individual variability in functional connectivity during childhood and adolescence shows adultlike, spatially heterogeneous organization and system-dependent developmental changes. Meanwhile, functional connectivity preserves stable individual-specific signatures over a relatively long interval (approximately one year), highlighting the robustness of individual differences across ongoing development. These results improve our understanding of how brain networks mature while maintaining stable individual differences during development, and support the use of functional-connectivity measures for the individualized characterization of developmental profiles.
Footnotes
Funding
The authors disclosed receipt of the following financial support for the research, authorship, and/or publication of this article: This work was supported by the National Science and Technology Major Project on Brain Science and Brain-Inspired Research (grant number: 2021ZD0200500) and the National Natural Science Foundation of China (grant numbers: 31221003 and 31521063).
Declaration of Conflicting Interests
The authors declared no potential conflicts of interest with respect to the research, authorship, and/or publication of this article.