
Abstract
Careless responding poses a notable challenge in measurement due to its potential to distort relationships between items. Factor mixture modeling, as a statistical modeling tool adept at identifying heterogeneous clusters within a population, has emerged as a promising avenue for careless-responding detection. The recent development of three factor mixture models, by Arias et al., Steinmann et al., and Kam and Cheung has advanced the field of careless-responding detection. All three models have been demonstrated to be effective. However, the application of these factor mixture models necessitates familiarity with the syntax for mixture modeling in Mplus, which can be inconvenient to novice Mplus users. To facilitate the convenient and rapid deployment of factor mixture models for careless-responding detection, this study has developed a user-friendly online application for the three factor mixture models to help users generate the necessary Mplus syntax.
Careless responding is a type of response behavior in surveys where respondents do not provide thoughtful and effortful answers to the survey questions or items (Curran, 2016; Johnson, 2005; O’Dell, 1971). It typically features logical inconsistency in the responses and overly rapid completion time (Curran, 2016; Johnson, 2005; O’Dell, 1971). According to a recent investigation by Stosic et al. (2024), only about half of the paid online studies in the flagship journals Psychological Science and Journal of Personality and Social Psychology were screened for careless responses. This alarmingly low rate highlights the urgent need for expanding the development of a convenient, effective tool for careless-response screening (Stosic et al., 2024; Ward & Meade, 2023). The goal of this article is to respond to the recent call for expanding research on careless-response detection by introducing a user-friendly online application (app) that employs factor mixture modeling to identify such respondents.
Numerous studies have highlighted the potential consequences of careless responding for statistical results. It can distort reliability estimates, factor loadings, variable correlations, and construct dimensionality (Credé, 2010; Huang et al., 2012, 2015; Kam & Cheung, 2024; Kam & Meyer, 2015; Maniaci & Rogge, 2014; McGonagle et al., 2016; McGrath et al., 2010; Meade & Craig, 2012; Woods, 2006). Stosic et al. (2024) have shown that observed correlations in published studies that failed to control for careless responses may have been severely inflated. There are at least two types of careless responding: random and longstring (Meade & Craig, 2012). Random respondents offer erratic and random responses. Longstring respondents give consecutively identical answers. Both types of careless respondents do not respond based on the content or meaning of the items. Longstring responses can overestimate the correlation between items of the same keying direction and attenuate the correlation between regular- and reverse-keyed items (Kam & Meyer, 2015). Although different methods have been used to detect careless responses, such as attention-check questions, response-time measures, and invariability measures (Goldammer et al., 2020), these methods require the setting of cutoffs, which can be challenging because these standards can differ due to variations in the items between surveys.
Researchers have proposed more effective methods that do not require additional survey time from participants to address these problems—for example, latent profile analysis (Meade & Craig, 2012), factor mixture modeling (Arias et al., 2020; Kam & Cheung, 2024; Steinmann et al., 2022), and Bayesian dynamic latent class structural equation modeling (Roman et al., 2024). Among these methods, applying factor mixture models (FMMs) has been a burgeoning research area. FMMs represent a powerful statistical approach that combines confirmatory factor analysis and latent class modeling to identify unobserved subpopulations (Clark et al., 2013; Lubke & Muthén, 2005). In the context of careless-responding detection, FMMs are useful because they allow researchers to differentiate between respondents who engage thoughtfully with survey items (the careful class) and those who respond in a disengaged or inattentive manner (the careless class). The logic is that careless respondents will show different item variance–covariance patterns compared to careful respondents. By estimating class membership based on different item variance–covariance patterns across regular- and reverse-keyed items, FMMs enable the data-informed detection of problematic responses and estimation of model parameters (“values”) without requiring external benchmarks such as response time or attention checks (Arias et al., 2020; Kam & Cheung, 2024).
The three recent FMMs proposed by Arias et al. (2020), Steinmann et al. (2022), and Kam and Cheung (2024) primarily differ in focus. Both Arias et al. (2020) and Steinmann et al. (2022) focus specifically on identifying longstring respondents. The FMM developed by Kam and Cheung (2024) advances prior methods by simultaneously identifying both longstring and random respondents in the careless class. In terms of model specifications, unlike the other two models, Kam and Cheung's (2024) model (hereafter, K–C Model) does not assume residual item intercept and factor-loading invariance (between careful and careless respondents), which may better reflect the distinct characteristics between careful and random careless responding. Simulation studies in Kam and Cheung’s (2024) research demonstrate that their model outperforms its predecessors in model fit, convergent validity, false hit rates, and parameter accuracy, with more reasonable assumptions that capture both longstring and random careless respondents. Readers may refer to Kam and Cheung (2024) for a detailed comparison.
Although researchers using the three models have provided sample syntax to conduct the necessary data analyses in Mplus (Muthén & Muthén, 2023), the complexity of the syntax—particularly for applied users unfamiliar with factor mixture modeling and just wanting to use it to identify careless responses—may discourage them from routinely screening for careless responses. The cumbersome nature of the syntax goes against recent appeals from methodologists for a more user-friendly approach to screening for careless responses (Ward & Meade, 2023). To overcome this challenge, we have developed a user-friendly online app that can produce an Mplus syntax file for the three FMMs. Users can effortlessly generate the Mplus input syntax by selecting the designated link and entering the required parameters. The app's user-friendly design may motivate all users, both novice and experienced, to regularly screen for careless responses, contributing to the improved detection rate of such responses in published studies (Stosic et al., 2024).
Empirical example
In this example, we use an open access self-esteem (Rosenberg, 1965) data set (https://openpsychometrics.org/_rawdata/) to demonstrate the implementation of the K–C Model in Mplus. A total of 47,974 participants (37.11% male, 60.83% female, 1.10% other, and 0.96% unidentified) completed an online survey (Mage = 26.60, SDage = 12.40). The participants came from various countries and regions around the world, with the majority from the USA (46.80%), the United Kingdom (13.91%), Canada (6.13%), and Australia (4.96%). Half of the items were regular-keyed and the other five were reverse-keyed, with all items administered in the Likert-scale format (1 = strongly disagree to 4 = strongly agree).
A brief overview
Users can input their data and parameters through an intuitive interface, and the app automatically generates the Mplus input file needed for the analysis. With just a few clicks, researchers can obtain Mplus syntax that helps in detecting careless responses.
Step 1
Step 1 depends on the method. First, click the link to open the app. The user may directly access the careless-detection online app through the link below, which automatically launches the K–C Model within a browser window: carelessdetection.shinyapps.io/kc_model/
Similarly, to apply the FMM developed by Arias et al. (2020), users can click the following link: carelessdetection.shinyapps.io/arias_model/
And to apply the FMM developed by Steinmann et al. (2022), the following link can be used: carelessdetection.shinyapps.io/steinmann_model/
As for model selection, while the K–C Model offers broader applicability by effectively detecting both longstring and random careless responses, there are contexts in which the models proposed by Arias et al. (2020) and Steinmann et al. (2022) may still be considered. Specifically, when researchers suspect that the dominant form of careless responding in their data is systematic straight-lining—such as when survey designs present highly repetitive items with minimal variation in content—Arias et al.'s or Steinmann et al.'s models, which are primarily sensitive to longstring behavior, may provide a targeted solution. In cases where data-quality concerns arise primarily from response bias due to acquiescence or inattentiveness to reverse-keyed items, Steinmann et al.'s model, with its asymmetric factor-loading constraints across item-keying directions, may be more theoretically appropriate. The user may choose to use one or more methods to examine the convergent results of those methods. After clicking the link, a user interface will open in a web browser.
To add the data we will use in the next step and the processing required for variables on the input interface, an empirical example is presented that shows how to input the variables and generate the Mplus file in the next section. Apart from the initial model specification in Step 1, the subsequent procedures for all three models are identical. The current demonstration uses the K–C Model as an example for further illustration.
Step 2
Step 2 involves filling in the parameters to generate the input syntax. As shown in Figure 1, the user must enter the names corresponding to all the items they need to use in “Item names” (in this example, self-esteem (SE) includes 10 items, so SE1–SE10 are entered) and, in “Reverse items,” the reverse-keyed items are entered (in this example, SE3, SE5, SE8, SE9, and SE10). In the “Name of Case ID” section, the variable is representing the participant number (it is “ID” in this example). In “Data file name” and “Save data file name,” the corresponding data file path and the location where the user wants to save the classification result file are entered. The rest of the parameters are set with default values, but users have the flexibility to modify them according to their specific analytical needs. In the “ESTIMATOR” box, users can input “MLR” for robust maximum likelihood estimation or any other valid Mplus estimator. The “TYPE” box should be set to “MIXTURE” for mixture modeling. The “STARTS” parameter set to “100 25” determines the initial approach for model estimation, where “100” represents the number of initial random starts to explore the parameter space and “25” designates the number of final optimizations performed after the initial exploration, aiming to fine-tune and select the best model fit. “STITERATIONS” determines the maximum number of iterations for the optimization algorithm during the initial stage of random starts. “PROCESS” stands for the number of processors for parallel computing. If the model fails to converge adequately, users can adjust the parameters by increasing the number of “STARTS” and “STITERATIONS.” For example, users can try increasing “STARTS” to “200 50” and “STITERATIONS” to 200. Users need to check the convergence and goodness of fit of the model after each adjustment to determine whether further adjustments are needed.

Operation interface of K–C model online app.
After entering all the parameters, “Generate the input file” is clicked and the code will be displayed in the “Generated Mplus Input File” text box. Finally, users can simply copy and paste the syntax file to Mplus. By entering the generated input syntax in Mplus and running the analysis, the output file containing the model analysis results will be automatically saved in the same folder. In the output path, the careless-response-detection results are obtained, which have been analyzed based on the K–C Model.
Step 3
Step 3 involves checking the analysis results of the FMM and the careless-response-detection results. Figure 2 shows part of the Mplus output.

Part of the Mplus output.
As shown under “FINAL CLASS COUNTS AND PROPORTIONS FOR THE LATENT CLASSES BASED ON THEIR MOST LIKELY LATENT CLASS MEMBERSHIP,” the model comprises two latent classes (as shown in Figure 2). Class 1 is the careless class, accounting for 10.08% of the participants, and Class 2 is the careful class, accounting for 89.92%. The classification quality of the model is acceptable (entropy = .87). Furthermore, Mplus provides goodness-of-fit indices, including the Akaike Information Criterion (AIC), Bayesian Information Criterion (BIC), and Sample-Size Adjusted BIC, for the purpose of model comparison (for working examples, see Kam & Cheung, 2024). The likelihood value (H0 = −520541.707) should be replicated at least several times (under “RANDOM STARTS RESULTS RANKED FROM THE BEST TO THE WORST LIKELIHOOD VALUES”).
Users should then check for any out-of-range parameters (unstandardized and standardized) for each class. Factor variances and residual variances should not be negative (as shown in Figure 3). The factor means for the careless class should be closer to the midpoint on a Likert scale than the careful class (see Kam & Cheung, 2024). The latent variable, C, captures careless (longstring) responses in Class 1 and content-relevant variables in Class 2 (the careful class). Random (careless) responses are captured by residuals in Class 1.

Model results.
To identify probable careless-responding cases, users can examine the classification results for individual cases in the file specified in “SAVEDATA,” which is “D:/0510/0510analysis.dat” in the example in Figure 1. The names of the variables in the datafile shown in Figure 4 can be found in the Mplus output.
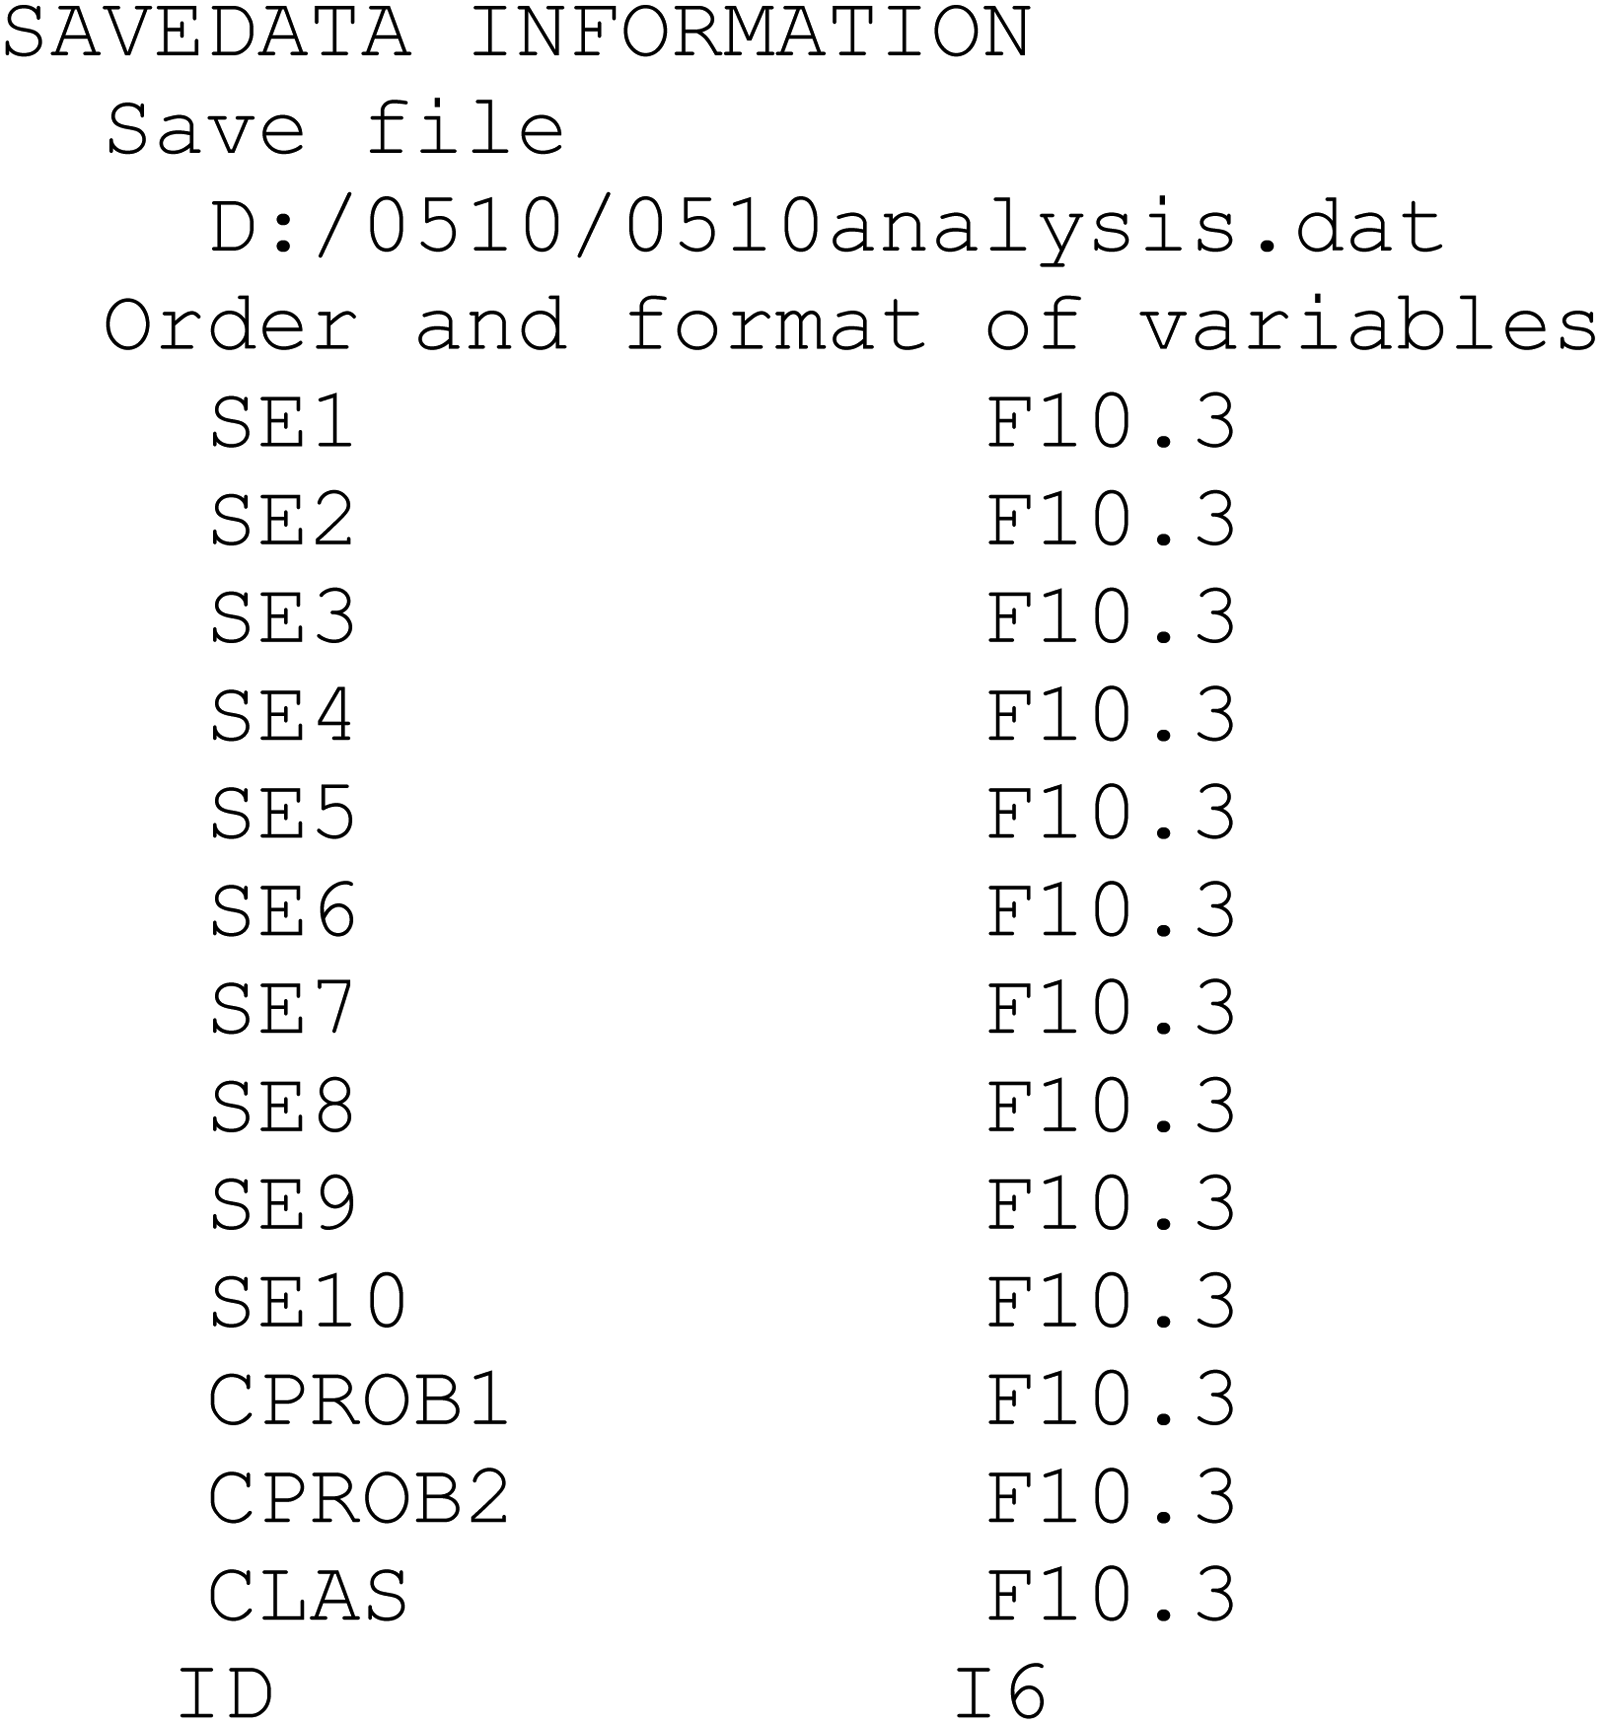
Save data information section of the Mplus output.
As shown in Figure 4, the last four columns of the output are the most important: CPROB1 and CPROB2 represent the estimated probabilities of a participant belonging to Class 1 (careless) and Class 2 (careful), respectively; CLAS indicates the class membership assigned by Mplus based on the higher probability; and ID corresponds to each participant’s identifier. The preceding columns (SE1–SE10) simply contain raw item responses and vary depending on the number of items in the factor. For example, in the cases listed in Figure 5, only Case 13 and Case 21 were assigned to Class 1, the careless class, while the other cases displayed were assigned to Class 2, the careful class.
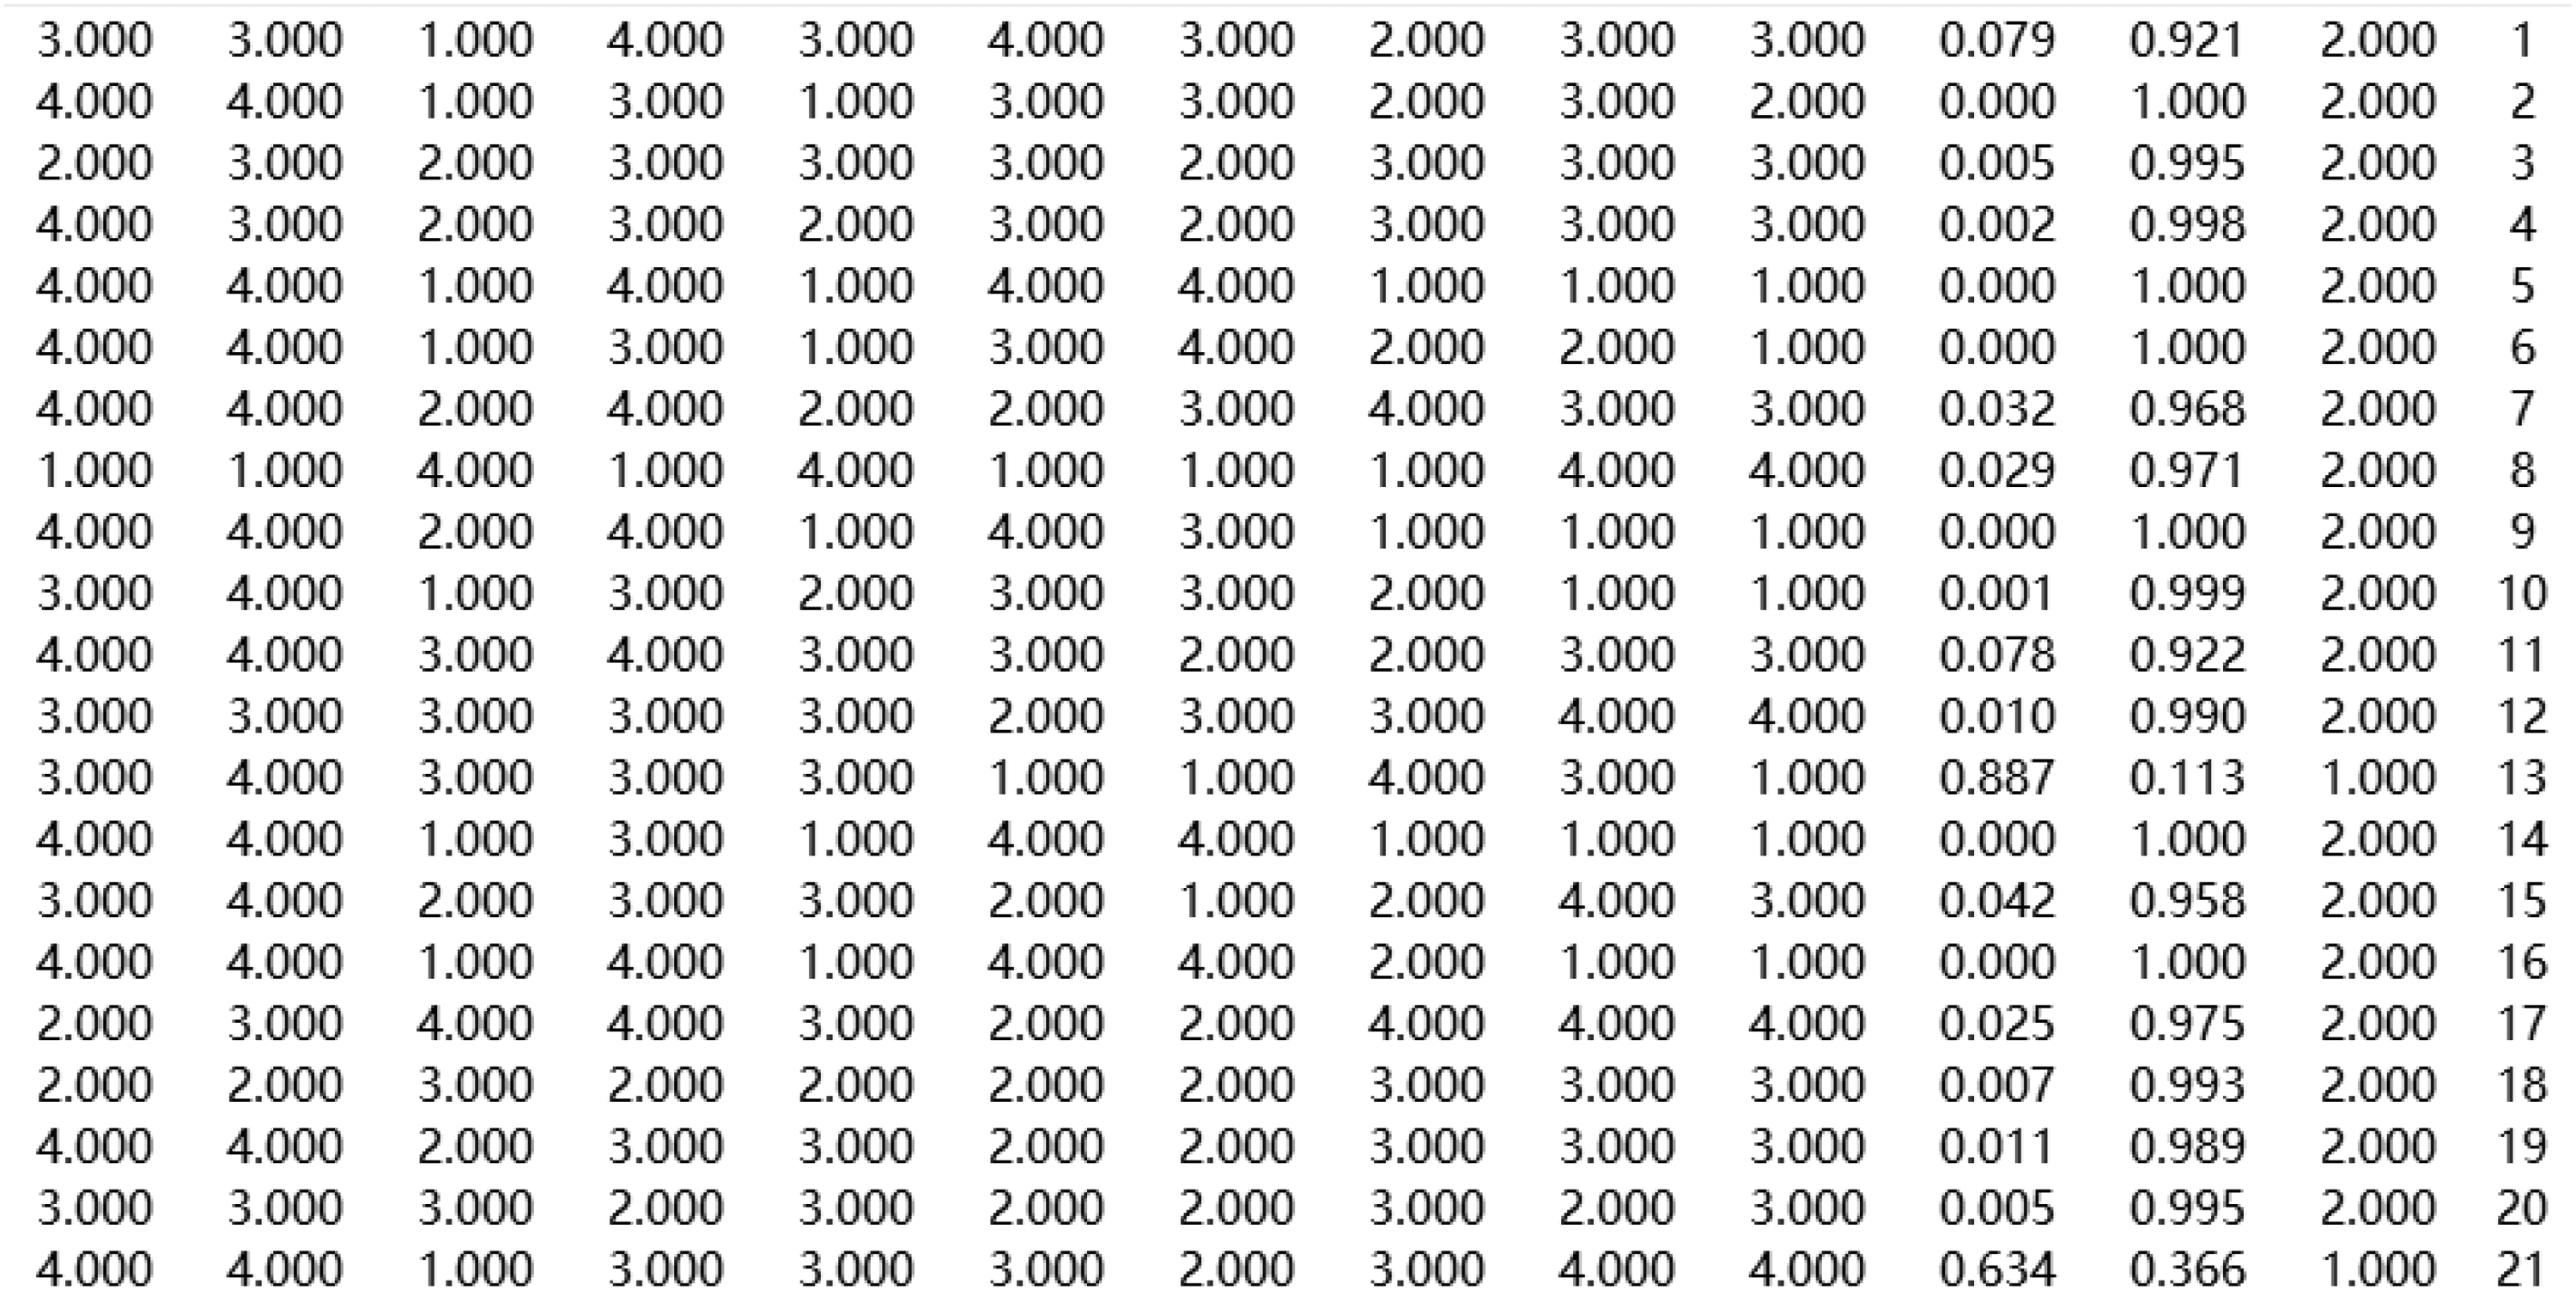
Results of careless-response detection.
Conclusion
This report responds to the recent call for the development of a more effective and convenient tool to tackle the alarmingly low rate of careless-response detection (Stosic et al., 2024; Ward & Meade, 2023). With the simple, easy-to-use online app, researchers can use FMMs to detect careless respondents in the popular statistical software Mplus. The factor-mixture-modeling procedure only requires a scale with at least three regular-keyed and three reverse-keyed items, which is common among psychological scales. The classification accuracy may be further enhanced when researchers average the classification probability across several scales (Kam & Cheung, 2024). They may then classify respondents as probable careless-responding cases when the average percentage is 50% or higher. The procedure requires no extra effort in data collection, which will encourage researchers to apply careless-response detection in standard data analysis procedures.
Footnotes
Declaration of conflicting interests
The author(s) declared no potential conflicts of interest with respect to the research, authorship, and/or publication of this article.
Funding
The author(s) disclosed receipt of the following financial support for the research, authorship, and/or publication of this article: The current research was financially supported by a Multi-Year Research Grant (grant number: MYRG2022-00073-FED) from the University of Macau to the corresponding author.