
Abstract
Recent research has underscored the rhythmic nature of visual perception, yet the connection between these perceptual rhythms, conscious awareness, and their underlying mechanisms remains largely elusive. This study employed a fine-grained temporal priming paradigm to investigate the oscillatory dynamics of face perception. In Experiment 1, we manipulated the awareness of prime stimuli to determine whether behavioral oscillations occur under both conscious and unconscious conditions. Our findings revealed significant theta-band oscillations in face perception under both conditions, suggesting that theta-band rhythmicity may be a fundamental feature of face perception, independent of conscious awareness. Experiment 2 investigated the influence of top-down predictions by using Mooney images as prime stimuli. Notably, theta-band behavioral oscillations emerged only when participants engaged prior configurational predictions to interpret Mooney faces. This highlights the role of top-down processes in modulating rhythmic face perception. Collectively, these results suggest that the brain may employ a generalized frequency-tagging mechanism in face perception, operating across different states of consciousness. These findings contribute to the understanding of the rhythmic basis of face perception, expanding insights into face processing across diverse visual contexts and emphasizing the role of neural oscillations in enabling predictive interpretation.
Keywords
Introduction
Our perception of the world, often experienced as continuous and seamless, increasingly appears to involve rhythmic sampling of environmental information rather than constant processing. This rhythmic sampling is evident across various visual stimuli, ranging from simple shapes to intricate scenes. Neuronal oscillations, a hallmark of electrophysiological signals, play critical roles in cognitive processes such as sensory processing and attention (Fries, 2015, 2023; Lakatos et al., 2008; VanRullen, 2016). For example, gamma oscillations (30–80 Hz) in the visual cortex enhance sensory processing efficiency, particularly for salient stimuli (Fries, 2005; Fries et al., 2001; Tallon-Baudry et al., 2005). These oscillations facilitate information integration and communication among neuronal populations, forming the foundation of effective cognitive function (Buzsáki, 2006; Fries, 2015, 2023; Helfrich & Knight, 2016; Herzog et al., 2020; Lakatos et al., 2019).
While gamma oscillations are essential for local sensory integration and feature binding, theta-band oscillations have emerged as a key mechanism for coordinating activity across distributed neural networks. These oscillations support global cognitive functions such as attentional selection, sensory sampling, and temporal integration (Fries, 2023; VanRullen, 2016). Theta oscillations cyclically modulate cortical excitability, segmenting sensory inputs into discrete temporal windows and facilitating the integration of predictive processing with incoming sensory information (Schroeder & Lakatos, 2009). This dynamic sampling mechanism enables the flexible allocation of attention across multiple objects or locations, thereby enhancing cognitive performance (Fiebelkorn & Kastner, 2019a, 2019b; Landau et al., 2015; Wang et al., 2020; Wutz et al., 2014). Moreover, theta oscillations are highly adaptive, resetting in response to task-relevant stimuli and reflecting sensitivity to environmental changes while dynamically modulating sensory processing (Bauer et al., 2020; Lakatos et al., 2007; Thorne & Debener, 2014).
Recent studies suggest that theta-band oscillations underlie behavioral rhythms observed across diverse cognitive domains, including attentional sampling, sensory perception, working memory and motor actions (Baumgarten et al., 2017; Bell et al., 2020; Benedetto & Morrone, 2017; Cha & Blake, 2019; Ho et al., 2017, 2019, 2022; Pomper & Ansorge, 2021; Tomassini et al., 2015). Behavioral studies using dense-sampling designs, which measure reaction times or accuracy as a function of interstimulus intervals (SOAs), demonstrate that prime stimuli can reset brain oscillations. This reflects the influence of intrinsic neuronal rhythms on explicit behavioral responses, suggesting that primes initiate perceptual predictions, with neural oscillations integrating predictive processing and sensory input (Drewes et al., 2015; Huang et al., 2015; Song et al., 2014). While behavioral oscillations have been extensively studied in conscious visual perception, their presence during unconscious visual stimuli processing remains uncertain, despite evidence that unconsciously perceived stimuli significantly influence behavior and neural activity (Axelrod et al., 2015; Hesse & Tsao, 2020; King et al., 2016; Mudrik & Deouell, 2022; Soto et al., 2011, 2019).
This study investigates the relationship between conscious awareness and behavioral oscillations in face perception. In Experiment 1, we manipulated the conscious awareness of the prime stimulus to determine its effect on behavioral oscillations in a priming task. Extensive research suggests that the left and right face-selective areas, specifically the fusiform face area (FFA), serve distinct functional roles in face perception. The right FFA, linked to the left visual field (LVF), predominantly engages in holistic face processing, whereas the left FFA, associated with the right visual field (RVF), is more involved in feature-based analysis (Cattaneo et al., 2014; Jacques & Rossion, 2009; Ramon & Rossion, 2011; Rossion et al., 2000, 2011; Rossion & Lochy, 2022; Schiltz & Rossion, 2006). The left FFA displays a graded response as image stimuli become increasingly face-like, while the right FFA demonstrates a categorical distinction between faces and non-faces (Goold & Meng, 2017; Meng et al., 2012). Given this hemispheric asymmetry, we further explored how hemispheric differences contribute to behavioral oscillations by presenting targets in the LVF or RVF.
Face perception involves both sensory input and top-down predictive information, where prior knowledge or predictive cues substantially shape sensory interpretation. Mooney face images, with their minimal textural detail and binary black-and-white format, pose a recognition challenge resolved primarily through top-down processing. Mooney images thus provide an ideal context to explore the role of configurational predictions in rhythmic face perception. In Experiment 2, we used Mooney faces as prime stimuli, manipulating the presence of anticipatory predictions to investigate whether these predictions induce theta-band behavioral oscillations.
Our findings revealed significant theta-band oscillations in face perception, occurring under both conscious and unconscious prime conditions. This suggests that rhythmic face perception may operate independently of conscious awareness. Furthermore, we observed visual field differences in behavioral oscillations: oscillations emerged for invisible primes in the LVF and visible primes in the RVF. These results indicate that perceptual processing is highly adaptable, influenced by stimulus visibility and lateralization. Notably, Experiment 2 demonstrated that theta-band rhythmic fluctuations occurred only when participants had prior expectations about face configuration, underscoring the importance of top-down processes in rhythmic perception.
Experiment 1
In this experiment, we investigated whether an invisible prime, achieved by manipulating the level of conscious awareness, could elicit behavioral oscillations. Understanding the influence of unconscious stimuli on behavioral rhythms is crucial for unraveling the mechanisms underlying cognitive processing and neural oscillations. To achieve stimulus invisibility, we employed two well-established paradigms: backward masking (BM) and continuous flash suppression (CFS). These paradigms are widely recognized in the study of unconscious processing, and their complementary characteristics allow for a comprehensive exploration of the relationship between unconscious stimuli and behavioral rhythms. BM and CFS suppress visual awareness through distinct mechanisms, targeting different stages of visual processing. In BM, a low-contrast, near-threshold prime is briefly presented and immediately followed by a visual mask, disrupting early stage processing and often preventing conscious recognition of the prime (Almeida et al., 2008; Bugmann & Taylor, 2005; Knotts et al., 2018) Conversely, CFS achieves suppression through interocular competition, wherein a high-contrast dynamic mask presented to one eye suppresses the visibility of the prime presented to the other eye. Evidence suggests that unconscious processing under CFS is more limited than under BM, with several failures to obtain evidence for picture priming at the categorical level (Kang et al., 2011; Stein et al., 2020; Yang et al., 2017). By using these two paradigms, we aimed to capture complementary evidence regarding the role of unconscious processing in inducing behavioral oscillations.
The central question of Experiment 1 was whether unconscious processing, as achieved through BM and CFS, could influence neural oscillations and subsequent behavior. If an invisible prime behaves similarly to a visible one, we would expect dynamic changes in behavior across SOAs, indicating that unconscious stimuli can reset ongoing neural oscillations. Conversely, if an invisible prime fails to induce these changes, it would imply that conscious awareness is essential for resetting neural rhythms and driving rhythmic behavioral patterns.
Methods
Participants
We recruited 18 right-handed participants (mean age: 26.5 years) for the BM experiment (Experiment 1a), and another 18 right-handed participants (mean age: 27.4 years) for the CFS experiment (Experiment 1b). However, two participants in each experiment were unable to complete the tasks successfully and were excluded from the final analysis. This resulted in a final sample size of 16 participants for both the BM and CFS experiments. Additionally, 18 right-handed participants (mean age: 24.8 years) were recruited for the visible control task.
All participants had normal or corrected-to-normal visual acuity and provided written informed consent prior to the study. The study was approved by the Human Research Ethics Committee for Non-Clinical Faculties at the School of Psychology, South China Normal University, ensuring adherence to ethical guidelines.
Power analysis
A power analysis was conducted using G*Power 3.1, based on effect sizes reported in previous studies (Huang et al., 2015; Faul et al., 2007; Wang & Luo, 2017). The analysis targeted a medium effect size with 90% statistical power at an alpha level of 0.05. Given the high expected correlation among repeated measures due to consistent reaction times (RTs) over time, we used the default correlation value of 0.50. The power analysis indicated a 93.2% probability of correctly rejecting the null hypothesis with a sample size of 15 participants per group.
Apparatus and stimuli
All experiments were conducted on a VIEWPixx monitor with a refresh rate of 100 Hz and a screen resolution of 1920 × 1080. Stimuli were generated using MATLAB (R2016a, The MathWorks) and the Psychophysics Toolbox (Brainard, 1997). Participants were seated in a darkened room, positioned 90 cm from the monitor, with their heads stabilized by a chin rest. Responses were recorded using a keyboard.
The face stimuli consisted of grayscale images selected from the Face Research Lab London Set (DeBruine & Jones, 2017), including eight males and eight females with neutral expressions. House stimuli were sourced from the Google picture dataset. To ensure consistency, the original color images were converted to grayscale, and the contrasts of face and house stimuli were equalized using the SHINE toolbox (Willenbockel et al., 2010). Face images were cropped to remove hairlines, while house images were cropped to match the same size. All stimuli subtended a visual angle of 3.2°, with stimuli for the left or right visual field centered 7.6˚ from the fixation point (Figure 1(a)).

(a) Schematic of the experimental procedure in Experiments 1 and 2. Participants were presented with a prime followed by a target stimulus. Their task was to categorize the target (face or house) as quickly and accurately as possible while maintaining fixation on the central cross. The target appeared at varying intervals, with time intervals (SOAs) pseudorandomly set between 20 to 800 ms in 20 ms increments, balanced across all conditions. (b) Stimuli and conditions. Each experiment comprised 8 conditions with 40 SOAs each, resulting in a total of 320 conditions.
Experiment procedure
In Experiment 1, prime stimulus invisibility was achieved using two techniques: backward masking (BM, Exp. 1a) and continuous flash suppression (CFS, Exp. 1b). The QUEST adaptive staircase procedure was employed to determine the optimal contrast for the prime stimuli (Watson & Pelli, 1983). Participants completed a two-alternative forced-choice task to discriminate between face and house categories, with the contrast threshold set at the level yielding 75% correct responses (Klein, 2001; Roesch, 2010; Watson & Pelli, 1983). To ensure invisibility, the final contrast of the prime stimuli was adjusted below the QUEST-determined threshold by 0.05 to 0.25 contrast units, depending on participant performance.
To comprehensively evaluate behavioral performance over time, we employed a fine-scale, time-resolved measurement approach in the Posner task (Posner, 1980). This method involved densely varying the time intervals between the prime and target stimuli. SOAs (stimulus onset asynchronies) ranged from 20 to 800 ms in 20 ms increments, providing a high temporal resolution of 50 Hz.
Each trial began with a 500 ms fixation period, during which participants were instructed to maintain their gaze on a central cross. In the BM experiment (Exp. 1a, Figure 1(a)), a low-contrast prime (M ± SD = 0.30 ± 0.066) near the perceptual threshold was displayed at the center of the screen for 50 ms, followed by a 100 ms mask. To confirm prime invisibility, participants pressed the space bar if they believed they saw the prime. Trials with a space bar response were discarded and repeated at the end of the block (M ± SD = 5.25% ± 2.07%). After various SOAs, a target image and a phase-shuffled noise image were displayed for 200 ms in either the left visual field (LVF) or right visual field (RVF), followed by a 100 ms mask. Participants categorized the target as a face or a house by pressing the “M” key for faces and the “L” key for houses with their right hand. Reaction times (RTs) were recorded from target onset.
In the CFS experiment (Exp. 1b, Figure 1(a)), a 200 ms mask was displayed following the fixation period. During a 500 ms CFS-prime presentation, dynamic Mondrian-like masks at 100% contrast were shown to the dominant eye at 10 Hz (100 ms per frame), while a low-contrast prime (M ± SD = 0.32 ± 0.062), also near the perceptual threshold, was presented to the non-dominant eye. The mean percentage of trials in which participants noticed the prime and pressed the “abort” button was 4.28% ± 2.16% (M ± SD), and these trials were repeated at the end of each experimental block.
The BM and CFS tasks were conducted as separate experiments within the framework of Experiment 1, alongside a visible control task (Exp. 1 control, Figure 1(a)). The visible control task followed the same procedure as the BM experiment, except that the prime was presented at 100% contrast. To minimize potential order effects, we counterbalanced certain aspects within each task. Specifically, for each experimental task, the order of stimulus conditions and SOA intervals was randomized across trials for each participant.
Throughout the experiment, a central fixation cross was continuously presented, and participants were explicitly instructed to maintain their gaze on it (as depicted in Figure 1(a)). To ensure adherence to this instruction, we monitored the eye gaze in a subset of participants (N = 10) using a Tobii 2 eye-tracking device (60 Hz). Trials where participants broke fixation (defined as an eye movement greater than 2.2˚ from the central fixation cross) were canceled and repeated at the end of each experimental block. Participants maintained fixation with high consistency: mean fixation distances were 2.24˚ (SD = 0.86˚) in Exp.1a, 2.83˚ (SD = 0.65˚) in Exp.1b, and 3.56˚ (SD = 0.34˚) in the control task.
The experimental design included congruent (same category, such as face-face (FF) and house-house (HH)) and incongruent (different categories, such as house-face (HF) and face-house (FH)) prime-target pairings (see Figure 1(b)). Each experiment followed a factorial design with the following factors: prime category (face/house), target category (face/house), target location (left/right visual field), SOA (ranging from 20 to 800 ms in 20 ms increments), and 16 repetitions of each condition. Each experiment consisted of 8 blocks, with 640 trials per block. Conditions and SOAs were evenly randomized across blocks. Participants were allowed to take self-paced breaks between blocks.
Openness and transparency
All data and analysis code have been made publicly available via the Open Science Framework (OSF) and can be accessed at https://osf.io/6cqhu/?view_only=f5b5aa009c4d4b969832822b68a9ac9c.
Data analysis
Reaction times (RTs) as a function of SOAs were analyzed using MATLAB and the EEGLAB toolbox. To ensure data quality, trials with RTs exceeding two standard deviations (SDs) from the mean across all trials were excluded. The remaining RTs were normalized within each participant using z-scores to account for inter-participant variability in mean response performance. Temporal profiles of normalized RTs as a function of SOAs were then calculated separately for congruent (LFF, RFF, LHH, RHH) and incongruent (LHF, RHF, LFH, RFH) conditions for each visual field.
Following established methodologies (Song et al., 2014; Huang et al., 2015; Fan et al., 2023; Fiebelkorn et al., 2013; Landau & Fries, 2012), a moving window (size = 3) was applied to smooth the z-scored RTs for each trial. A quadratic function (second-order polynomial) was then fitted to the RT time courses to extract a slowly developing trend. This trend was subtracted from the normalized RT time courses, yielding detrended RT temporal profiles.
To examine the spectral characteristics of the detrended RTs, a Fast Fourier Transform (FFT) was performed, transforming the behavioral performance data from the time domain into the frequency domain. Zero padding was applied to the detrended RT time profiles to extend the FFT results, allowing finer frequency resolution and a smoother spectrum. A Hanning window was also applied before the FFT to reduce spectral leakage. Differences in amplitudes between congruent and incongruent conditions were computed separately for each visual field.
Two complementary methods were employed to assess the significance of observed oscillations. First, we used the commonly adopted time-shuffling procedure (Fiebelkorn et al., 2013; Huang et al., 2015; Landau & Fries, 2012; Song et al., 2014; Wang et al., 2020). The time course of RTs was shuffled, and the spectrum was calculated using the same FFT method as for the empirical data. After 1,000 randomizations, the p-values for each frequency were calculated by determining the proportion of shuffled amplitudes that exceeded the empirical amplitude. Multiple comparisons across frequencies were corrected using the Bonferroni correction.
Second, to address potential biases from time shuffling, which may disrupt aperiodic temporal structures due to autocorrelation, we applied a first-order autoregressive model (AR(1)) as proposed by Brookshire (2022). This model distinguishes rhythmic components from arrhythmic structures in the data. For each participant, the binned time series of target detection performance was modeled using maximum likelihood estimation via a Kalman filter. This approach captures first-order aperiodicity without introducing artificial periodicity. From the AR(1) model, 5,000 surrogate time series were generated and processed similarly to the real data (detrended and subjected to FFT). Frequencies where the empirical power spectrum exceeded the 95th percentile of the surrogate distribution were deemed significant (Brookshire, 2022).
Results
The mean accuracy rates across all participants were 97.3 ± 1.4% (M ± SD) for Experiment 1a (backward masking, BM), 96.2 ± 1.8% for Experiment 1b (continuous flash suppression, CFS), and 97.5 ± 1.3% for the control task (Visible). Only correct trials were included in subsequent analyses. Figure 2(a) depicts normalized RTs as a function of SOAs under congruent (red) and incongruent (black) conditions, averaged across participants for each visual field of target presentation. Significant priming effects were observed in the BM and visible control tasks for both LVF and RVF when target was a face. For BM, longer RTs were found for incongruent compared to congruent condition (T(15) = 3.827, p = 0.002 for LVF; T(15) = 4.247, p = 0.001 for RVF). Similar effects were observed in the visible control task (T(17) = 5.599, p = 0.001 for LVF; T(17) = 5.378, p = 0.001 for RVF; Figure 2(a), top and bottom rows). However, no significant priming effects were evident in the CFS experiment (T(15) = 1.727, p = 0.108 for LVF; T(15) = 1.411, p = 0.182 for RVF; Figure 2(a), middle row).
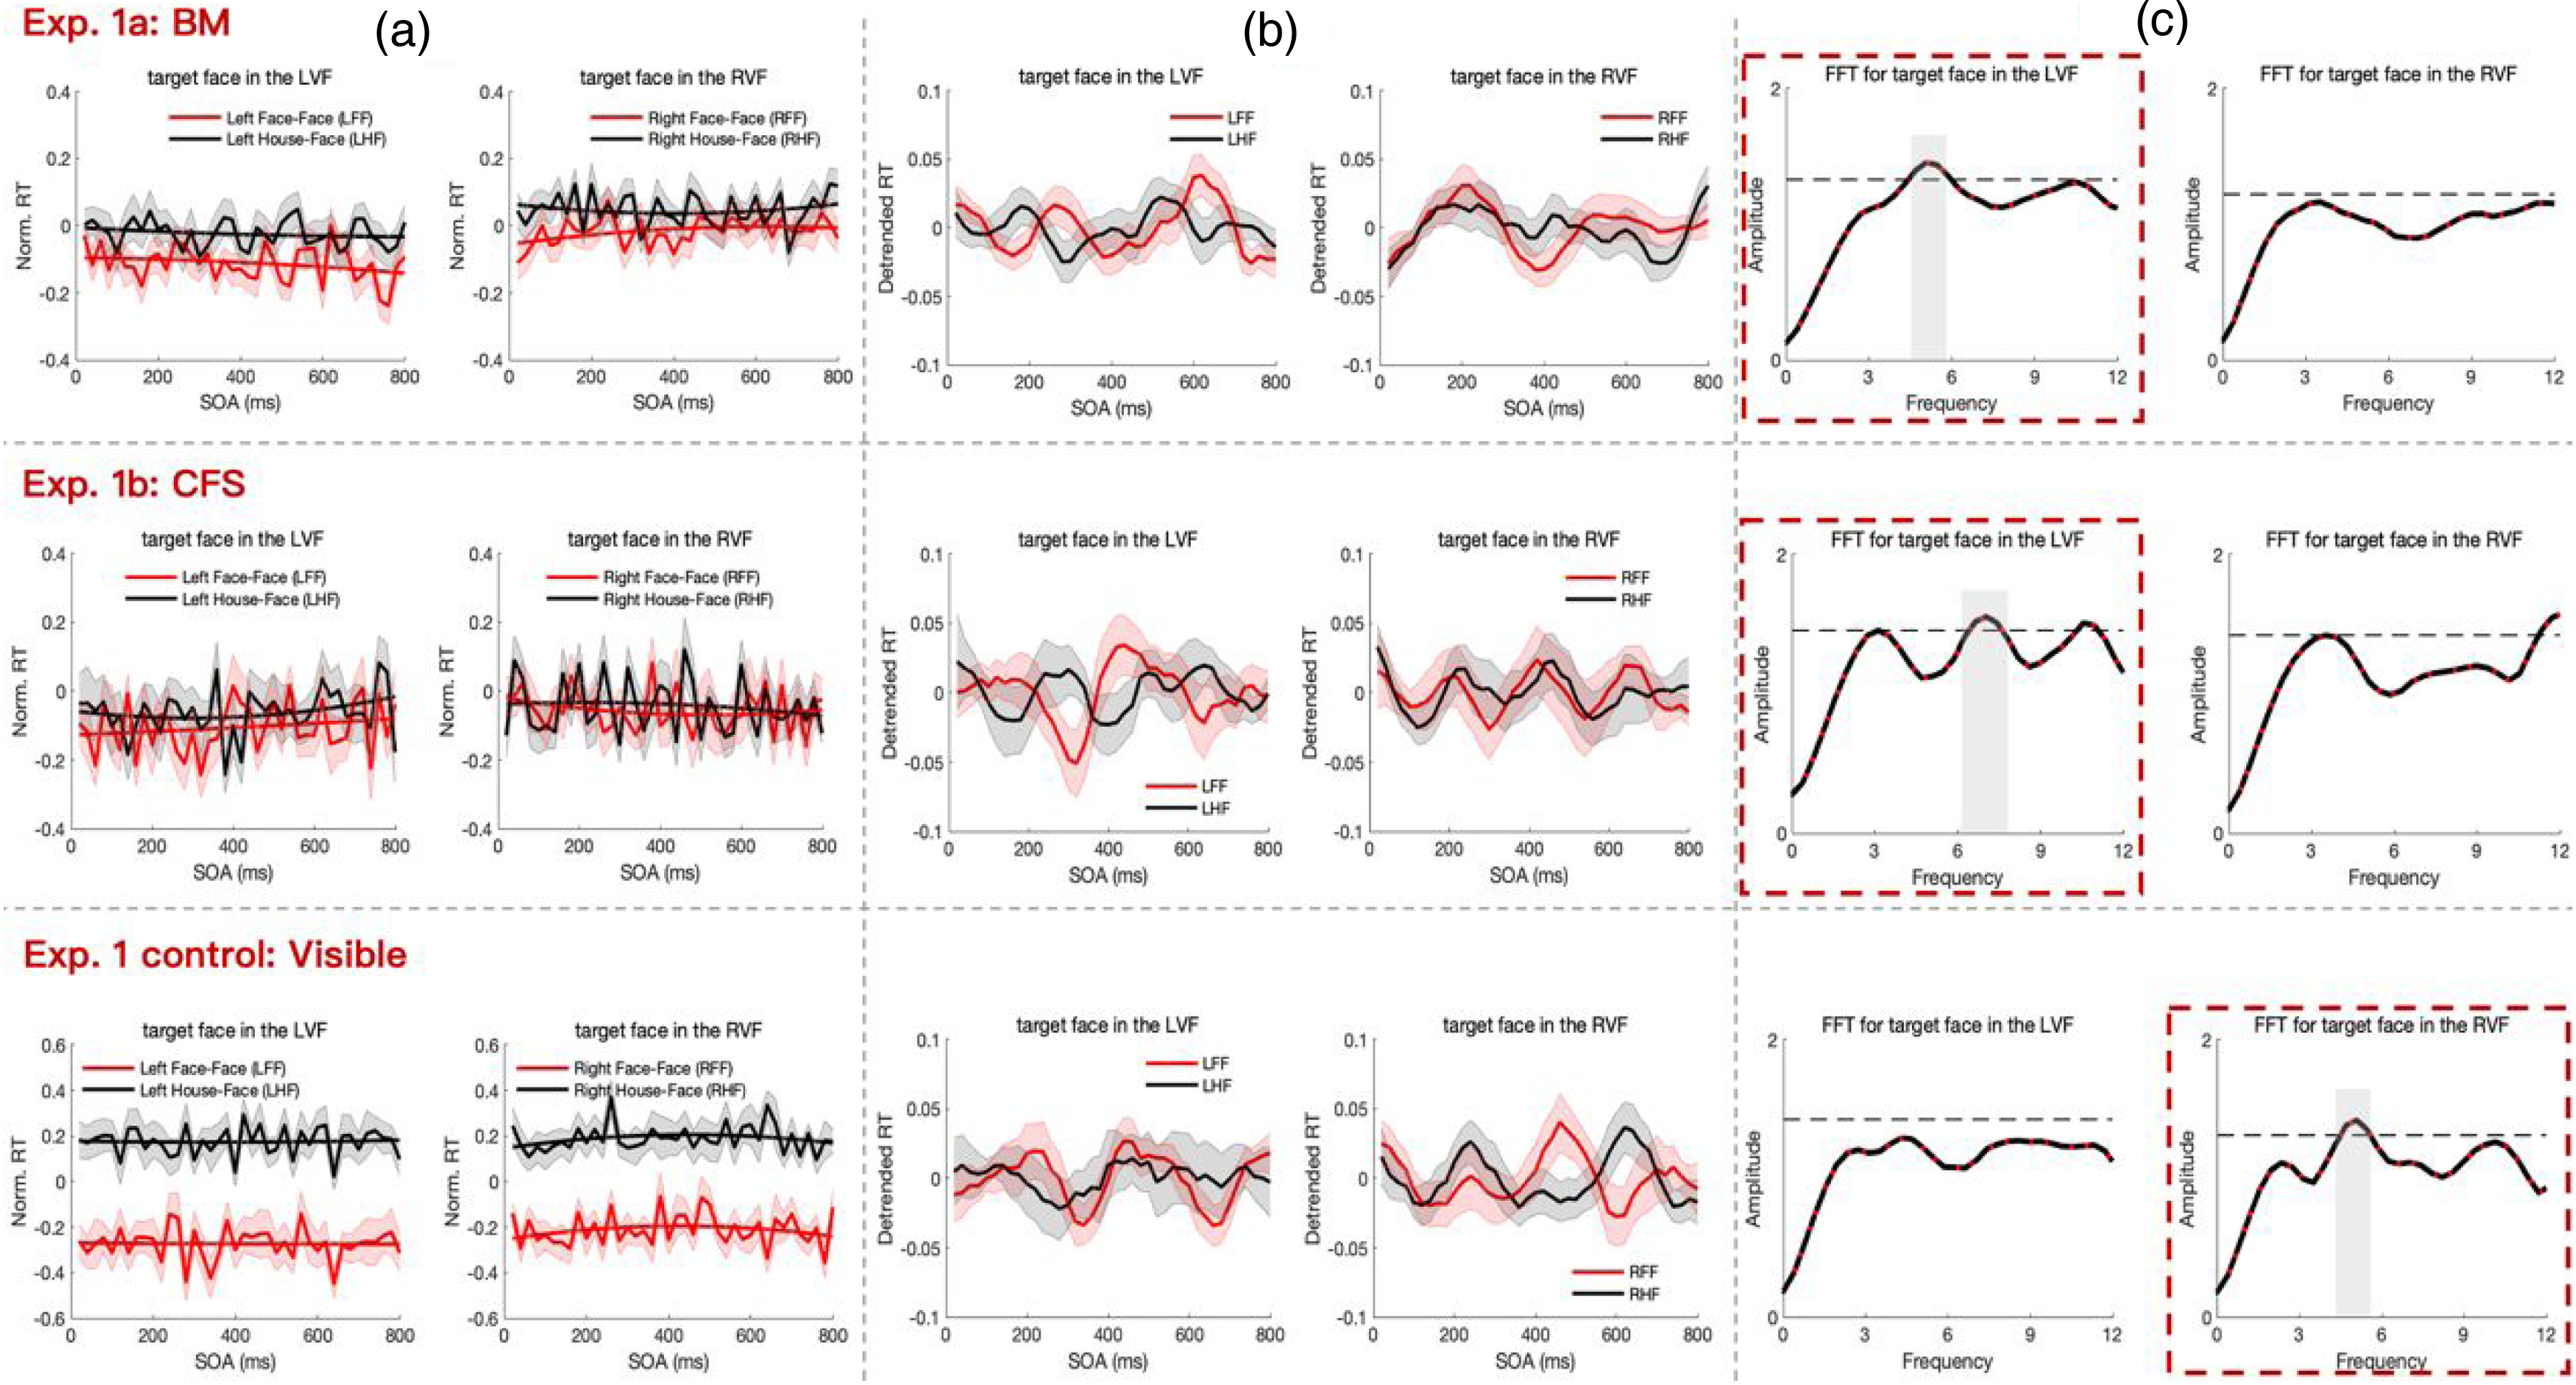
Results of Experiments 1a (top), 1b (middle) and the control task (bottom). (a) Temporal profiles of normalized RTs are depicted with thin lines, while slowly developing trends are illustrated with bold lines. Shaded regions denote ± SEM of the normalized RTs. (b) Temporal profiles of detrended RTs are obtained by subtracting the trends from the normalized RTs in panel A, shown with thin lines. (c) The spectrum of detrended RTs for congruent minus incongruent conditions is presented. The black dashed line represents the 5% significance threshold (permutation test, N = 1000).
To explore dynamic patterns in the temporal profiles of RTs, slowly developing trends were extracted from each participant's behavioral time course (Figure 2(a), bold lines). These trends were removed from the corresponding normalized RTs to eliminate potential interference from classical priming and expectancy effects, revealing detrended behavioral time courses (Figure 2(b)). Oscillatory patterns over time were observed in the detrended RTs for both invisible prime experiments (BM and CFS) when the target was a face presented in the left visual field (LVF). In contrast, for the visible experiment (control task), oscillatory patterns emerged in the right visual field (RVF) (Figure 2(b)).
To further characterize these behavioral oscillatory patterns, FFT analysis was applied to the detrended RTs for each condition. Non-parametric permutation tests (N = 1000) assessed the statistical significance of spectrum amplitudes. Figure 2(c) displays the grand average power spectrum for the detrended RTs, comparing the congruent and incongruent conditions for each visual field. In the BM experiment, a significant oscillation at approximately 5 Hz (p < 0.05, corrected) was observed when the target face was presented in the LVF (Figure 2(c), top row with red box). In the CFS experiment, significant oscillations in the 6–8 Hz range (p < 0.05, corrected) were found when the target face appeared in the LVF (Figure 2(c), middle row with red box). In the visible experiment, a significant oscillation at approximately 5 Hz (p < 0.05, corrected) was observed when the target face appeared in the RVF (Figure 2(c), bottom row with red box). No significant oscillatory components were detected when the target was a house (see supplementary Figure S2).
Furthermore, an autoregressive (AR) model confirmed significant theta-band oscillations when the target face was presented in the LVF during the BM experiment and in the RVF during the visible experiment. However, no significant oscillations were identified in the CFS experiment.
Experiment 2
In Experiment 1, we observed significant theta-band oscillations under both visible and invisible prime conditions, with oscillations prominently lateralized to different visual fields. This finding raised questions about the underlying mechanisms. Substantial evidence suggests two distinct, lateralized face-processing systems: the right hemisphere, which specializes in holistic facial information, and the left hemisphere, which focuses on featural information (Bourne et al., 2009; Goold & Meng, 2017; Meng et al., 2012; Rossion et al., 2000, 2011). Neuroimaging studies have shown that the fusiform face area (FFA) exhibits heightened activity in response to two-tone Mooney stimuli perceived as faces (Andrews & Schluppeck, 2004; Dolan et al., 1997; McKeeff & Tong, 2006; Rossion et al., 2011). Mooney faces are inherently ambiguous due to their minimal texture information and rely heavily on pre-existing expectations of facial configuration for recognition. This characteristic provides precise control over low-level visual inputs, making Mooney faces an ideal tool for examining the role of top-down cognitive predictions in rhythmic face perception. Behavioral changes related to the perception of Mooney images can therefore be attributed to the influence of prior predictions, offering a unique framework to study this phenomenon.
To further investigate lateralized theta oscillations in face processing, we used Mooney images as primes in Experiment 2, which was divided into two parts: Experiment 2a and Experiment 2b. Both parts employed the same set of unrecognizable Mooney images as primes. However, Experiment 2b included a preceding training phase to familiarize participants with the Mooney images, potentially shaping their expectations. This experimental design allowed us to explore whether prior exposure to Mooney images influences lateralized theta oscillations and the underlying face-processing mechanisms.
Methods
Participants
A total of 32 right-handed participants (14 males, average age 24.5 years) were recruited for this study. Sixteen participants took part in a pilot experiment, and the remaining 16 completed Experiments 2a and 2b sequentially. All participants had normal or corrected-to-normal visual acuity and provided written informed consent prior to participation.
Stimuli and experiment procedure
Mooney images were derived from grayscale photographs of real-world faces and houses sourced from Google Images datasets. The grayscale images were resized to match the dimensions used in Experiment 1 and subjected to Gaussian filtering to reduce high-frequency components and blur specific image regions. A Gaussian filter with a sigma value of 2 and a filter size of 10 × 10 pixels was applied, making it difficult to categorize the Mooney images without referencing their corresponding grayscale versions. Mooney images were then created by applying a threshold to the grayscale images, with the threshold level set to the mean intensity of all images.
To ensure the suitability of the stimuli, a pilot study was conducted with 16 additional volunteers. During the pilot, participants viewed each Mooney image at the center of the screen and were instructed to identify as many categories as possible, recording their responses in a text box below the image. Participants also rated the resemblance of the images to faces and houses using a five-point scale. Based on these ratings, eight Mooney images were selected for the main experiment: four faces and four houses. These images had average rating scores of 1.2 and 0.9 for face and house resemblance, respectively.
The experimental procedure for Experiment 2 was closely aligned with that of Experiment 1. Each trial began with a 500 ms central fixation, followed by a centrally presented Mooney prime displayed for 50 ms and succeeded by a 100 ms mask. After the mask, a delay period with varying intervals was introduced. Subsequently, a lateral grayscale target, paired with a phase-matched noise image, appeared for 200 ms, followed by a 100 ms mask. Before commencing Experiment 2b, participants were introduced to the unambiguous grayscale versions of the Mooney images. To confirm that participants had successfully acquired prior knowledge of the Mooney images, they completed a Mooney-grayscale image matching task. Participants were required to achieve an accuracy rate of at least 97% before proceeding to the main experiment.
Results
The mean accuracy rates across all participants were 96.5 ± 1.6% (M ± SD) in Experiment 2a and 96.8 ± 2.1% in Experiment 2b. Figure 3(a) illustrates the normalized RTs as a function of SOAs for congruent (red) and incongruent (black) conditions across each visual field of target presentation. Significant differences in RTs between incongruent and congruent conditions were observed after participants acquired prior knowledge of Mooney images in Experiment 2b (T(15) = 2.53, p = 0.02 for LVF and T(15) = 2.675, p = 0.03 for RVF). No significant differences in RTs between incongruent and congruent conditions were found in Experiment 2a (T(15) = 1.4, p = 0.09 for LVF and T(15) = 0.202, p = 0.84 for RVF).

Results of Experiment 2a (top) and 2b (bottom). (a) Temporal profiles of normalized RTs are shown with thin lines, while the slowly developing trends are illustrated with bold lines. Shaded regions denote ± SEM of the normalized RTs. (b) Temporal profiles of detrended RTs are obtained by subtracting the trends from the normalized RTs in panel A. (c) The spectrum of detrended RTs for congruent minus incongruent conditions is presented. The black dashed line represents the 5% significance threshold (permutation test, N = 1000).
To investigate dynamic patterns in the temporal profiles of RTs, detrended RTs were calculated by removing slow-developing trends from the normalized RTs (Figure 3(b)). These detrended RTs exhibited oscillatory patterns over time, particularly between congruent and incongruent conditions when the target was a face presented in the LVF. Fluctuations in detection performance under congruent and incongruent conditions were evident (Figure 3(b)). To further analyze these oscillatory patterns, individual time courses were transformed into the frequency domain, and significant oscillation frequencies were identified using a nonparametric temporal shuffling test.
FFT analysis and permutation tests revealed a significant oscillation at 4–5 Hz (p < 0.05) when the target face was presented in the LVF in Experiment 2b (Figure 3(c), highlighted in red). This finding aligns with results observed in unconscious face prime conditions. Importantly, the significant oscillation persisted even after conducting autoregressive (AR(1)) model testing, suggesting that the observed oscillatory pattern in behavioral time courses was not merely attributable to an AR(1) process (Brookshire, 2022). No significant oscillatory components were found in Experiment 2a, where the prime images remained ambiguous to participants. Similarly, no significant oscillatory components were found when the target was a house (see supplementary Figure S3).
In summary, theta-band rhythmic fluctuations in behavior were observed only when participants applied prior knowledge to interpret and disambiguate Mooney faces. Initially, participants perceived novel, ambiguous Mooney faces as unrecognizable patterns of black-and-white fragments. However, after applying the configural pattern of a face—a process heavily reliant on top-down predictions—participants successfully organized these fragments into a coherent facial perception. These findings underscore the critical role of top-down processing in the rhythmic perception and disambiguation of complex visual stimuli.
Discussion
Our study provides novel insights into the shared neural oscillatory mechanisms underlying unconscious and conscious face processing, particularly through theta-band oscillations. Both visible and invisible primes elicited behavioral oscillations, indicating that rhythmic face perception operates independently of conscious awareness. These findings underscore the pivotal role of top-down predictions, particularly in holistic face processing. Visual field asymmetries were observed: invisible and Mooney primes induced theta-band rhythmic fluctuations in the left visual field (LVF), whereas visible primes elicited oscillations in the right visual field (RVF). This lateralization is consistent with hemispheric specialization in face processing, highlighting the dynamic interplay between brain regions involved in facial information processing.
Unconscious processing of holistic face information appears to modulate intrinsic neural oscillations, shaping subsequent perceptual experiences (Ren et al., 2021; Zhou et al., 2021). Notably, theta-band behavioral oscillations predominantly occurred in the LVF under invisible prime conditions, a pattern also observed with Mooney images. This suggests that, under ambiguous visual conditions, the brain relies on holistic face information to resolve uncertainty and anticipate perceptual outcomes. While our results support the notion that the human brain primarily processes faces holistically, particularly under reduced visibility (Chung et al., 2018; Collishaw & Hole, 2000; Fan et al., 2020; Maurer et al., 2002; Rossion, 2009; Tanaka & Farah, 1993; Taubert et al., 2011; Tsao & Livingstone, 2008; Wilford & Wells, 2010), we acknowledge that face orientation (e.g., upright versus inverted faces) was not explicitly manipulated in our study. Future research should directly investigate the role of face orientation in modulating neural oscillations to confirm these findings.
Leveraging configural predictions facilitates rapid face recognition, consistent with the predictive coding framework, where neural oscillations mediate the brain's predictions about incoming sensory inputs (Alamia & VanRullen, 2019; Huang et al., 2015). These oscillations function as temporal markers, modulating the brain's response to sensory input, akin to a “perceptual echo” (Bell et al., 2020; VanRullen, 2016, 2018; VanRullen & Macdonald, 2012). Our results emphasize the importance of top-down predictions in rhythmic face perception, particularly under reduced visibility (e.g., with Mooney images). In ambiguous conditions, global configural predictions engages the right hemisphere's dominance in holistic face processing (Bourne et al., 2009; Cattaneo et al., 2014; Farzin et al., 2009; Jacques & Rossion, 2009; Ma & Han, 2012; Maurer et al., 2007; McKeeff & Tong, 2006; McKone, 2004). Consequently, configural predictions related to face information predominantly lateralize behavioral oscillations to the LVF. Conversely, visible faces, which engage local feature processing primarily by the left hemisphere, result in oscillatory patterns lateralized to the RVF (Meng et al., 2012; Ramon & Rossion, 2011; Rossion et al., 2011; Schiltz & Rossion, 2006).
Theta-band oscillations (∼5 Hz) have been implicated in face identity priming (Wang & Luo, 2017) and other face-related tasks such as gender discrimination (Bell et al., 2020; Blais et al., 2013; Vinette et al., 2004). Our findings align with these studies, supporting the hypothesis that frequency-tagging is central to rhythmic face perception. These synchronized oscillations underscore the temporal dynamics of priming and suggest that theta-band activity is essential for processing perceptual experiences across varying states of consciousness (Bell et al., 2020). In contrast, house stimuli, which are processed more based on features and rely on distributed templates, elicited less consistent theta-band oscillations, likely reflecting distinct neural and attentional mechanisms (Wilford & Wells, 2010).
Face perception relies on a distributed network of cortical and subcortical regions, including the fusiform face area (FFA), occipital face area (OFA), superior temporal sulcus (STS) and prefrontal cortex (PFC), which collectively facilitate detection, recognition, and emotional processing (Haxby et al., 2000; Kanwisher, 2010; Pinsk et al., 2005; Tsao et al., 2003; Tsao & Livingstone, 2008). These regions form an interconnected network, with each area performing specialized functions while maintaining integration through long-range connections (Freiwald et al., 2016; Freiwald, 2020). Theta-band neural oscillations play a critical role in sensory integration, attention, and memory, which are critical processes for segmenting sensory inputs and modulating cortical excitability (Fiebelkorn & Kastner, 2019a, 2019b; VanRullen, 2016). These oscillations facilitate temporal coordination of neural activity across distributed networks and synchronize brain regions involved in face perception, providing a temporal framework for sensory integration (Buzsáki, 2006). Through these dynamic interactions, theta oscillations enable the temporal organization of face processing across multiple levels of the network.
Functional MRI studies on face processing without awareness have shown that parts of the dorsal visual stream are activated along with subcortical regions such as the superior colliculus (SC) and amygdala, suggesting that face-related visual information is conveyed via both cortical and subcortical processing routes (Garvert et al., 2014; Johnson, 2005; Johnson et al., 2015; Troiani & Schultz, 2013). The SC, in particular, processes gestalt-like visual information and coordinates eye movements independently of the visual cortex (Chen et al., 2019; Georgy et al., 2016), potentially contributing to the generation of theta oscillations during unconscious processing. Our findings suggest that both visible (conscious) and invisible (unconscious) primes elicit theta oscillations during face perception, indicating that these oscillations arise from interactions between cortical and subcortical structures rather than being confined to cortical regions alone. Specifically, theta oscillations may emerge from the dynamic interaction of these pathways, facilitating coordination of neural activity across regions involved in face perception. This highlights theta oscillations’ role as a synchronizing mechanism that integrates sensory information and aligns neural activity across cortical and subcortical regions, enabling seamless face perception in both conscious and unconscious states.
While backward masking (BM) and continuous flash suppression (CFS) effectively minimize conscious perception, the possibility of residual conscious processing remains. This concern is particularly relevant when criterion bias is not fully controlled. Criterion bias occurs when participants report “no awareness,” not because they lack conscious perception but because the stimulus falls below a subjective reporting threshold (Knotts et al., 2018; Peters & Lau, 2015; Phillips, 2018; Phillips & Block, 2016). Although robust methods were employed to minimize conscious perception, residual awareness must be considered, particularly when interpreting unconscious processing effects. Future studies should address this issue by controlling for individual detection thresholds and adopting more sophisticated methods for assessing conscious perception.
Our findings may also intersect with research on covert attention, which rhythmically scans the environment at a frequency of 4–8 Hz (Fan et al., 2023; Fiebelkorn et al., 2013; Huang et al., 2015; Jiang et al., 2024; Landau & Fries, 2012; Song et al., 2014). Covert attentional shifts, often aligned with theta-band oscillations, allow the brain to alternate between sensory sampling and attention reorienting (Fiebelkorn & Kastner, 2019a, 2019b; Nobre & Ede, 2023; Senoussi et al., 2019). Despite rigorous eye-movement monitoring to ensure fixation on the central cross, covert attention may still have shifted (Posner, 1980; Posner et al., 1987). Additionally, the sampling range of SOA in this study limited the ability to evaluate oscillatory activity below 3 Hz. Although we observed significant oscillatory activity within the theta band (3–8 Hz), slower oscillations remain unexplored. Future research using longer SOAs or alternative methods could provide valuable insights into the contributions of lower-frequency oscillations in priming effects and object perception.
While randomizing the order of image presentation helped reduce stimulus predictability, fully controlling for learning effects in Experiment 2's sequential design remains challenging. For example, Experiment 2a may have introduced additional training effects beyond the formal training phase. This phase likely helped participants disambiguate Mooney images more efficiently by requiring 100% accuracy. Such training effects may have amplified differences observed between Experiments 2a and 2b by improving participants’ ability to resolve ambiguity in Experiment 2b. Therefore, part of the observed effects may reflect a combination of experimental manipulations and enhanced perceptual strategies developed during training. These findings align with theories emphasizing the role of top-down processing in resolving perceptual ambiguity.
In conclusion, our study highlights the critical role of theta-band oscillations in rhythmic face perception, providing novel insights into the temporal dynamics of face processing across different levels of conscious awareness. Both visible and invisible primes elicited theta-band behavioral oscillations, underscoring the brain's reliance on rhythmic activity to integrate sensory information. Our findings emphasize the importance of top-down predictions in resolving perceptual ambiguity and highlight the dynamic interplay between cortical and subcortical pathways in orchestrating face perception. This work contributes to a growing understanding of the rhythmic mechanisms underlying face processing under diverse visual conditions.
Supplemental Material
sj-docx-1-pac-10.1177_18344909251325271 - Supplemental material for Theta-band behavioral oscillations in face priming with and without conscious awareness
Supplemental material, sj-docx-1-pac-10.1177_18344909251325271 for Theta-band behavioral oscillations in face priming with and without conscious awareness by Mengjin Li, Bingbing Guo, Guiping Zheng, Ming Meng and Ke Zhou in Journal of Pacific Rim Psychology
Footnotes
Acknowledgments
This work was supported by the STI2030-Major Projects (2021ZD0203803), the National Human Genetic Resources Sharing Service Platform (2005DKA21300), the National Natural Science Foundation of China (32271108), the China Postdoctoral Science Foundation (2024M760230), and the Fundamental Research Funds for the Central Universities.
Author contributions
Conceptualization, K.Z., M.M., and M.L.; methodology, M.L.; investigation, M.L., B.G. and G.Z.; writing—original draft, M.L.; writing—review and editing, M.L., K.Z., and M.M.; funding acquisition, K.Z.; supervision, K.Z and M.M.
Data and code availability
Declaration of conflicting interests
The authors declared no potential conflicts of interest with respect to the research, authorship, and/or publication of this article.
Declaration of generative AI and AI-assisted technologies in the writing process
During the preparation of this manuscript, we used ChatGPT-3 for assistance in polishing the draft. Following the use of this tool, we thoroughly reviewed and edited the content as necessary. We take full responsibility for the final content of the publication.
Ethical approval and informed consent statements
The study was approved (approval #SCNU-PSY-2019-038) by the Human Research Ethics Committee for Non-Clinical Faculties at the School of Psychology, South China Normal University on April 14, 2019, ensuring adherence to ethical guidelines.
Funding
The authors disclosed receipt of the following financial support for the research, authorship, and/or publication of this article: This work was supported by the China Postdoctoral Science Foundation, National Key Research and Development Program of China, Science and Technology Institute (grant number 2024M760230, 2019YFA0709503, STI2030-Major Projects).
Supplemental material
Supplemental material for this article is available online.
References
Supplementary Material
Please find the following supplemental material available below.
For Open Access articles published under a Creative Commons License, all supplemental material carries the same license as the article it is associated with.
For non-Open Access articles published, all supplemental material carries a non-exclusive license, and permission requests for re-use of supplemental material or any part of supplemental material shall be sent directly to the copyright owner as specified in the copyright notice associated with the article.