
Abstract
Insomnia is a prevalent concern among adolescents, but accurately measuring its severity remains challenging. The Insomnia Severity Index (ISI) is widely used to assess insomnia symptoms, yet its psychometric properties have not been thoroughly evaluated in Chinese adolescents. This study addresses this gap by applying bifactor modeling and item-response theory (IRT) analysis to a large sample of 570,295 Chinese adolescents. Confirmatory factor analysis (CFA) identified a three-factor structure with correlated factors as the best-fitting model (CFI = 0.996, TLI = 0.991, RMSEA = 0.035, SRMR = 0.010). Further bifactor CFA revealed that a two-factor model (excluding item 4) provided a superior fit (CFI = 0.999, TLI = 0.997, RMSEA = 0.021, SRMR = 0.004), with the general insomnia severity factor explaining 69% of the common variance. The general factor captured variances related to nighttime sleep difficulties (e.g., trouble falling asleep or staying asleep) and daytime impairments (e.g., fatigue, irritability). IRT analysis demonstrated that the ISI exhibited high reliability and discrimination across moderate to high levels of insomnia severity, although reduced reliability was observed at the extreme ends of the scale. Gender differences showed that females had higher insomnia scores than males (Cohen's d = 0.12), while boarding students exhibited significantly higher insomnia severity compared to day students (Cohen's d = 0.30). These findings underscore the ISI's reliability and validity for measuring insomnia severity among Chinese adolescents, highlighting its utility as a valuable assessment tool for both research and clinical practice. The results provide important insights into adolescent sleep health and suggest potential applications for targeted interventions aimed at mitigating insomnia symptoms in this population.
Keywords
Introduction
Adolescence, typically defined as ages 10 to 19, is a period of rapid and profound changes in biology, personality, and social relationships, often accompanied by sleep problems like irregular patterns, insufficient duration, and insomnia (Carskadon et al., 2004; Chung et al., 2011). Insomnia, characterized by persistent difficulties in falling or staying asleep despite adequate sleep opportunity, is one of the most serious sleep problems in adolescents, particularly prevalent among older adolescents and girls (De Zambotti et al., 2018; Hysing et al., 2013; Johnson et al., 2006). In the US, 9.4% of adolescents aged 13–16 were diagnosed with insomnia based on DSM-IV criteria (Chung et al., 2011). In China, this rate surged to 23.2% during stressful periods like the COVID-19 pandemic (Zhou et al., 2020). Furthermore, insomnia prevalence is comparable to that of other major mental disorders, such as depression (Roberts et al., 2008), and it frequently cooccurs with other mental disorders (Johnson et al., 2006). In adolescents, insomnia poses specific risks, including compromised academic performance due to its negative effects on memory, attention, and executive functioning. It is also strongly associated with depression, stress, anxiety, and suicidal ideation (Roberts et al., 2002; Roberts & Duong, 2013; Yang et al., 2023). Given its prevalence and serious consequences, accurate assessment of insomnia is crucial for effective diagnosis and intervention.
To assess the severity, impact, and clinical relevance of insomnia, clinicians often rely on clinical interviews to gather key indicators, such as time taken to fall asleep, total sleep duration, and frequency and duration of sleep problems (Morin et al., 2011). While clinical interviews play an important role in diagnosing insomnia, the gold standard for diagnosing insomnia, especially when precise physiological data are required, remains polysomnography (PSG). PSG provides objective measures of sleep architecture and disturbances, which are critical for differentiating insomnia from other sleep disorders (Dikeos et al., 2023). However, due to the resource-intensive nature of PSG, self-report measures are often employed as effective supplementary tools, offering a more accessible means for assessing insomnia severity in both clinical and research settings (Marques, 2020; Moul et al., 2004). Buysse et al. (2006) suggest that the Pittsburgh Sleep Quality Index (PSQI) and the Insomnia Severity Index (ISI) are the preferred tools for assessing sleep and insomnia symptoms. Although the PSQI is reliable and valid, it does not focus specifically on insomnia, is lengthy (19 items), and can be cumbersome to score (Beck et al., 2004). Moreover, unlike the PSQI, which assesses general sleep disturbances, the ISI focuses specifically on insomnia severity and patients’ perceptions (Bastien et al., 2001). The ISI is widely used across diverse populations and is considered the preferred tool for insomnia assessment (Jun et al., 2022; Lin et al., 2018; Manzar et al., 2020). The ISI, compared to the PSQI, shows stronger associations with daytime sleepiness, anxiety, and depression, making it more suitable for assessing insomnia in Chinese adolescents (Luo et al., 2017).
The ISI has been adapted and validated in a variety of cultural contexts, consistently demonstrating its reliability and validity across diverse populations. In an Iranian adolescent sample, the ISI exhibited strong psychometric properties, with Cronbach's alpha values of 0.77 for boys and 0.85 for girls, indicating its effectiveness in this group (Chehri et al., 2021). Similarly, in Germany, the ISI was evaluated across different age groups, including adolescents, where it showed high internal consistency and strong validity (Gerber et al., 2016). In Korea, it exhibited excellent internal consistency (Cronbach's alpha = 0.91) and convergent validity among patients with sleep disorders (Cho et al., 2014). In Arabic-speaking populations, the ISI showed a strong correlation with other sleep measures, confirming its reliability (Suleiman & Yates, 2011). In Italy, the ISI has been validated for use in clinical settings, particularly in cognitive behavioral therapy for insomnia (CBT-I), demonstrating its clinical applicability (Castronovo et al., 2016). In China, the ISI demonstrated strong reliability and validity among adolescents, with a Cronbach's alpha of 0.83 and significant correlations with other sleep measures, confirming its utility as a screening tool in this population (Chung et al., 2011). Additionally, the Chinese translation of ISI (C-ISI) has demonstrated acceptable reliability and good sensitivity for assessing insomnia patients and can be effectively used to measure sleep quality in Chinese speakers (Badiee Aval Baghyahi et al., 2013).
While previous validations of the ISI using Classical Test Theory (CTT) have been informative, this approach has certain limitations. CTT assumes that a test score is a combination of a true score and random error, relying on total scores and treating all items as equally important. However, this method offers limited insight into individual item performance and may not generalize well across different samples (Fan, 1998). These limitations make it difficult to understand how specific items function in various populations, potentially leading to inaccurate interpretations (DeVellis, 2006). In contrast, Item-Response Theory (IRT) addresses these issues by analyzing the relationship between a person's latent trait (e.g., insomnia severity) and the likelihood of endorsing specific items. IRT evaluates item characteristics like difficulty and discrimination, providing a clearer understanding of item performance across populations (Reza & Sara, 2009). Unlike CTT, IRT ensures item properties remain consistent across groups, making it well-suited for cross-cultural comparisons (Adedoyin et al., 2008; Sharkness & DeAngelo, 2011). For instance, two individuals might have the same total score under CTT, but IRT could reveal differences in how they respond to items with varying parameters (e.g., psychological thresholds, similar to difficulty in ability tests). While CTT treats these scores as equivalent, IRT captures individual response patterns more precisely.
The factor structure of the ISI, often characterized by multidimensionality, poses a challenge in psychometric evaluation (Manzar et al., 2021). Although the original three-factor model proposed by Bastien et al. (2001) was validated in specific populations, later studies have revealed inconsistencies. For instance, Savard et al. (2005) and Yu (2010) supports a simpler two-factor structure, while Chung et al. (2011) suggested a similar model but included item 4 in the impact factor rather than the severity factor. Velasquez (2023) further validated a revised six-item, two-factor model that excludes item 4. Given these complexities, bifactor analysis offers a more robust solution by isolating a general insomnia severity factor while accounting for distinct subdomains (García et al., 2023). To address these challenges, our study introduces bifactor IRT analysis, which effectively captures multidimensional structures. Bifactor models are designed to identify a general factor representing overall insomnia severity alongside specific factors reflecting distinct dimensions (Chen et al., 2006; Gibbons et al., 2007). This approach enhances psychometric analysis by independently evaluating domain-specific factors while maintaining the integrity of the general construct (Chen et al., 2006).
This study aims to evaluate the psychometric properties of the ISI in adolescents using bifactor IRT analysis, focusing on two key hypotheses: (H1) the bifactor model will distinguish a general insomnia severity factor from specific subdomains of the ISI in Chinese adolescents. (H2) IRT analysis of the ISI will provide more precise and reliable item-level insights into insomnia severity compared to CTT in Chinese adolescents.
Methods
Participants
This study utilized data from the Research Project on the Prevention and Treatment of Common Mental Health Issues among Adolescents (Project No. CFTC-BJ01-2303063), conducted between February 17 and August 15, 2023. The survey was administered through the Lvluo Mental Health Platform (https://www.lvluoxinli.com), the largest youth mental health assessment service provider in China. The target population included Chinese adolescents aged 10 to 18 years from 13 provinces and 34 cities. A stratified random sampling approach was employed based on geographical location, school type, and age groups. Of the approximately 600,000 adolescents surveyed, 572,095 responses (95.3% valid response rate) were retained after screening. Inclusion criteria required completed and consistent responses. Informed consent was obtained based on participants’ age. For those under 14, consent was provided by their guardians, along with verbal assent from the participants. For those aged 14 and above, written consent was obtained from both the participants and their guardians, where applicable. Exclusion criteria included incomplete questionnaires, abnormal response times, inconsistent answers (e.g., conflicting responses to related questions), and duplicate submissions. The mean age of participants was 13.91 years (SD = 2.37), with detailed demographic information presented in Table 1.
Demographic characteristics of the sample (n = 572,095).

This study was not preregistered. It received thorough review and approval from the Research Ethics Committee of Central China Normal University (Approval Number: CCNU-IRB-202201020). The data used in this study are publicly available at https://figshare.com/s/59a2c9e849bc019da6e4.
Measures
The present study utilized a comprehensive questionnaire that included the Basic Information Questionnaire, the Insomnia Severity Index (ISI), the Patient Health Questionnaire-9 (PHQ-9), and the Adolescent Self-rating Life Events Checklist (ASLEC). These scales have been extensively used in China, and their Chinese versions have been validated for the Chinese adolescents (Chung et al., 2011; Leung et al., 2020; Xin & Yao, 2015).
Insomnia severity index
The Insomnia Severity Index (ISI) is a seven-item self-report measure assessing insomnia symptoms (Morin et al., 2011), including: (1) difficulty with sleep onset, (2) sleep maintenance, (3) early morning awakening, (4) satisfaction with current sleep pattern, (5) interference with daily functioning, (6) noticeability of impairment due to sleep problems, and (7) distress caused by sleep problems. These items are categorized into three factors: severity, impact, and satisfaction, reflecting the diagnostic criteria for insomnia. Responses are rated on a five-point Likert scale from 0 (none/very satisfied/not at all noticeable/not at all worried/not at all interfering) to 4 (very severe/very dissatisfied/very noticeable/very worried/very interfering), with total scores ranging from 0 to 28. Higher scores indicate more severe insomnia. In this study, the Cronbach's alpha was 0.85, reflecting high internal consistency, with values above 0.70 generally considered acceptable for psychological measures (Peterson, 1994).
Patient health questionnaire
The Patient Health Questionnaire (PHQ-9) is a nine-item instrument designed to evaluate an individual's level of depression. It employs a four-point Likert scale ranging from 0 (not at all) to 3 (nearly every day), with the PHQ-9 total score varying from 0 to 27. A higher score corresponds to a greater level of depression. Notably, a PHQ-9 total score exceeding 9 suggests the presence of depression (Kroenke et al., 2001). In this study, the Cronbach's alpha was 0.86, indicating high internal consistency.
Adolescent self-rating life events checklist
The Adolescent Self-rating Life Events Checklist (ASLEC) was employed to evaluate the frequency and intensity of daily stress experienced by adolescents (Xin & Yao, 2015). In this study, the ASLEC consisted of 24 items, each rated on a 5-point Likert scale with scores ranging from 1 (not at all) to 5 (very much). This measure encompasses stressors related to individual, interpersonal, family, and school events. The total score for the ASLEC ranges from 0 to 120, with higher scores indicating greater perceived stress. In this study, the Cronbach's alpha was 0.89, indicating high internal consistency.
Statistical analyses
Descriptive statistics for the sample, including means, standard deviation, and minimum and maximum scores, were calculated using the R package psych (Revelle, 2017). Based on the observed skewness and kurtosis values within the range of −2 to 2, it can be assumed that the dataset approximately follows a normal distribution (Hahs-Vaughn & Lomax, 2020). Additionally, the concurrent validity of the ISI, which refers to its correlation with other scales at the same time point, was established using Pearson's coefficients to compare scores from the ISI, PHQ-9, and ASLEC.
Initial analyses were conducted to identify significant differences in ISI scores between males and females, as well as between boarding and day students, using independent samples t-tests. Additionally, differences based on the learning stage (primary school, middle school, and high school) were examined using one-way ANOVA, with effect sizes measured by Eta-squared (
Following these initial comparisons, five hypothetical models from previous studies were tested to determine the best fit (see Supplemental Figure S1). Model 1 (M1: One-factor) was a one-factor solution (Kaufmann et al., 2019); Model 2 (M2: Two-factor [item 4 on F2]) was a two-factor solution with the first three items and the last four items representing two factors (Chung et al., 2011); Model 3 (M3: Two-factor [item 4 on F1]) was another two-factor solution, with the first four items as one factor and the last three as another (Savard et al., 2005; Yu, 2010); Model 4 (M4: Two-factor [item 4 dropped]) was a two-factor solution with item 4 dropped (Velasquez, 2023); and Model 5 (M5: Three-factor) was a three-factor solution (Bastien et al., 2001), with the first three items forming the first factor, items 1, 4, and 7 forming the second, and the last three items forming the third factor. Confirmatory Factor Analysis (CFA) was conducted using the R package lavaan (Rosseel, 2012), with a weighted least square mean and variance adjusted (WLSMV) estimator. Model fit was assessed using standard indices: Comparative Fit Index (CFI) and Tucker–Lewis Index (TLI), with values closer to 1.0 indicating better fit and a minimum threshold of 0.90. Additionally, Root–Mean–Square Error of Approximation (RMSEA) values below 0.08 and Standardized Root Mean Square Residual (SRMR) values under 0.05 were considered indicative of good fit (Browne & Cudeck, 1992).
The second set of analyses involved conducting bifactor CFA modeling on the previously mentioned structures. We tested four bifactor models: Bifactor M2, Bifactor M3, Bifactor M4, and a Bifactor M5. These bifactor models were compared with traditional CFA models to identify the best representation of our data. All analyses were performed using the R package lavaan (Rosseel, 2012), with RMSEA, SRMR, CFI, and TLI used to assess model fit. To test measurement invariance across gender (female vs. male), we followed the hypothesis-testing strategy suggested by Velasquez (2023). This involved three main steps: (1) Configural invariance, which assessed whether the insomnia construct was consistent across groups by comparing model fit and factor loadings. (2) Metric invariance, which tested whether factor loadings were equivalent across groups by comparing the metric model to the configural model using the chi-squared difference test. (3) Scalar invariance, which tested the invariance of thresholds across groups by comparing the scalar model to the metric model, also using the chi-square difference test.
To evaluate the importance of the general factor in accounting for item variance, the coefficients omega (
Subsequently, a bifactor item-response theory (IRT) analysis was conducted based on the selected structure to assess the item parameters and psychometric properties of the ISI. The graded response model (GRM; Samejima, 1997) was applied, with item parameters estimated using the expectation-maximization algorithm. All bifactor IRT analyses were performed using the R package mirt (Chalmers, 2012). At the item level, IRT models typically assume that item parameters remain invariant across all respondents. However, Differential Item Functioning (DIF) can compromise this assumption, affecting the comparability of latent trait scores across different groups. To address potential DIF related to gender, the R package lordif (Choi et al., 2011) was utilized in this study, ensuring that item-level differences do not bias the overall test scores (e.g., Liu et al., 2020, 2023).
Results
Descriptive statistics
The ISI's total mean score was 6.48 (SD = 5.31), with a range from 0 to 28. The skewness was 1.02, and the kurtosis was 0.86. Furthermore, most items exhibited absolute skewness values around −2 and kurtosis values less than 2 (see Supplemental Table S1), suggesting that the data did not significantly deviate from the assumptions of a normal distribution. Regarding the evaluation of convergent validity, substantial correlations were observed between the scores of the ISI, the PHQ-9, and ASLEC. Specifically, the ISI demonstrated significant correlations with the PHQ-9 (r = 0.72, p < 0.001) and ASLEC (r = 0.53, p < 0.001) scores (see Supplemental Table S2), thereby supporting the concurrent validity of these measures.
Group comparisons
Independent samples t-tests revealed that females (M = 6.80, SD = 5.42) had significantly higher ISI scores than males (M = 6.15, SD = 5.19), t(572,093) = 45.89, p < 0.001, with a small effect size (Cohen's d = 0.12), indicating limited practical significance. Boarding students (M = 7.45, SD = 5.45) also reported higher ISI scores than day students (M = 5.89, SD = 5.14), t(572,093) = 108.30, p < 0.001, with a moderate effect size (Cohen's d = 0.30), suggesting a more meaningful impact of boarding status.
A one-way ANOVA showed a significant effect of the stage of study (primary school, middle school, and high school) on ISI scores, F(2, 572092) = 15,437.925, p < 0.001. Post-hoc comparisons indicated that high school students (M = 7.72, SD = 5.38) had higher ISI scores than middle school (M = 6.91, SD = 5.41) and primary school students (M = 4.78, SD = 4.67). The effect size was small (
Confirmatory factor analysis
Among the five hypothetical models tested, the three-factor model (M5) demonstrated the best fit within the traditional confirmatory factor analysis (CFA) framework, with a CFI of 0.996, TLI of 0.991, RMSEA of 0.035, and SRMR of 0.010 (see Table 2). In contrast, the one-factor model (M1) exhibited poor fit, failing to meet several key thresholds (CFI = 0.906, RMSEA = 0.138). The two-factor models (M2, M3, M4) showed varying degrees of improvement, with M3 (CFI = 0.991, RMSEA = 0.042) performing better than M1 but not as well as M5. These results suggest that while simpler models like M1 do not adequately capture the data's complexity, the three-factor model (M5) provides the most robust fit within the traditional CFA framework, making it the most appropriate model for representing the ISI structure. However, it is important to note that model comparison within the traditional CFA is only one approach to evaluating the underlying structure.
ISI model fit indices for validation confirmatory factor analysis (n = 572,095).

Note: F1: factor one (Nighttime sleep problem); F2: factor two (Daytime impairment); CFI: comparative fit index; TLI: Tucker–Lewis Index; RMSEA: root–mean–square error of approximation; SRMR: standardized root–mean–square residual; df: degrees of freedom; 90% CI: 90% Confidence Interval.
Bifactor confirmatory factor analysis
In addition to the traditional CFA, a bifactor CFA was conducted to assess the dimensionality of the ISI. The bifactor approach allows for the examination of both general and specific factors. Among the tested bifactor models, as shown in Figure 1, the two-factor model with item 4 removed (Bifactor M4) provided the best fit (CFI = 0.999, TLI = 0.997, RMSEA = 0.021, SRMR = 0.004), outperforming both Bifactor M2 and M3 (see Table 3). While the traditional CFA model (M5) previously emerged as the best fit, the bifactor model provides an alternative perspective, especially when aiming to account for both a general factor and specific factors. These results suggest that while M5 remains the best-fitting model in the traditional CFA, the bifactor M4 model offers a more nuanced representation of the ISI's underlying structure, making it a better fit when considering multidimensional constructs (see Supplemental Table S3).
ISI model fit indices for validation bifactor confirmatory factor analysis (n = 572,095).

Note: F1: factor one (Nighttime sleep problem); F2: factor two (Daytime impairment); CFI: comparative fit index; TLI: Tucker–Lewis Index; RMSEA: root–mean–square error of approximation; SRMR: standardized root–mean–square residual; df: degrees of freedom; 90% CI: 90% Confidence Interval.
Multiple group analyses were performed to evaluate the invariance of the bifactor model (Bifactor M4) across males and females. As shown in Table 4, the configural model showed a good fit (CFI = 0.999, TLI = 0.997, RMSEA = 0.022, SRMR = 0.003). Although the chi-square difference tests for metric (Δχ²(9) = 503.22, p < .001) and scalar invariance (Δχ²(3) = 377.57, p < .001) were significant, both models still demonstrated excellent fit indices (CFI = 0.999, TLI = 0.998, RMSEA = 0.018–0.019, SRMR = 0.009). Given the large sample size (N > 500,000), these significant results should be interpreted with caution, as even minor deviations can lead to statistically significant findings that may not be practically meaningful (Yuan & Chan, 2016).
ISI model fit indices for multigroup confirmatory factor analysis by gender (n = 572,095).

Note: CFI: comparative fit index; TLI: Tucker–Lewis Index; RMSEA: root–mean–square error of approximation; SRMR: standardized root–mean–square residual; df: degrees of freedom; 90% CI: 95% Confidence Interval.
Further analysis revealed that the general factor (Insomnia severity) had an
IRT analysis
Item analysis
Table 5 presents the results of the ISI item analysis. Five items (Items 1, 2, 5, 6, and 7) demonstrated high discrimination (≥1.50) on the general factor, indicating a strong association with the general factor for 83% of the items. Regarding the specific factors of the ISI, three items (Items 2, 5, and 6) also exhibited high discrimination, indicating that half of the items are strongly correlated with these specific factors. Overall, most items were more strongly associated with the general insomnia severity factor than with the specific factors. Furthermore, the item characteristic curves (ICCs) support these findings by showing that certain items (e.g., Items 5, 6, and 7) are particularly effective at distinguishing higher levels of insomnia severity, while others (e.g., Items 1, 2, and 3) perform well across a broader severity range (see Supplemental Figure S2). In terms of threshold parameters, there were noticeable fluctuations across different thresholds. For example, the ascending sequence of the first threshold was Items 1, 5, 2, 6, 3, and 7, while for the last threshold, the sequence shifted to Items 1, 5, 2, 7, 3, and 6. The range of the threshold parameter, from −0.61 to 2.51, suggests that the scale is best suited for measuring individuals with moderately high levels of insomnia.
Discrimination parameters and threshold parameters of the ISI via bifactor item-response theory analysis (n = 572,095).
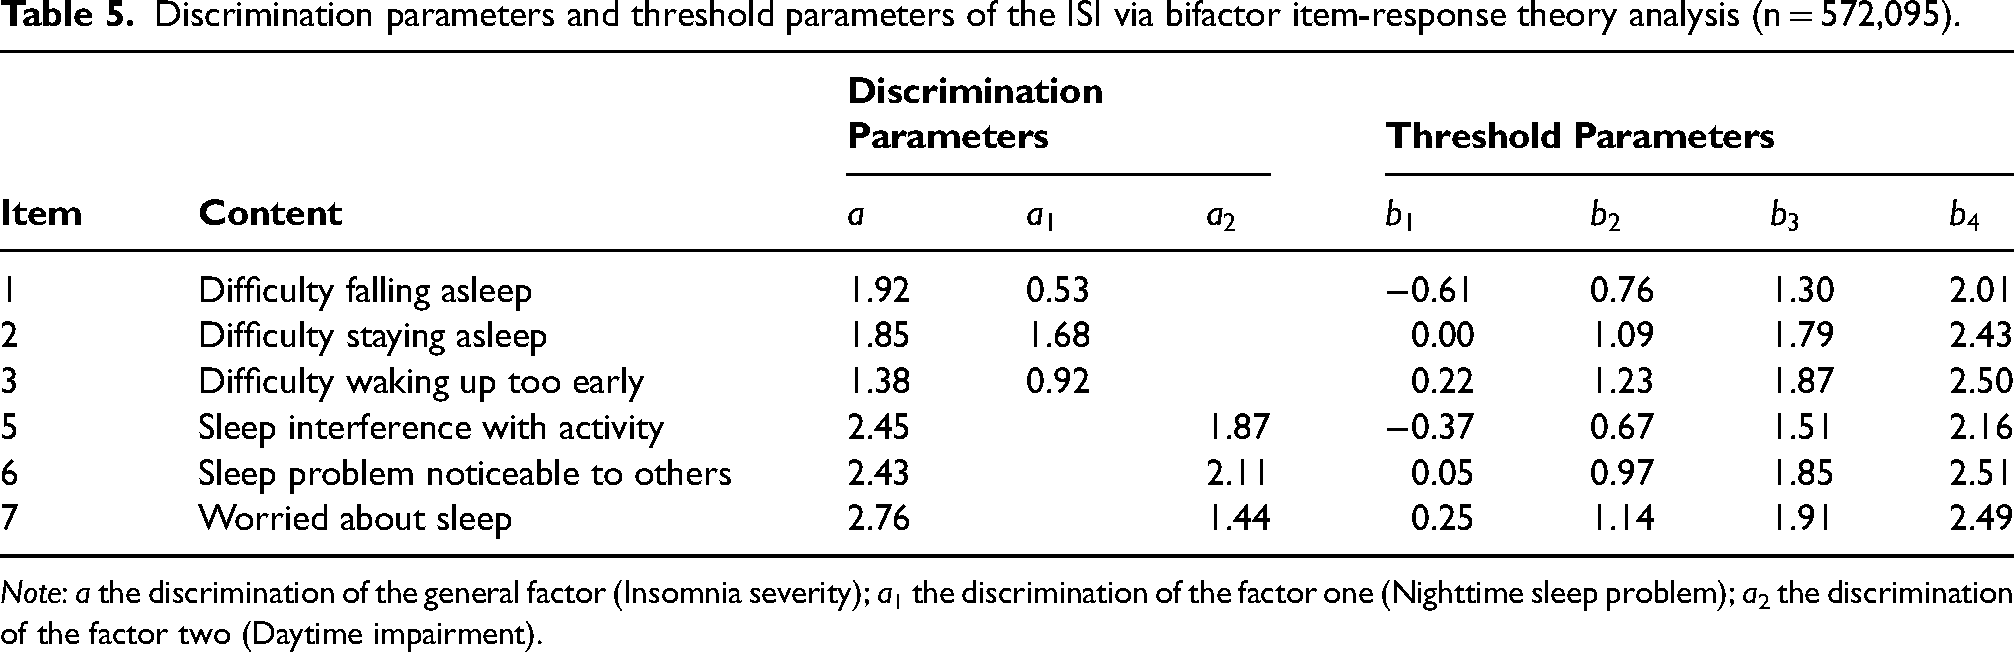
Note: a the discrimination of the general factor (Insomnia severity); a1 the discrimination of the factor one (Nighttime sleep problem); a2 the discrimination of the factor two (Daytime impairment).
Reliability, information, and standard error of measurement
In IRT, the precision of each item is visually represented by an Item Information Function (IIF, see Supplemental Figure S3), which showed how much information each item provided at different levels of latent trait (theta). The IIFs are summed to obtain the Test Information Function (TIF), which reflects the overall information provided by the entire scale. The TIF and the Test Characteristic Curve (TCC) are key tools used to assess the performance and reliability of the ISI (see Figure 2). The TCC shows that the ISI total score increases steeply with rising insomnia severity, particularly between scores of 5 to 20, indicating that the ISI effectively discriminates among individuals with varying levels of insomnia severity. The TIF demonstrates that the ISI provides substantial information between −0.5SD to +2.5SD on the standardized theta scale, peaking between 0SD and +2SD. This suggests that the ISI is highly reliable for measuring individuals with average to high levels of insomnia severity, but less reliable for those at the extremes of very low or very high severity.

Path representation of the proposed bifactor two-factor model of ISI with item 4 dropped. Note: F1: factor one (Nighttime sleep problem); F2: factor two (Daytime impairment); and G: General factor (Insomnia severity).
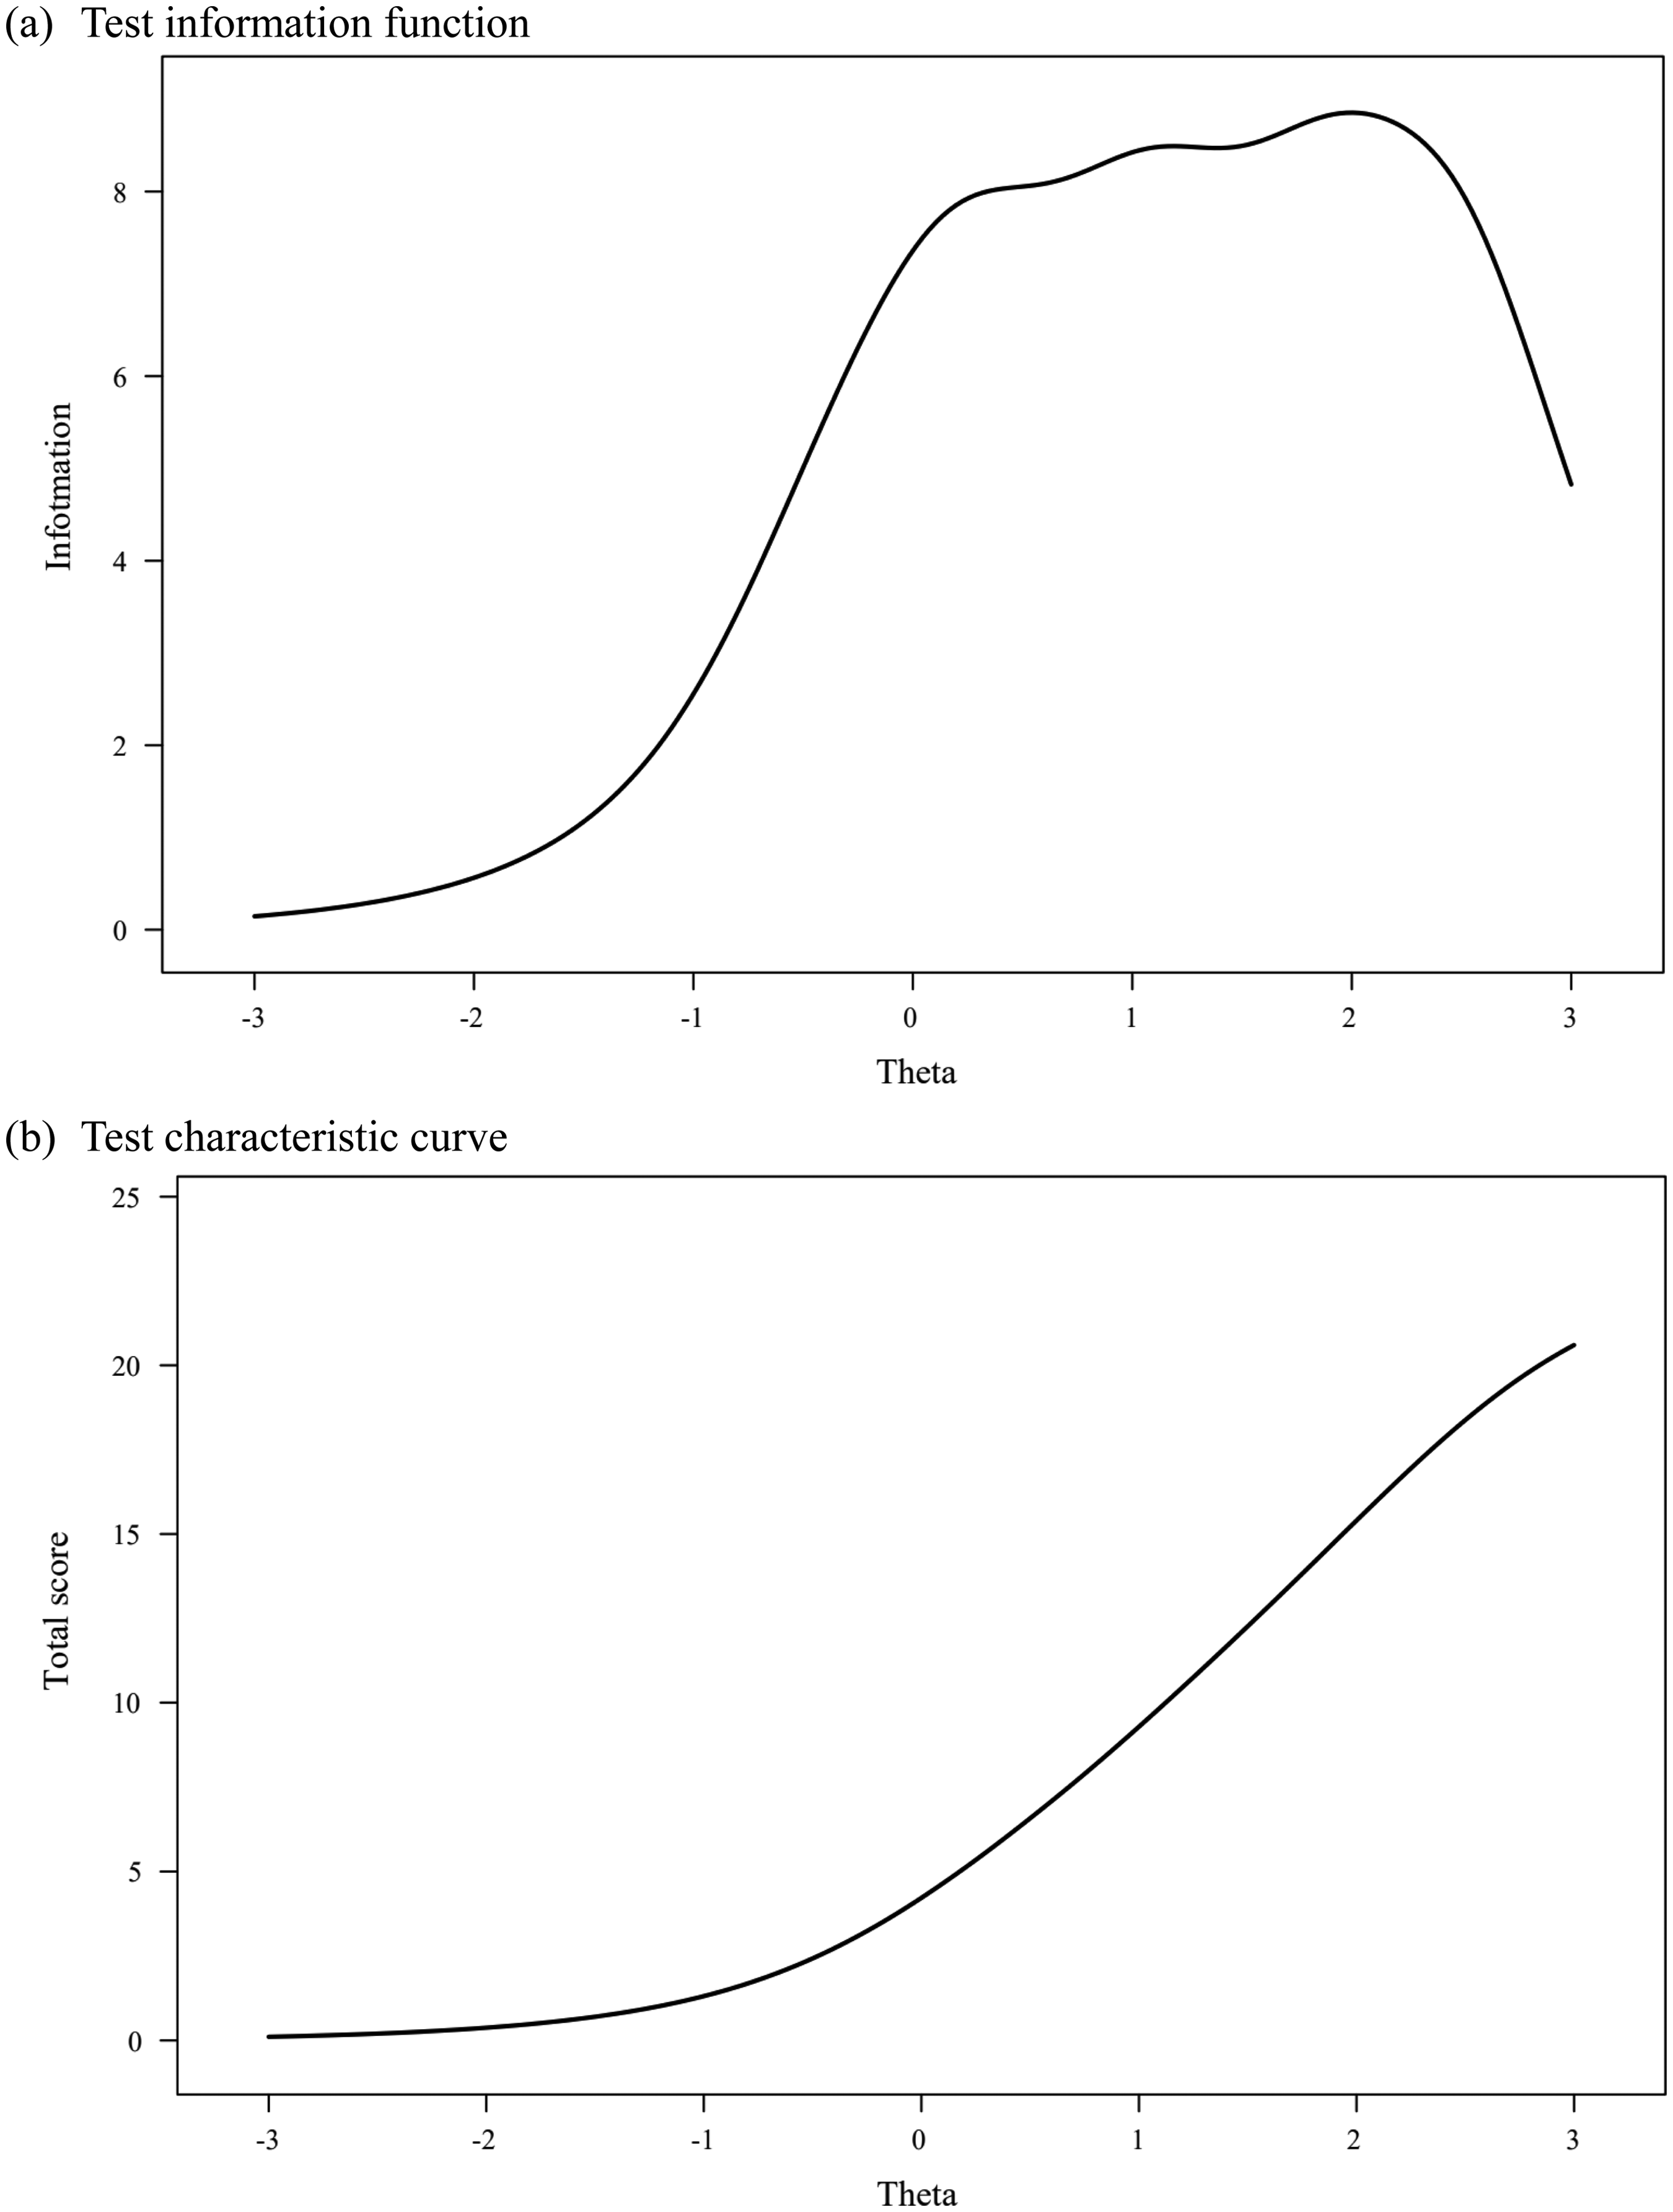
(a) Test information function (TIF) and (b) test characteristic curve (TCC) of the ISI.

The reliability (solid line) and standard error of measurement (dashed line) of the ISI.
Moreover, the reliability, information, and standard error of measurement (SEM) for each level of theta can also be assessed. Higher information denotes greater reliability and accuracy in measurement. A good measure typically has a reliability coefficient of 0.85 or higher, with an SEM of 0.39 or lower. According to the bifactor IRT model analysis, as shown in Figure 3, the ISI's reliability exceeds 0.85, and its SEM is below 0.39 within the range of 0SD to +2.5SD on the standardized theta scale. Additionally, no significant Differential Item Functioning (DIF) was found between genders.
Discussion
The present study applied bifactor modeling and IRT methods to evaluate the psychometric properties of the Insomnia Severity Index (ISI) within a substantial sample (N = 570,295) of Chinese adolescents. The results support the validity and reliability of the ISI as a multidimensional measure of insomnia severity in this population, featuring a dominant general factor (insomnia severity) and two independent specific factors (nighttime sleep problems and daytime impairment). The ISI demonstrated good item discrimination and test information for measuring individuals with average to high levels of insomnia severity but showed lower reliability for individuals with very low or very high levels of insomnia severity. These findings have significant implications for the assessment and screening of insomnia in adolescents and contribute to our understanding of the construct of insomnia severity.
The results from both the traditional and bifactor confirmatory factor analyses (CFA) offer important insights into the structure of the ISI. The three-factor model (M5) demonstrated strong statistical support with excellent fit indices (CFI = 0.996, RMSEA = 0.035, SRMR = 0.010), confirming that it provides an adequate representation of the ISI's structure. This model is straightforward and appropriate for many practical applications where parsimony is valued. However, the bifactor model (Bifactor M4, CFI = 0.999, RMSEA = 0.021, SRMR = 0.004) provides a more detailed picture of the ISI's structure, particularly useful for understanding insomnia's multidimensional nature. The bifactor model highlights both a general insomnia severity factor and two specific factors—nighttime sleep difficulties and daytime impairment. Nighttime sleep problems reflect issues with sleep onset, maintenance, and quality, and addressing these issues can lead to improvements in mental health and daytime functioning. Daytime impairment involves the consequences of poor sleep, such as impaired concentration, irritability, and fatigue, which are crucial for understanding insomnia's broader impact. The general factor accounts for 69.3% of the total variance, underscoring its dominance in explaining overall insomnia severity. In contrast, the specific factors contribute less (41.0% for nighttime sleep problems and 23.6% for daytime impairment), suggesting that while these dimensions are relevant, they play a more limited role in the total ISI score. It is important to note that while the three-factor model effectively captures overall insomnia severity, the bifactor model provides a more nuanced understanding, especially in contexts where both general and specific components of insomnia are being examined. Consequently, the bifactor model may be more appropriate in research settings that require a detailed analysis of insomnia's underlying dimensions, whereas the three-factor model remains sufficient for general clinical use.
The bifactor IRT analysis of the ISI indicated its robust capability in discerning varying levels of insomnia severity, particularly among individuals with average to high symptoms. The high slopes on the general factor for the items signify their sensitivity in detecting changes in insomnia severity, making the ISI a potent tool in clinical assessments. The test information function's effectiveness in the range of −0.5SD to +2.5SD on the standardized theta scale (equating to 7 to 22 on the raw score scale) highlights the ISI's precision in distinguishing between different severity levels within this spectrum.
However, the reduced reliability of the ISI at very low or high levels of insomnia severity suggests that clinicians may need to consider supplemental tools or clinical interviews for individuals with extremely mild or severe insomnia symptoms to ensure comprehensive evaluation. For patients with mild insomnia symptoms, tools like the Pittsburgh Sleep Quality Index (PSQI) or the Sleep Condition Indicator (SCI) may provide a broader perspective on sleep quality and help capture subtler variations in sleep disturbances (e.g., Lin et al., 2020; Seow et al., 2018). For individuals with severe insomnia or co-occurring sleep disorders, more in-depth assessments, such as polysomnography (PSG), the Epworth Sleepiness Scale (ESS) for evaluating daytime sleepiness, or structured clinical interviews following DSM-5 criteria, can offer additional diagnostic value (Omachi, 2011).
For researchers, the ISI is most suitable for populations where moderate to high levels of insomnia severity are expected. In broader population studies or screenings, combining the ISI with other instruments that effectively capture the lower end of the insomnia severity spectrum could enhance overall assessment accuracy.
The robust convergent validity of the ISI is evidenced by its significant correlations with depression and stress, well-documented correlates of insomnia. This aligns with prior research showing similar correlations in diverse populations (Chung et al., 2011; Lin et al., 2018; Manzar et al., 2020; Yu, 2010). The reciprocal relationship between sleep disturbances and psychological conditions like depression and stress justifies the use of the PHQ-9 and the ASLEC alongside the ISI for concurrent validity assessment. These measures provide a solid foundation for the ISI's use as a complementary tool in screening for depression and stress among adolescents.
The study's exploration of gender and boarding status as variables affecting ISI scores adds significant depth to our understanding of insomnia in adolescents. The finding that females and boarding students have higher ISI scores than males and day students aligns with previous research indicating more sleep complaints and psychological issues among boarding students (Kalak et al., 2019; Yang, 2024). These results suggest that the living environment and gender-specific factors contribute to variations in insomnia severity. This insight is crucial for tailoring interventions and support systems, considering that boarding students might face unique stressors, such as homesickness or academic pressures, different from those living at home. Furthermore, the study reveals that high school students experience greater insomnia severity compared to their younger counterparts. This pattern reflects the escalating academic demands and pressures as students advance in their education. The transition from middle to high school, characterized by heightened academic expectations and future planning, likely exacerbates sleep-related issues. Addressing these challenges through school-based interventions, such as stress management programs and sleep education, could be crucial in mitigating insomnia among adolescents.
Several limitations must be acknowledged in this study. First, focusing solely on Chinese adolescents limits the generalizability of the findings to other cultural backgrounds and age groups. The ISI's reliability and validity should be tested in more diverse populations to ensure broader applicability, given that cultural and age-related differences can affect how insomnia symptoms are perceived and reported. Second, the absence of established sleep-related benchmark scales in the survey database limits the validation of the ISI against gold-standard measures. Future studies should incorporate such benchmarks to strengthen the ISI's credibility as a reliable measure of insomnia severity. Third, while the bifactor model and IRT methods offered valuable insights into the ISI's structure and reliability, there is a risk of overfitting when relying heavily on fit indices. Overfitting may result in an overly optimistic evaluation of model performance, especially if the indices are not interpreted cautiously. Future studies should not only validate the bifactor model across different populations but also consider alternative methods for model evaluation to confirm its robustness.
An additional limitation of this study is the potential for respondent bias inherent in self-report surveys, including social desirability bias and recall bias. These biases may affect the accuracy of the responses, as participants may underreport or overreport their symptoms based on social or memory-related factors. Future studies should incorporate methods to mitigate these biases, such as including objective sleep measures or triangulating data from multiple sources to improve the reliability of the results.
Finally, this study focused on gender, boarding status, and educational stage. Future research should consider a wider range of demographic and psychosocial factors to better understand influences on insomnia severity in adolescents. Moreover, estimating the Minimum Clinically Important Difference (MCID) of the ISI would be essential for enhancing its clinical utility by identifying meaningful changes in insomnia severity (e.g., Ye et al., 2020).
Conclusion
In conclusion, this study's in-depth exploration of the ISI within a large sample of Chinese adolescents, despite its limitations, brings forth considerable insights. The application of bifactor modeling and IRT methods elucidates the ISI's dimensional structure and reliability, with implications for both clinical assessment and research. The study highlights the ISI's utility in measuring insomnia severity, especially in moderate- to high-severity populations, and underscores the importance of considering gender and living environment in understanding and addressing adolescent insomnia. Future research should extend these findings to diverse cultural contexts and incorporate additional benchmark scales to enhance the ISI's validation and applicability.
Supplemental Material
sj-docx-1-pac-10.1177_18344909241310783 - Supplemental material for Psychometric evaluation of the insomnia severity index in 570,295 Chinese adolescents: A bifactor item-response theory analysis
Supplemental material, sj-docx-1-pac-10.1177_18344909241310783 for Psychometric evaluation of the insomnia severity index in 570,295 Chinese adolescents: A bifactor item-response theory analysis by Weijun Wang, Xiaosong Shen, Xiaorong Guo, Siyang Liu, Qian Chen, Shihao Ma and Yongjian Jian in Journal of Pacific Rim Psychology
Footnotes
Acknowledgements
We sincerely thank the editor and two anonymous reviewers for their valuable feedback and constructive suggestions, which significantly improved this manuscript.
Author contributions
Weijun Wang contributed to the research design, data collection, and interpretation of results. Xiaosong Shen contributed to the data analysis, hypothesis testing, and manuscript drafting. Xiaorong Guo contributed to the development of the research framework, and revising the manuscript critically. Siyang Liu contributed to supervising the project, overall coordination of the study, manuscript writing, and revision. Qian Chen contributed to data preprocessing and statistical analysis. Shihao Ma and Yongjian Jian contributed to literature review and initial manuscript drafting. Weijun Wang and Xiaosong Shen have made equal contributions to this paper.
Data availability statement
Declaration of conflicting interests
The authors declared no potential conflicts of interest with respect to the research, authorship, and/or publication of this article.
Ethical approval
All procedures performed in studies involving human participants were in accordance with the ethical standards of the institutional and/or national research committee. Prior to the research, ethical approval was obtained from the Research Ethics Committee of Central China Normal University (Ethics approval number: CCNU-IRB-202201020).
Funding
The authors disclosed receipt of the following financial support for the research, authorship, and/or publication of this article: This work was supported by the National Center for Mental Health, China (XS24B047, CFTC-BJ01-2303063), the Fundamental Research Funds for the Central Universities (CCNU24JCPT035), and the Collaborative Innovation Center of Assessment for Basic Education Quality (BJZK-2023A3-20021, BJZK-2024A2-20022).
Supplemental material
Supplemental material for this article is available online.
References
Supplementary Material
Please find the following supplemental material available below.
For Open Access articles published under a Creative Commons License, all supplemental material carries the same license as the article it is associated with.
For non-Open Access articles published, all supplemental material carries a non-exclusive license, and permission requests for re-use of supplemental material or any part of supplemental material shall be sent directly to the copyright owner as specified in the copyright notice associated with the article.