
Abstract
In order to validate the 12-item Psychological Capital Questionnaire (PCQ-12) and investigate the latent profiles of psychological capital (PsyCap) in Chinese employees, we conducted two studies. In Study 1, we systematically evaluated the psychometric properties of the PCQ-12 among a sample of 755 Chinese employees. The results showed that the PCQ-12 is a reliable and valid tool for measuring Chinese employees’ PsyCap and that it is superior to the 24-item Psychological Capital Questionnaire (PCQ-24). In Study 2, the validated PCQ-12 in Study 1 was used to measure the PsyCap of 1,349 Chinese employees from various organizations and industries, and a person-centered analytic approach was adopted to investigate the latent profiles of PsyCap. The results revealed four distinct profiles with the four components (i.e., efficacy, hope, optimism, and resilience) of PsyCap at similar levels, that is, low, low/moderate, high/moderate, and high. These profiles significantly differ in work outcomes, with the employees in the High PsyCap profile exhibiting the highest levels of work engagement and job satisfaction and the lowest levels of turnover intention, while employees in the Low PsyCap profile exhibit the opposite. Our research demonstrated that the PCQ-12 is a valid and convenient instrument to measure Chinese employees’ PsyCap and offers a fine-grained portrait of their PsyCap in Chinese culture. Moreover, the quantitatively distinct PsyCap profiles found in our research support the unitary structure of PsyCap with its four components converging into an underlying positive capacity and emphasize the synergistic effects of the four components on work outcomes, which informs the current debate over PsyCap and enriches the existing PsyCap literature, thus further shedding light on managerial practice.
Introduction
Psychological Capital (PsyCap), as an “individual's positive psychological state of development,” is composed of four components: self-efficacy, hope, optimism, and resilience (Luthans et al., 2007b, p. 3). Since the concept of positive psychological capital was proposed by Luthans and Youssef (2004) within the framework of positive organizational behavior (POB), it has received widespread attention from both scholars and practitioners. Indeed, numerous empirical studies show that PsyCap can stimulate employees’ inner competitive advantage, promote their positive work attitudes and behaviors, and inhibit their negative ones. For instance, PsyCap has been found to be positively related to employees’ performance, job satisfaction, organizational commitment, work engagement, psychological well-being, organizational citizenship behaviors (OCB), and voice behaviors but negatively associated with job burnout, turnover intention, and workplace deviance (e.g., Avey et al., 2011; Song et al., 2021).
In addition, the positive PsyCap theory holds that PsyCap can help individuals cope with the environmental changes and challenges brought about by these changes (Boniwell & Zimbardo, 2015). Since the outbreak of COVID-19, organizations and individuals have been facing an unprecedentedly severe and challenging environment. Thus, surviving and maintaining core competitiveness in such a situation has become a hot topic. Recently, a number of studies have demonstrated that PsyCap, as a positive psychological resource, reduces people's stress, depression, anxiety, and turnover intention during the COVID-19 pandemic, and improves their life satisfaction, job satisfaction, and work engagement (e.g., Alat et al., 2023; Song et al., 2020; Turliuc & Candel, 2022). Therefore, PsyCap is an indispensable asset for organizations and individuals to survive and win in complex, uncertain, and challenging circumstances, and its role may even be greater than that of human and social capital (Luthans & Youssef, 2004).
Despite the extensive research on the essential role of PsyCap in organizational behavior, there are several limitations in previous studies on employees’ PsyCap. For example, the psychometric properties of the PCQ-12 (Luthans et al., 2008), a frequently used PsyCap measure, need to be systematically validated among Chinese employees. Furthermore, it is necessary to compare the PCQ-12 with the PCQ-24 (Luthans et al., 2007a), the original 24-item Psychological Capital Questionnaire, whose items are twice that of the PCQ-12. By doing so, evidence can be provided to support the use of the PCQ-12 as a more economic and valid instrument for measuring Chinese employees’ PsyCap.
Additionally, the majority of previous PsyCap studies adopted a variable-centered approach (e.g., correlation and regression) to examine the additive linear effects of the four components of PsyCap on work outcomes. However, such an analytic approach ignores the potential combinations of the four components in novel and unique forms that may have different effects on work outcomes (Dawkins et al., 2013). Accordingly, some researchers (e.g., Dawkins et al., 2013; Luthans & Youssef-Morgan, 2017) suggest adopting a person-centered approach, which treats individual members in a holistic way and may enable us to find distinct subgroups that exhibit unique PsyCap configurations as well as their different effects on work outcomes. Following this suggestion, several studies have attempted to use a person-centered approach to determine the types of employees with particular PsyCap configurations and to examine how these PsyCap profiles relate to outcomes differently (Bouckenooghe et al., 2019; Djourova et al., 2019). Nevertheless, the results of these studies are inconsistent. Moreover, data on employees’ PsyCap and work outcomes were collected at the same time in these studies adopting a person-centered approach, which may result in common method bias (Antonakis et al., 2010; Podsakoff et al., 2012), and we cannot investigate the relationship between the employees’ PsyCap profiles and work outcomes in depth.
Furthermore, it is important to note that there is a lack of person-centered PsyCap research among Chinese employees. Thus, the subgroups of Chinese employees with different combinations of the four components of PsyCap and how these profiles differ in work outcomes remain unknown. Avey et al. (2011), in their meta-analysis, revealed that there was a cultural difference in the relationship between employees’ PsyCap and work outcomes. As such, it is necessary to adopt a person-centered approach to investigate the individual PsyCap profiles of Chinese employees as well as the relationships between these PsyCap profiles and work outcomes, which can provide an in-depth understanding of the characteristics of Chinese employees’ PsyCap configurations and offer insights for organizations to design targeted PsyCap interventions for Chinese employees.
Psychological capital: Its construct and measurement
PsyCap comprises four components, that is, self-efficacy, optimism, hope, and resilience. Specifically, self-efficacy means that one is confident in taking on challenging tasks and putting forth efforts to attain success; optimism involves one's positive attribution of succeeding now and in the future; hope reflects one's belief in persevering toward goals and adjusting paths to achieve goals; and resilience is the capacity to sustain and bounce back and even beyond to achieve success when one is confronted with adversity (Luthans et al., 2007b, p. 3). Luthans et al. (2007a) suggested that the four dimensions are indicators of a “higher-order” construct, that is, PsyCap, and developed the PCQ-24 with six items per dimension. Notably, there are three reverse-coded items in the PCQ-24. Specifically, the resilience dimension has one reverse-coded item, and the optimism dimension has two. Generally, the PCQ-24 has been confirmed to have sufficient content, convergent, discriminant, and criterion validity as well as acceptable internal consistency and test-retest reliability. In addition, the composite PsyCap positively predicts employees’ performance and job satisfaction, and the effects were greater than those of its components independently. Thus, the PCQ-24 has become the most common, psychometrically supported tool for measuring PsyCap (Rice et al., 2021).
Luthans et al. (2008) later reduced the original 24 items of the PCQ to 12 items, with 3 items measuring self-efficacy, 4 items measuring hope, 2 items measuring optimism, and 3 items measuring resilience. The three reverse coded items in the PCQ-24 were dropped. In their study, the PCQ-12 was found to have acceptable internal consistency reliability with 0.68 (Cronbach's α) for the total score, and the overall PsyCap positively predicted performance. Given that the PCQ-12 contains only half of the items from the original PCQ-24, adopting the PCQ-12 to measure PsyCap seems to be more economical and practical. Indeed, the PCQ-12 has been frequently used in subsequent PsyCap research (e.g., Dawkins et al., 2018; Luthans et al., 2013; Norman et al., 2010; Woolley et al., 2011).
Despite the popularity of the PCQ-12 for measuring PsyCap, it is noteworthy that when Luthans et al. (2008) first proposed the PCQ-12, they did not provide the internal consistency coefficient of each dimension or verify the construct, convergent validity, discriminant validity, or test-retest reliability. Furthermore, when subsequent researchers applied the PCQ-12 in their studies, they simply calculated the composite score of these 12 items, and few of them systematically verified its reliability and validity. In a study that evaluated the psychometric properties and measurement invariance of PsyCap in samples from Chile and the USA, the PCQ-12 was found to be superior to the PCQ-24. However, in China, the psychometric properties of the PCQ-12 have not been systematically evaluated among employees; thus, our knowledge of its reliability (e.g., internal consistency reliability and test-retest reliability) and validity (e.g., construct validity, convergent validity, discriminant validity, and criterion validity) is limited, and it is still unclear whether the PCQ-12 is superior to the PCQ-24. Therefore, the first aim of the present research is to systematically evaluate the psychometric properties of the PCQ-12 among Chinese employees and compare the PCQ-12 with the PCQ-24 to provide a valid and economic instrument for measuring employees’ PsyCap in China.
Analytic approach to PsyCap research: Variable- or person-centered?
The variable-centered approach and the person-centered approach are two different analytic approaches that can be used in PsyCap research. Specifically, the variable-centered approach focuses on describing variables and analyzing their associations across individuals with the underlying assumptions that the variables function in the same way across all individuals (Morin et al., 2018). By treating variables as the primary unit of analysis, this approach aims to identify and explain associations between them and to generalize the findings to the population as a whole (Bollen, 1989). Statistical techniques such as correlation and regression analysis are commonly used in the variable-centered approach to examine relationships between variables (Hair et al., 2017; Morin et al., 2018). In contrast, the person-centered approach focuses on analyzing individuals or subgroups within a population to identify meaningful patterns or profiles of individuals based on their characteristics, behaviors, or experiences (Bergman & Trost, 2006). This approach recognizes and values individual differences, aiming to understand heterogeneity within the population. Clustering techniques such as latent class/profile analysis or cluster analysis are commonly used in the person-centered approach to group individuals with similar attributes together (Woo et al., 2018). These techniques allow researchers to identify distinct subgroups or profiles based on shared characteristics or behaviors. Therefore, the person-centered approach provides a more nuanced understanding of the heterogeneity within the population beyond the average effects observed in the variable-centered approach.
Currently, most studies adopt a variable-centered approach to directly analyze the effects of overall PsyCap on different work outcomes (e.g., Avey et al., 2011; Bouckenooghe et al., 2019; Dawkins et al., 2013; Newman et al., 2014). However, this additive analytic approach assumes that the four components of PsyCap have the same impact on work outcomes, which may mask the unique variations explained by the specific combination of the four components (Dawkins et al., 2013). As Luthans et al. (2007b) noted, although these four dimensions are inter-correlated, they are independent and have discriminant validity; hence, individuals may have different levels of the four components, such as scoring higher on some components, but lower on other components, and these different combinations may vary in their effects on work outcomes. Thus, some researchers suggest adopting a person-centered approach to identify distinct subgroups with unique PsyCap configurations and to further understand how these particular PsyCap profiles differentially relate to outcomes (e.g., Dawkins et al., 2013; Luthans & Youssef-Morgan, 2017).
In response to this call, a number of studies have recently undertaken a person-centered, latent profile analysis (LPA) of employees’ PsyCap. For instance, Bouckenooghe et al. (2019) studied 171 clerical staff from various occupational sectors in Pakistan and identified six PsyCap profiles. Specifically, two profiles were qualitatively different, with one profile dominant in low optimism and another dominant in low resilience, and the other four profiles were quantitatively different, with the four components of PsyCap at similar levels, that is, low, moderate, high/moderate, and high. They further conducted a second study among 190 Ukrainian professionals from various organizations across occupational sectors. The results replicated the six profiles observed in the first study and revealed one additional quantitative profile characterized by low/moderate PsyCap. These seven profiles had different effects on work outcomes, with employees in the dominant low-resilience profile scoring the lowest in both work engagement and job performance, while employees in the high PsyCap profile scored the opposite. Although Bouckenooghe et al. (2019) conducted two studies to explore employees’ PsyCap profiles and their relationships with outcomes, the samples were much smaller than the recommended minimum size of approximately 500, which may not ensure sufficient accuracy in identifying the correct number of profiles (Nylund et al., 2007); thus, the robustness of their results needs to be further validated.
Djourova et al. (2019) also adopted a person-centered approach to investigate employees’ PsyCap configurations in Spain, and four profiles were identified. Specifically, three profiles were qualitatively different, with Profile 1 characterized by low self-efficacy and hope and high resilience and optimism; Profile 2 characterized by high self-efficacy and hope and low resilience and optimism; and Profile 3 characterized by low self-efficacy and high hope, resilience and optimism. In contrast, Profile 4 scored similarly high on all four components of PsyCap. In addition, the four profiles differed in some work outcomes. For example, Profile 4 scored significantly higher than the other three profiles in both OCB and job satisfaction, while Profile 1 scored lower than Profile 2 in job satisfaction and Profile 2 scored higher in OCB than Profile 3, which tends to emphasize the important contributions of hope and self-efficacy. However, no significant differences were found across the four profiles for in-role performance. Notably, in this study, most of the sample (88.47%) was classified into Profile 4, that is, high on all four components of PsyCap, which supports the unitary structure of PsyCap with its four dimensions converging into an underlying positive capacity. Nevertheless, the profiles revealed in this study differed from those of Bouckenooghe et al. (2019).
In summary, scant studies have adopted a person-centered approach to investigate employees’ PsyCap profiles, and their results are inconclusive. Moreover, data on employees’ PsyCap and work outcomes were collected at the same time, which may result in common method bias (Antonakis et al., 2010; Podsakoff et al., 2012). Additionally, there is a lack of such studies among Chinese employees, and it is still unclear whether there are subgroups of Chinese employees with different combinations of the four components of PsyCap and how these profiles differ in work outcomes. Therefore, the second aim of the present research is to adopt a person-centered approach to identify latent profiles of Chinese employees’ PsyCap and investigate their relationships with different work outcomes such as work engagement, job satisfaction, and turnover intention that are commonly associated with PsyCap (e.g., Avey et al., 2011; Djourova et al., 2019; Song et al., 2021). By doing so, we intend to offer a fine-grained understanding of Chinese employees’ PsyCap configurations and provide insights for organizations to evaluate employees’ PsyCap more accurately and further design targeted PsyCap interventions.
Overview of the present research
With the two abovementioned aims, we conducted two studies in the current research. In Study 1, we systematically evaluated the psychometric properties of the PCQ-12 and compared them with those of the PCQ-24 among Chinese employees to clarify the construct of Chinese employees’ PsyCap and further provide a valid and economic instrument for measuring PsyCap. In Study 2, the PCQ-12 validated in Study 1 was used to measure the PsyCap of Chinese employees from various organizations and industries, and a person-centered analytic approach was adopted to investigate latent profiles of PsyCap and how they differ in the employees’ demographics and work outcomes with a time-lagged design.
Study 1
Method
Participants and procedure
We collected data 1 at two time points among employees from two companies located in an eastern Chinese city. The human resource departments sent the survey link to 871 employees in these two companies. Specifically, at T1, we measured employees’ PsyCap and demographic information. After two months (T2), employees’ work attitudes and behaviors were measured as criterion variables of the PCQ-12. Ultimately, 755 employees completed the two surveys with a response rate of 86.68%. Our participants were largely females (72.2%). On average, they were 31.33 years old (SD = 5.58) and had worked in their current position for 4.72 years (SD = 4.14). Regarding their education level, 29.7% held a college degree, 34.3% had a bachelor's degree, 9.4% held a master's degree or above, and 26.6% had not attended college or university before.
Measures
PsyCap (T1) was measured with the Psychological Capital Questionnaire (PCQ; Luthans et al., 2007a). Both the 24-item (Luthans et al., 2007a) and 12-item (Luthans et al., 2008) versions were used. Responses were given on a 6-point Likert scale ranging from 1 (strongly disagree) to 6 (strongly agree). Cronbach's αs of the total score and the four dimensions (self-efficacy, hope, resilience, and optimism) of the PCQ-24 were 0.93, 0.66, 0.80, 0.87, and 0.90, respectively, and those for the PCQ-12, 0.92, 0.76, 0.80, 0.84, and 0.82, respectively.
Work attitudes and behaviors were measured two months later to test the criterion validity of the PCQ-12. The specific measures are as follows:
Work engagement (T2) was measured with the 9-item Utrecht Work Engagement Scale (Schaufeli et al., 2006). Responses were given on a 7-point Likert scale ranging from 0 (never) to 6 (always). Cronbach's α was 0.96.
Job burnout (T2) was measured with the 15-item Chinese version of the Maslach Burnout Inventory-General Survey (MBI-GS), which was validated by Li and Shi (2003). Items were rated on a 7-point Likert scale ranging from 0 (never) to 6 (every day). Cronbach's α was 0.94.
Job satisfaction (T2) was measured with the 3-item overall job satisfaction scale from the Michigan Organizational Assessment Scale (Cammann et al., 1979). Responses were given on a 6-point Likert scale ranging from 1 (strongly disagree) to 6 (strongly agree). Cronbach's α was 0.88.
Turnover intention (T2) was measured with 3 items adapted from the turnover intention scale by Mobley et al. (1978). Responses were given on a 5-point Likert scale ranging from 1 (strongly disagree) to 5 (strongly agree). Cronbach's α was 0.93.
Voice behaviors (T2) were measured with the 10-item voice scale developed by Liang et al. (2012). Responses were given on a 5-point Likert scale ranging from 1 (strongly disagree) to 5 (strongly agree). The scale has two dimensions, that is, promotive voice and prohibitive voice. Cronbach's αs for promotive voice and prohibitive voice were 0.96 and 0.88, respectively.
OCB (T2) was measured with the 14-item scale developed by Williams and Anderson (1991). Responses were given on a 5-point Likert scale ranging from 1 (strongly disagree) to 5 (strongly agree). The scale has two dimensions, that is, OCB-I and OCB-O. Cronbach's αs for OCB-I and OCB-O were 0.90 and 0.80, respectively.
Analytical approach
The data analysis was conducted using SPSS 24.0 and Mplus 7.4 (Muthén & Muthén, 2012). First, we calculated the internal consistency reliability of the questionnaires (i.e., Cronbach’s α coefficient) and reported them in the measures section. Next, a series of confirmatory factor analyses (CFAs) were conducted to verify and compare the factor structures of the PCQ-12 and PCQ-24. In addition, we examined the convergent validity and discriminant validity of the questionnaire. Furthermore, correlation and regression analyses were used to examine the criterion related validity of the questionnaire. Finally, we tested the retest reliability of the questionnaire.
Results
Confirmatory factor analysis (CFA)
First, we conducted a series of confirmatory factor analyses to examine the factor structure of the PCQ-12 and PCQ-24 using Mplus 7.4 with the maximum likelihood estimation method. Both the PCQ-12 and PCQ-24 were evaluated on model fit criteria, including the comparative fit index (CFI), root mean squared error of approximation (RMSEA) and the square root mean residual (SRMR). The model was considered acceptable if at least two indicators meeting the general cutoffs (e.g., CFI > 0.90; RMSEA < 0.06; SRMR < 0.08; Hu & Bentler, 1999). As shown in Table 1, for the PCQ-12, the four-factor model showed a better fit than the single-factor model as indicated by the significant difference in the chi-square statistic (Δχ2(6) = 443.92, p < .001). Moreover, the goodness-of-fit indices also revealed a relatively good fit for the four-factor model (CFI = 0.95, RMSEA = 0.08, SRMR = 0.04) but not for the single-factor model (CFI = 0.86, RMSEA = 0.13, SRMR = 0.06). Then, we tested the second-order four-factor model. The results revealed that the goodness-of-fit indices were also acceptable (CFI = 0.94, RMSEA = 0.09, SRMR = 0.04), supporting the second-order four-factor model of the PCQ-12.
Model fit indices for the PCQ-12 and PCQ-24
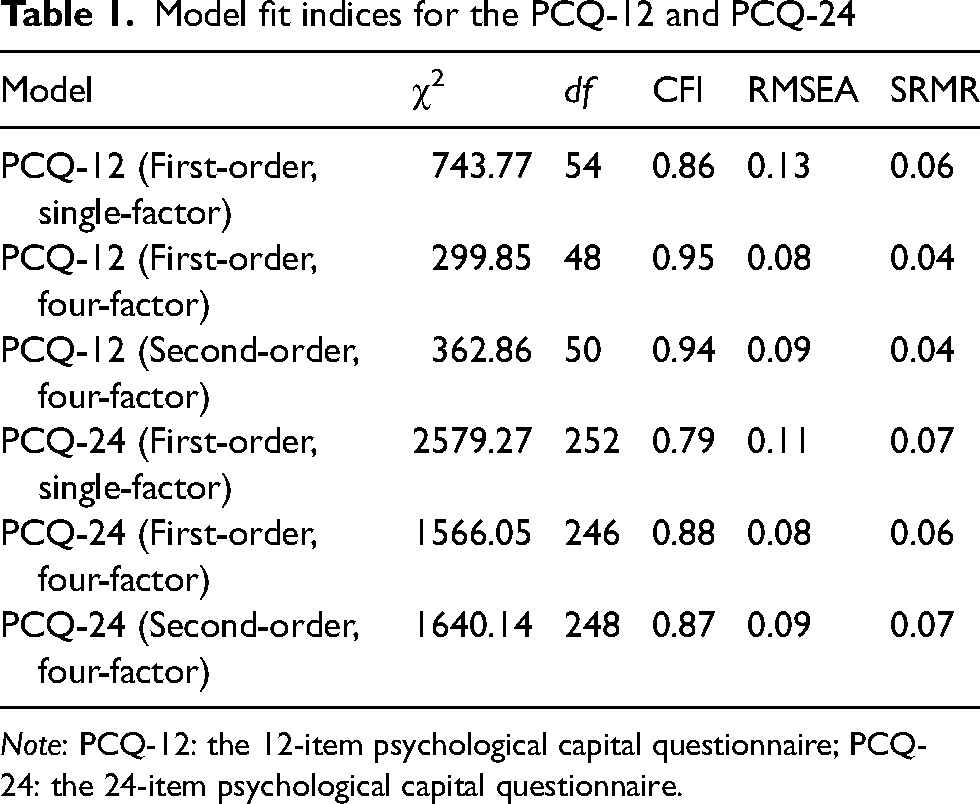
Note: PCQ-12: the 12-item psychological capital questionnaire; PCQ-24: the 24-item psychological capital questionnaire.
Next, we examined the factor structure of the PCQ-24. As also shown in Table 1, the fits of all three models of the PCQ-24 tested were worse than those of the PCQ-12 and unacceptable. Thus, our results support the use of the PCQ-12 as a better tool for measuring PsyCap in Chinese employees.
Convergent validity and discriminant validity
We subsequently tested the convergent and discriminant validity of the PCQ-12. As shown in Table 2, the average variance extracts (AVEs) of the four dimensions (i.e., efficacy, hope, resilience, and optimism) of the PCQ-12 were greater than 0.50, and the composite reliabilities (CRs) of these four dimensions were greater than 0.70, indicating good convergent validity of the PCQ-12. In addition, the correlations between each dimension (also see Table 2) ranged from 0.46 to 0.76, less than the square root of AVEs, indicating that the four dimensions of the PCQ-12 were discriminant.
Convergent validity and discriminant validity of the PCQ-12
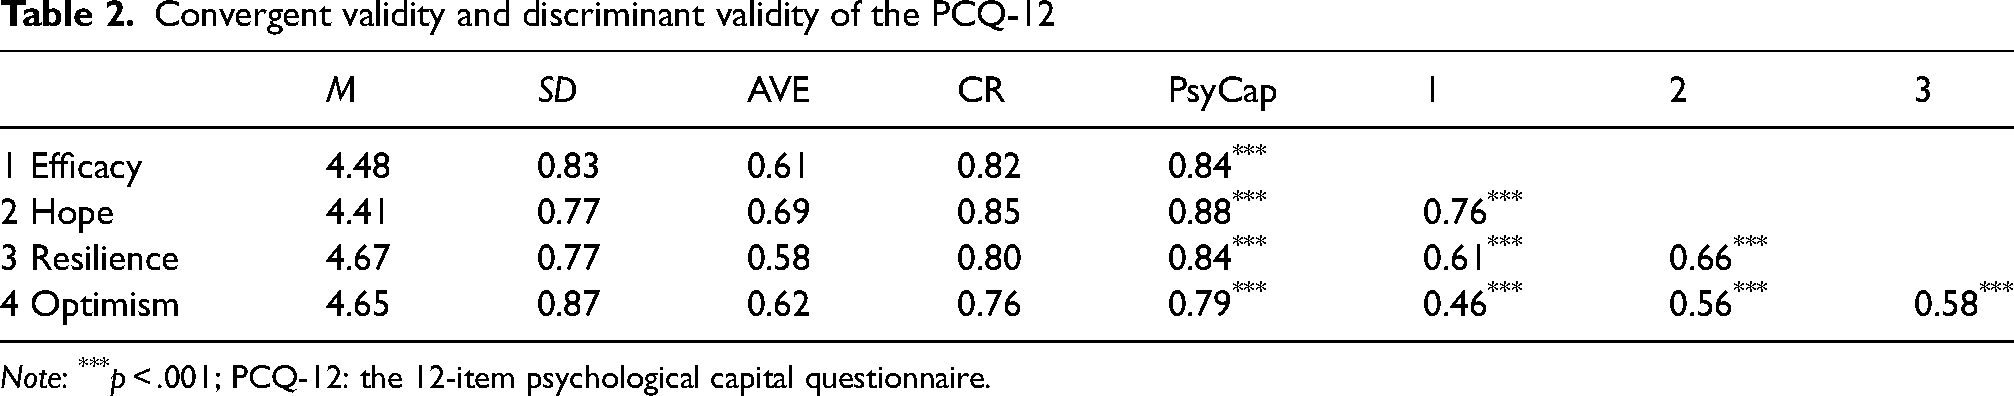
Note: ***p < .001; PCQ-12: the 12-item psychological capital questionnaire.
Criterion validity
We conducted correlation analyses to examine the criterion related validity of the PCQ-12. As shown in Table 3, the composite score of the PCQ-12 and its components were significantly and positively related to work engagement, job satisfaction, promotive voice, prohibitive voice, OCB-I, and OCB-O, and significantly and negatively related to job burnout and turnover intention. We further conducted regression analyses to examine the predictive effects of the PCQ-12 on employee work attitudes and behaviors. Our results showed that after controlling for age, gender, education, and tenure in the current position, the composite score of the PCQ-12 significantly predicted a series of work attitudes and behaviors measured two months later. Specifically, the composite score of the PCQ-12 positively predicted work engagement (β = 0.52, ΔR2 = 0.26, p < .001), job satisfaction(β = 0.41, ΔR2 = 0.16, p < .001), OCB-I (β = 0.41, ΔR2 = 0.16, p < .001), OCB-O (β = 0.37, ΔR2 = 0.13, p < .001), promotive voice (β = 0.39, ΔR2 = 0.15, p < .001), and prohibitive voice (β = 0.38, ΔR2 = 0.14, p < .001), but negatively predicted job burnout (β = −0.43, ΔR2 = 0.18, p < .001) and turnover intention (β = −0.30, ΔR2 = 0.09, p < .001). In summary, the PCQ-12 had adequate predictive validity for employees’ work attitudes and behaviors.
orrelations between PCQ-12 and criterion variables (N = 755)
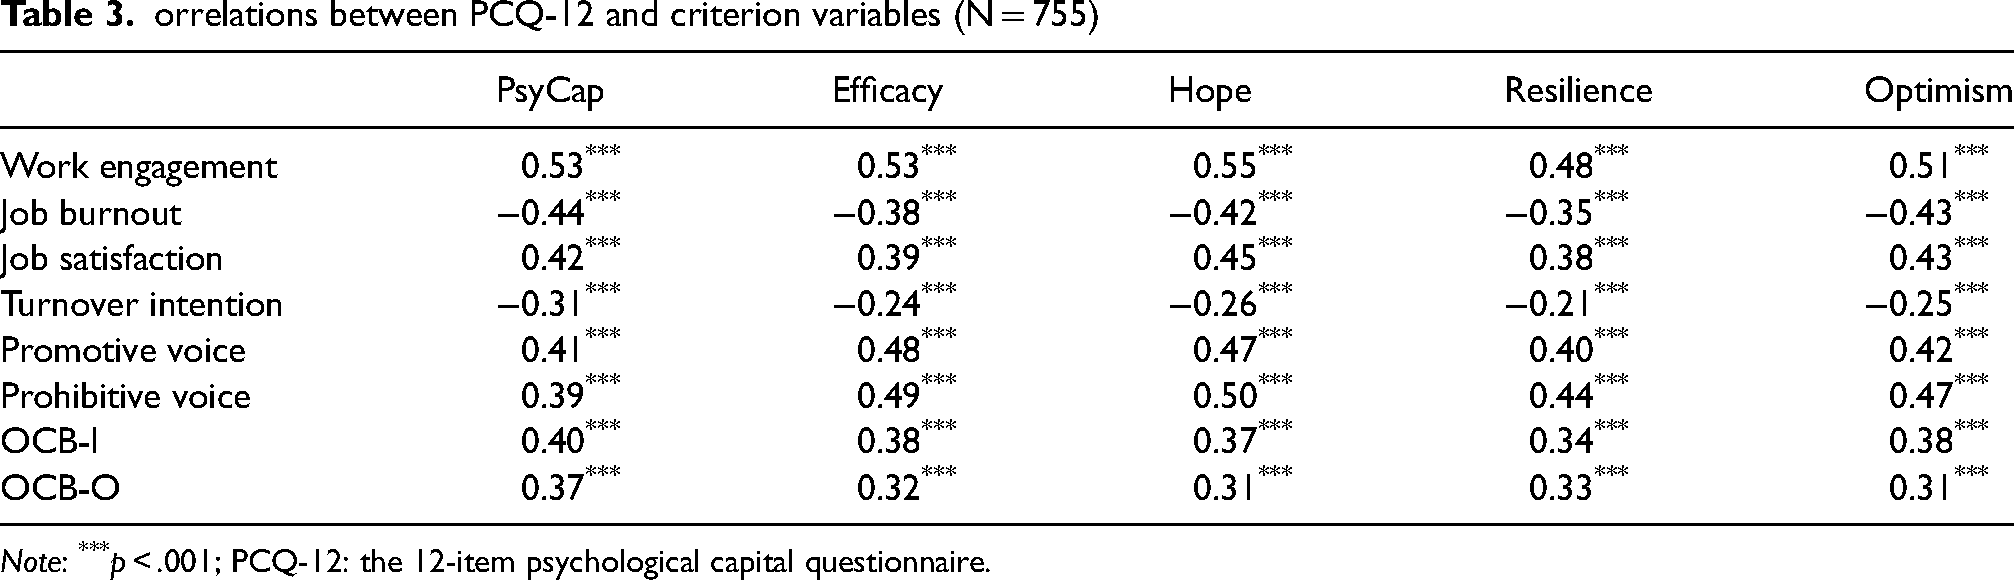
Note: ***p < .001; PCQ-12: the 12-item psychological capital questionnaire.
Reliability assessment
One month after the first survey, 150 participants were randomly selected to complete the PCQ-12 again. We analyzed the test-retest reliability of the total PCQ-12 and subscale scores. The results showed that the test-retest reliability scores were adequate (total score, r = .67; efficacy, r = .54; hope, r = .61; resilience, r = .68; optimism, r = .55, ps < .001).
Study 2
In Study 1, the PCQ-12 was found to be a better tool than the PCQ-24 for measuring PsyCap among Chinese employees. Additionally, the PCQ-12 has sufficient validity and reliability. Thus, in Study 2, we used the PCQ-12 to measure Chinese employees’ PsyCap, performed a latent profile analysis of their PsyCap, and compared the identified profiles in demographics and work outcomes such as work engagement, job satisfaction, and turnover intention.
Method
Participants and procedure
The data of Study 2 are part of a larger project that aims to investigate the antecedents of employee authenticity. Although subsets of the data have been used in previous work (Song et al., 2024), the research questions, analytical approaches, results reported, and conclusions made in the current article do not have any overlap with the previous work. Specifically, in this study, a two-wave survey was administered to employees throughout China via online websites, dedicated to participant recruitment, such as Cremado (https://www.credamo.com/home.html) and Wenjuanxing (https://www.wjx.cn). In the first wave, the participants were asked to report their demographic information and complete the Psychological Capital Questionnaire. One month later, the same participants were asked to rate their work engagement, job satisfaction, and turnover intention. The final matched sample consisted of 1,349 participants from 30 provinces or municipalities in China. All the participants were full-time employees from a wide range of industries, such as manufacturing services (24.9%), information transmission, software and IT services (16.1%), education services (7.7%), and wholesale and retail trade (7.3%). On average, the participants were 31.43 years old (SD = 5.99), and their mean tenure was 8.04 years (SD = 4.14). The sex ratio of the participants was almost even, with 666 males and 683 females. In terms of their education level, 193 (14.3%) participants had a college degree, 993 (73.6%) held a bachelor's degree, 95 (7%) had a master's degree or above, and only 7 (5%) had not attended college or university before. Most of the participants were ordinary staff or junior managers (78.8%), and only 2% were senior managers.
Measures
PsyCap (T1) was measured with the 12-item Psychological Capital Questionnaire (PCQ-12; Luthans et al., 2008). Responses were given on a 6-point Likert-type scale ranging from 1 (strongly disagree) to 6 (strongly agree).
Work engagement (T2) was measured with the 9-item Utrecht Work Engagement Scale (Schaufeli et al., 2006). Responses were given on a 7-point Likert scale ranging from 0 (never) to 6 (always).
Job satisfaction (T2) was measured with the 3-item overall job satisfaction scale from the Michigan Organizational Assessment Scale (Cammann et al., 1979). Responses were given on a 6-point Likert scale ranging from 1 (strongly disagree) to 6 (strongly agree).
Turnover intention (T2) was measured with three items adapted from the turnover intention scale by Mobley et al. (1978). Responses were given on a 5-point Likert scale ranging from 1 (strongly disagree) to 5 (strongly agree).
Analytical approach
LPA of PsyCap was conducted in Mplus 7.4 (Muthén & Muthén, 2012). We estimated a series of models and used several fit indices to determine the optimal number of profiles. Specifically, the models with the lowest Akaike information criterion (AIC), Bayesian information criterion (BIC), and sample-size-adjusted BIC (SABIC) were considered better solutions. In addition, the adjusted Lo-Mendell-Rubin (LMR) test and the bootstrapped likelihood ratio test (BLRT) were used to determine whether a model with k profiles has a significantly better fit than that with a k-1 profile. The classification accuracy was assessed with Entropy which ranges from 0 to 1. The larger the Entropy is, the more accurate the classification is. Moreover, when we made profile decisions, each profile was required to include at least 5% of the sample, and these profiles must be substantively interpretable (Nylund et al., 2007). Next, we conducted analyses of variance (ANOVAs) in SPSS 24.0 to evaluate the generated profiles from LPA, and then labeled them according to the post hoc pairwise comparison tests.
After the profile analysis, we used ANOVAs or Chi-square (χ2) tests of independence to determine whether there were demographic differences across the determined profiles or whether belonging to a certain profile was significantly related to the demographic variables. We also conducted ANCOVAs and post hoc comparisons in which the profile groups were the independent variables, demographics such as age, gender, education, tenure, and job position were the control variables, and work engagement, job satisfaction, and turnover intention were the dependent variables.
Results
The descriptive statistics and correlations among the main variables are presented in Table 4.
Descriptive statistics and correlations among variables (N = 1349)
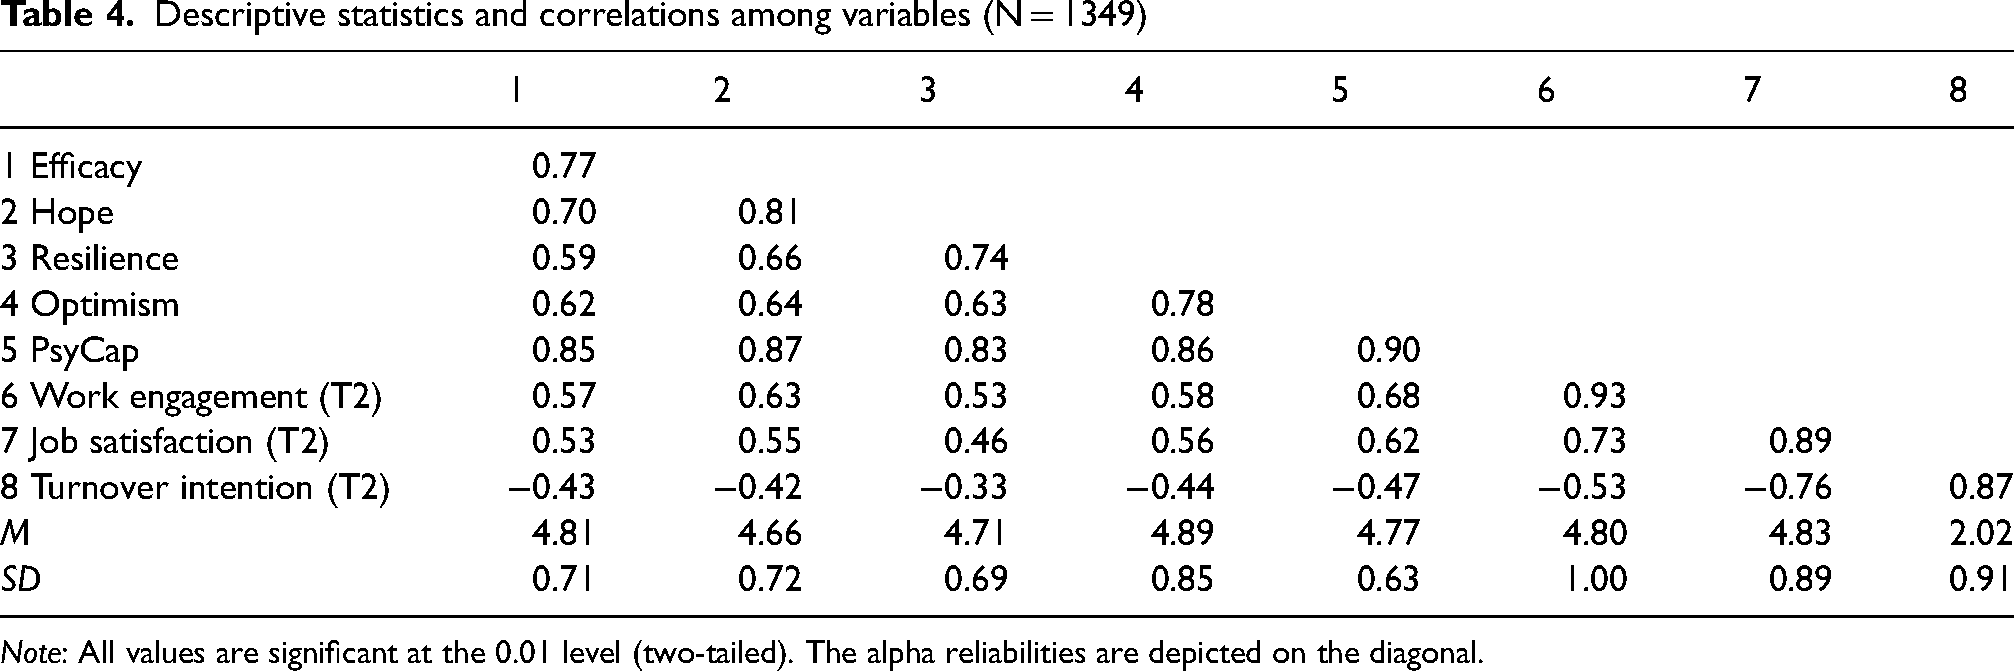
Note: All values are significant at the 0.01 level (two-tailed). The alpha reliabilities are depicted on the diagonal.
First, we used LPA to compare the models with two, three, four, and five profiles. As shown in Table 5, BIC and AIC indices continued to decrease with each new model, and the BLRT p-values supported that the models with more profiles had significantly better fits. However, the LMR p-value demonstrated that the model with five profiles did not have a better fit than the model with four profiles. In addition, the entropy values of all the models were similar (between 0.82 and 0.88) and above 0.70; thus, we considered the four-profile model is to be most likely to explain our data. Next, we plotted the standard scores for the components of PsyCap across the four profiles in Figure 1 to depict our four-profile solution, and conducted ANOVAs to demonstrate that the four PsyCap profiles were quantitatively distinct. As shown in Table 6, there were significant differences across the profiles for self-efficacy (F(3, 1345) = 932.18, p < .001, η2p = 0.68), hope (F(3, 1345) = 1103.59, p < .001, η2p = 0.71), optimism (F(3, 1345) = 578.58, p < .001, η2p = 0.56), and resilience (F(3, 1345) = 673.84, p < .001, η2p = 0.60).
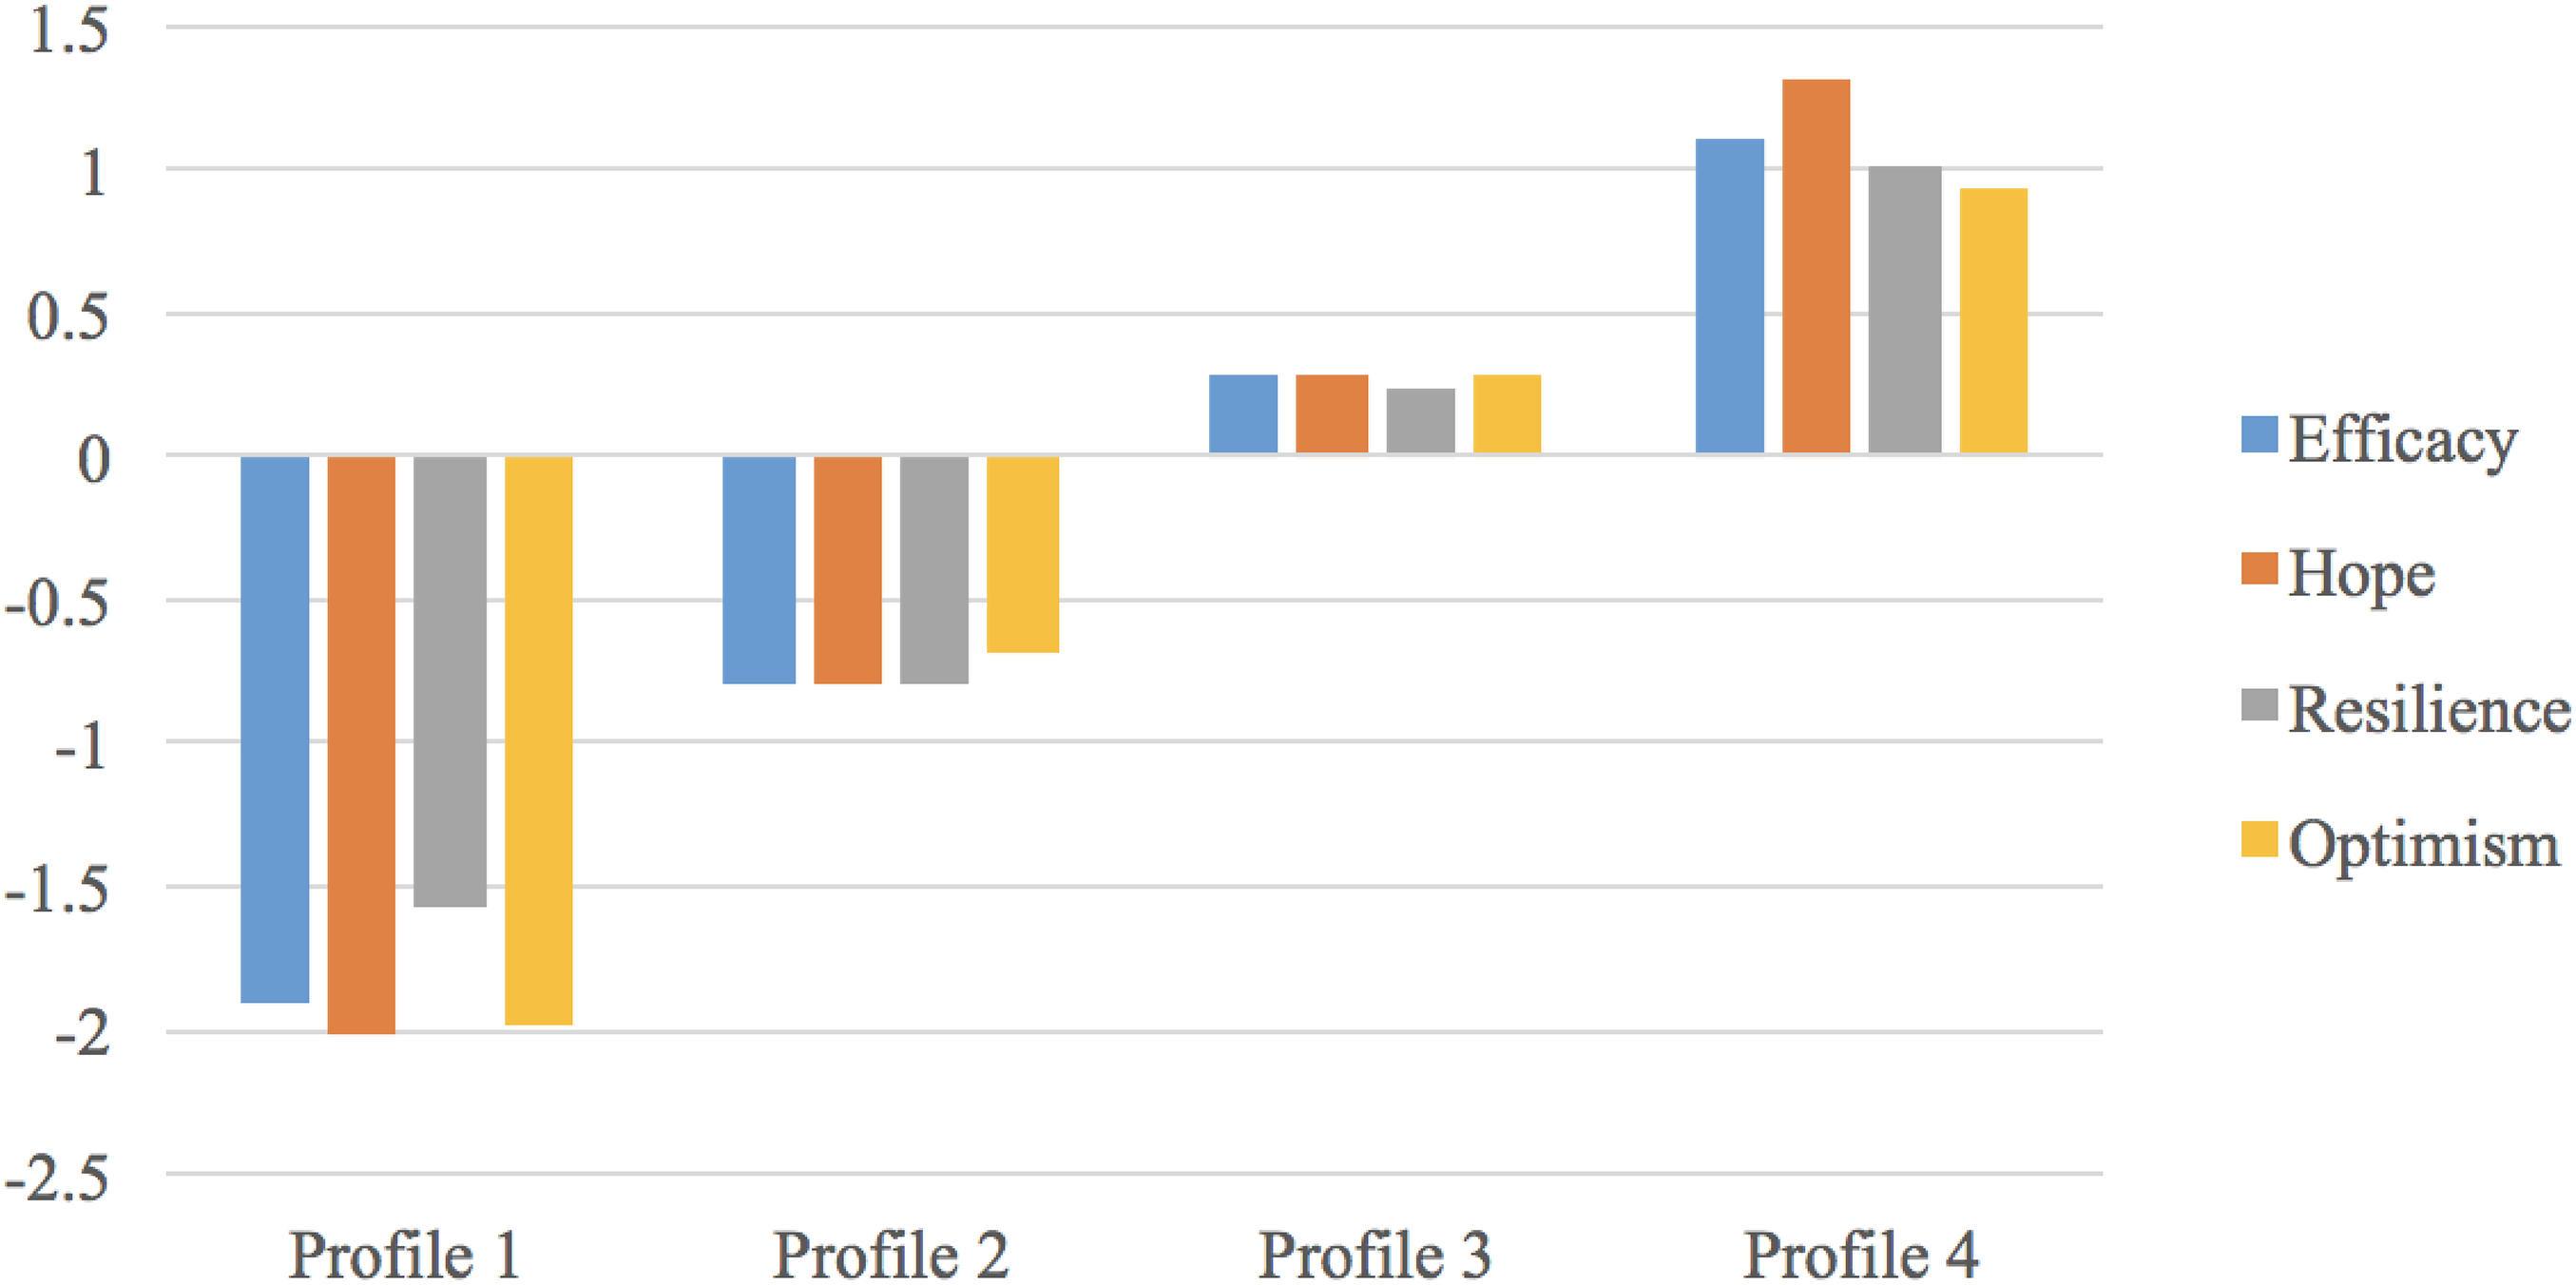
Latent profiles of four PsyCap components (standard scores).
Fit statistics for the latent profile analysis
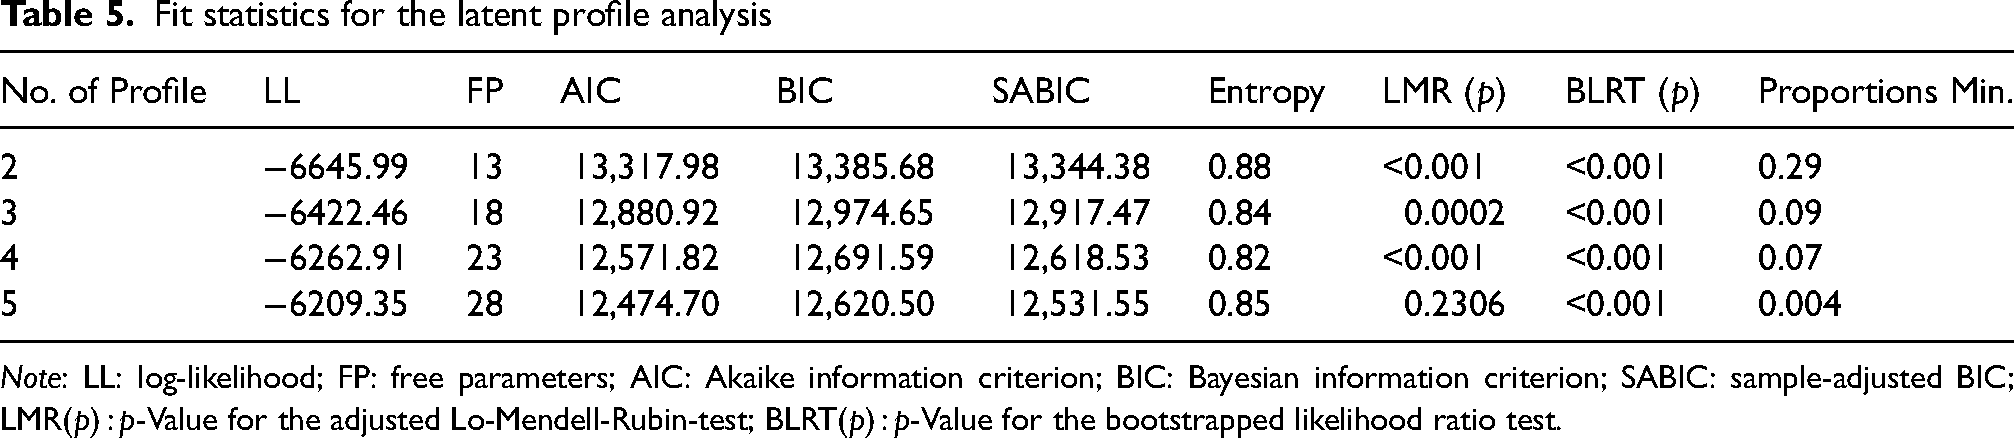
Note: LL: log-likelihood; FP: free parameters; AIC: Akaike information criterion; BIC: Bayesian information criterion; SABIC: sample-adjusted BIC; LMR(p) : p-Value for the adjusted Lo-Mendell-Rubin-test; BLRT(p) : p-Value for the bootstrapped likelihood ratio test.
Table 6 also presents the means and standard deviations of the four components of PsyCap (self-efficacy, hope, optimism, and resilience) by latent profile membership. Combining post hoc comparisons (LSD) and Figure 1, we labeled Profile 1 (n = 98, 7.27%) as Low PsyCap, which is composed of employees with low scores on all four PsyCap components. In contrast, employees in Profile 4 (n = 191, 14.16%) scored high on all four components and thus we labeled this profile as High PsyCap. Profile 3 (n = 742, 55.00%) was the largest group and its scores on the four components were above the average but not so high as those in High PsyCap. Accordingly, we labeled this profile as High/Moderate PsyCap. Similarly, Profile 2 (n = 318, 23.57%) was labeled as Low/Moderate PsyCap given that its scores on the four components were below the average but not so low as those in Low PsyCap profile.
Descriptive statistics and ANOVAs for the latent profiles
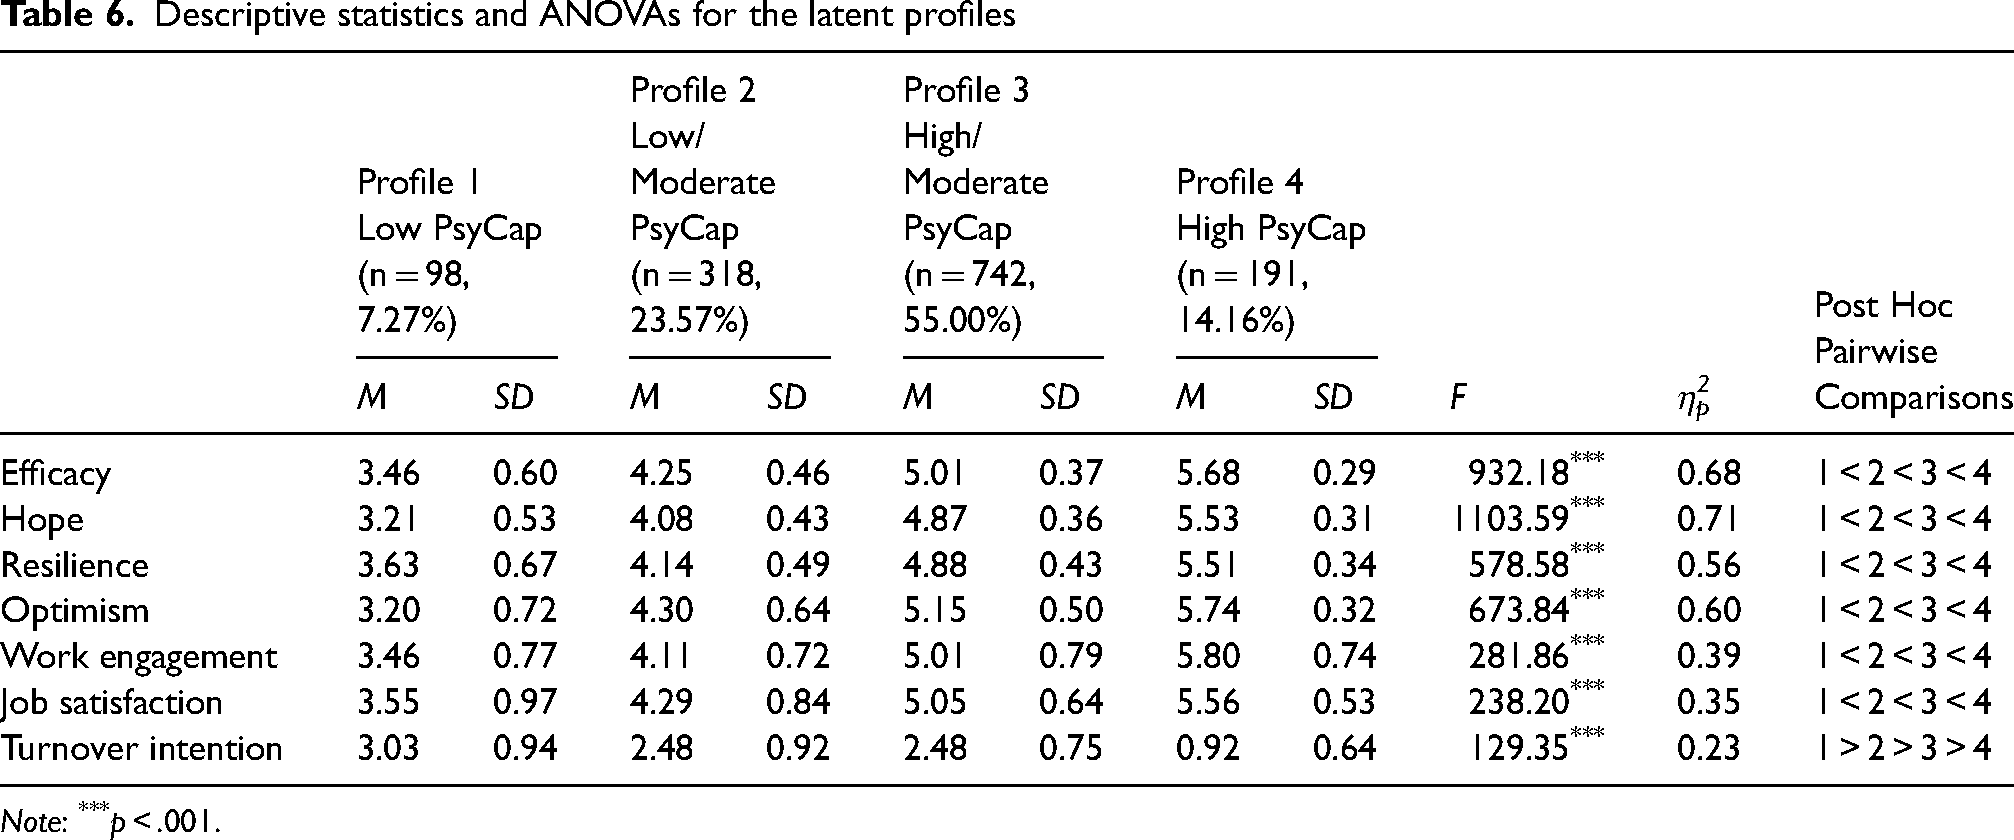
Note: ***p < .001.
We then checked the employees’ demographics in each profile. Specifically, for age and tenure, which are continuous variables, we conducted ANOVAs to determine whether there were differences in these profiles. The results showed that there were no age (F(3, 1345) = 2.02, p > .05) or tenure (F(3, 1345) = 2.33, p > .05) differences in these profiles. Next, we performed Chi-square tests of independence to determine whether belonging to a certain profile was significantly associated with gender, education, or position. In particular, we analyzed the standardized residuals and compared them to the critical values of ±1.96 (α = .05) to determine whether the observed frequencies of gender/education/position were significantly different from the expected frequency (MacDonald & Gardner, 2000).
As shown in Table 7, gender (χ2 = 16.77, p < .01), education (χ2 = 28.21, p < .01), and position (χ2 = 91.70, p < .001) were significantly related to belonging to a certain profile. In all the four profiles, some demographics deviated from the expected count. Specifically, for Profile 1 (Low PsyCap), there were more employees with a junior high school education or below (s. r. = 3.5 > 1.96) than expected. In terms of position, there were more ordinary staff than expected (s. r. = 4 > 1.96) but fewer middle managers (s. r. = −2.5 < −1.96) than expected. For Profile 2 (Low/Moderate PsyCap), the number of employees with a high school/vocational school/technical secondary school education was greater than expected (s. r. = 2.3 > 1.96). There were more ordinary staff than expected (s. r. = 4 > 1.96) but fewer middle managers (s. r. = −3.2 < −1.96) than expected. For Profile 3 (High/Moderate PsyCap), only the position deviated from the expected count; that is, there were fewer ordinary staff than expected (s. r. = −2.1 < −1.96). Finally, for Profile 4 (High PsyCap), in terms of gender, there were more males (s. r. = 2.2 > 1.96) than expected. Regarding position, there were fewer ordinary staff than expected (s. r. = −3.8 < −1.96) but more middle managers (s. r. = 2.7 > 1.96) than expected. Therefore, people with lower education and position were more likely to be classified into Profile 1 (Low PsyCap) or Profile 2 (Low/Moderate PsyCap), while males with higher position were more likely to be classified into Profile 4 (High PsyCap).
Distribution of demographics according to profile
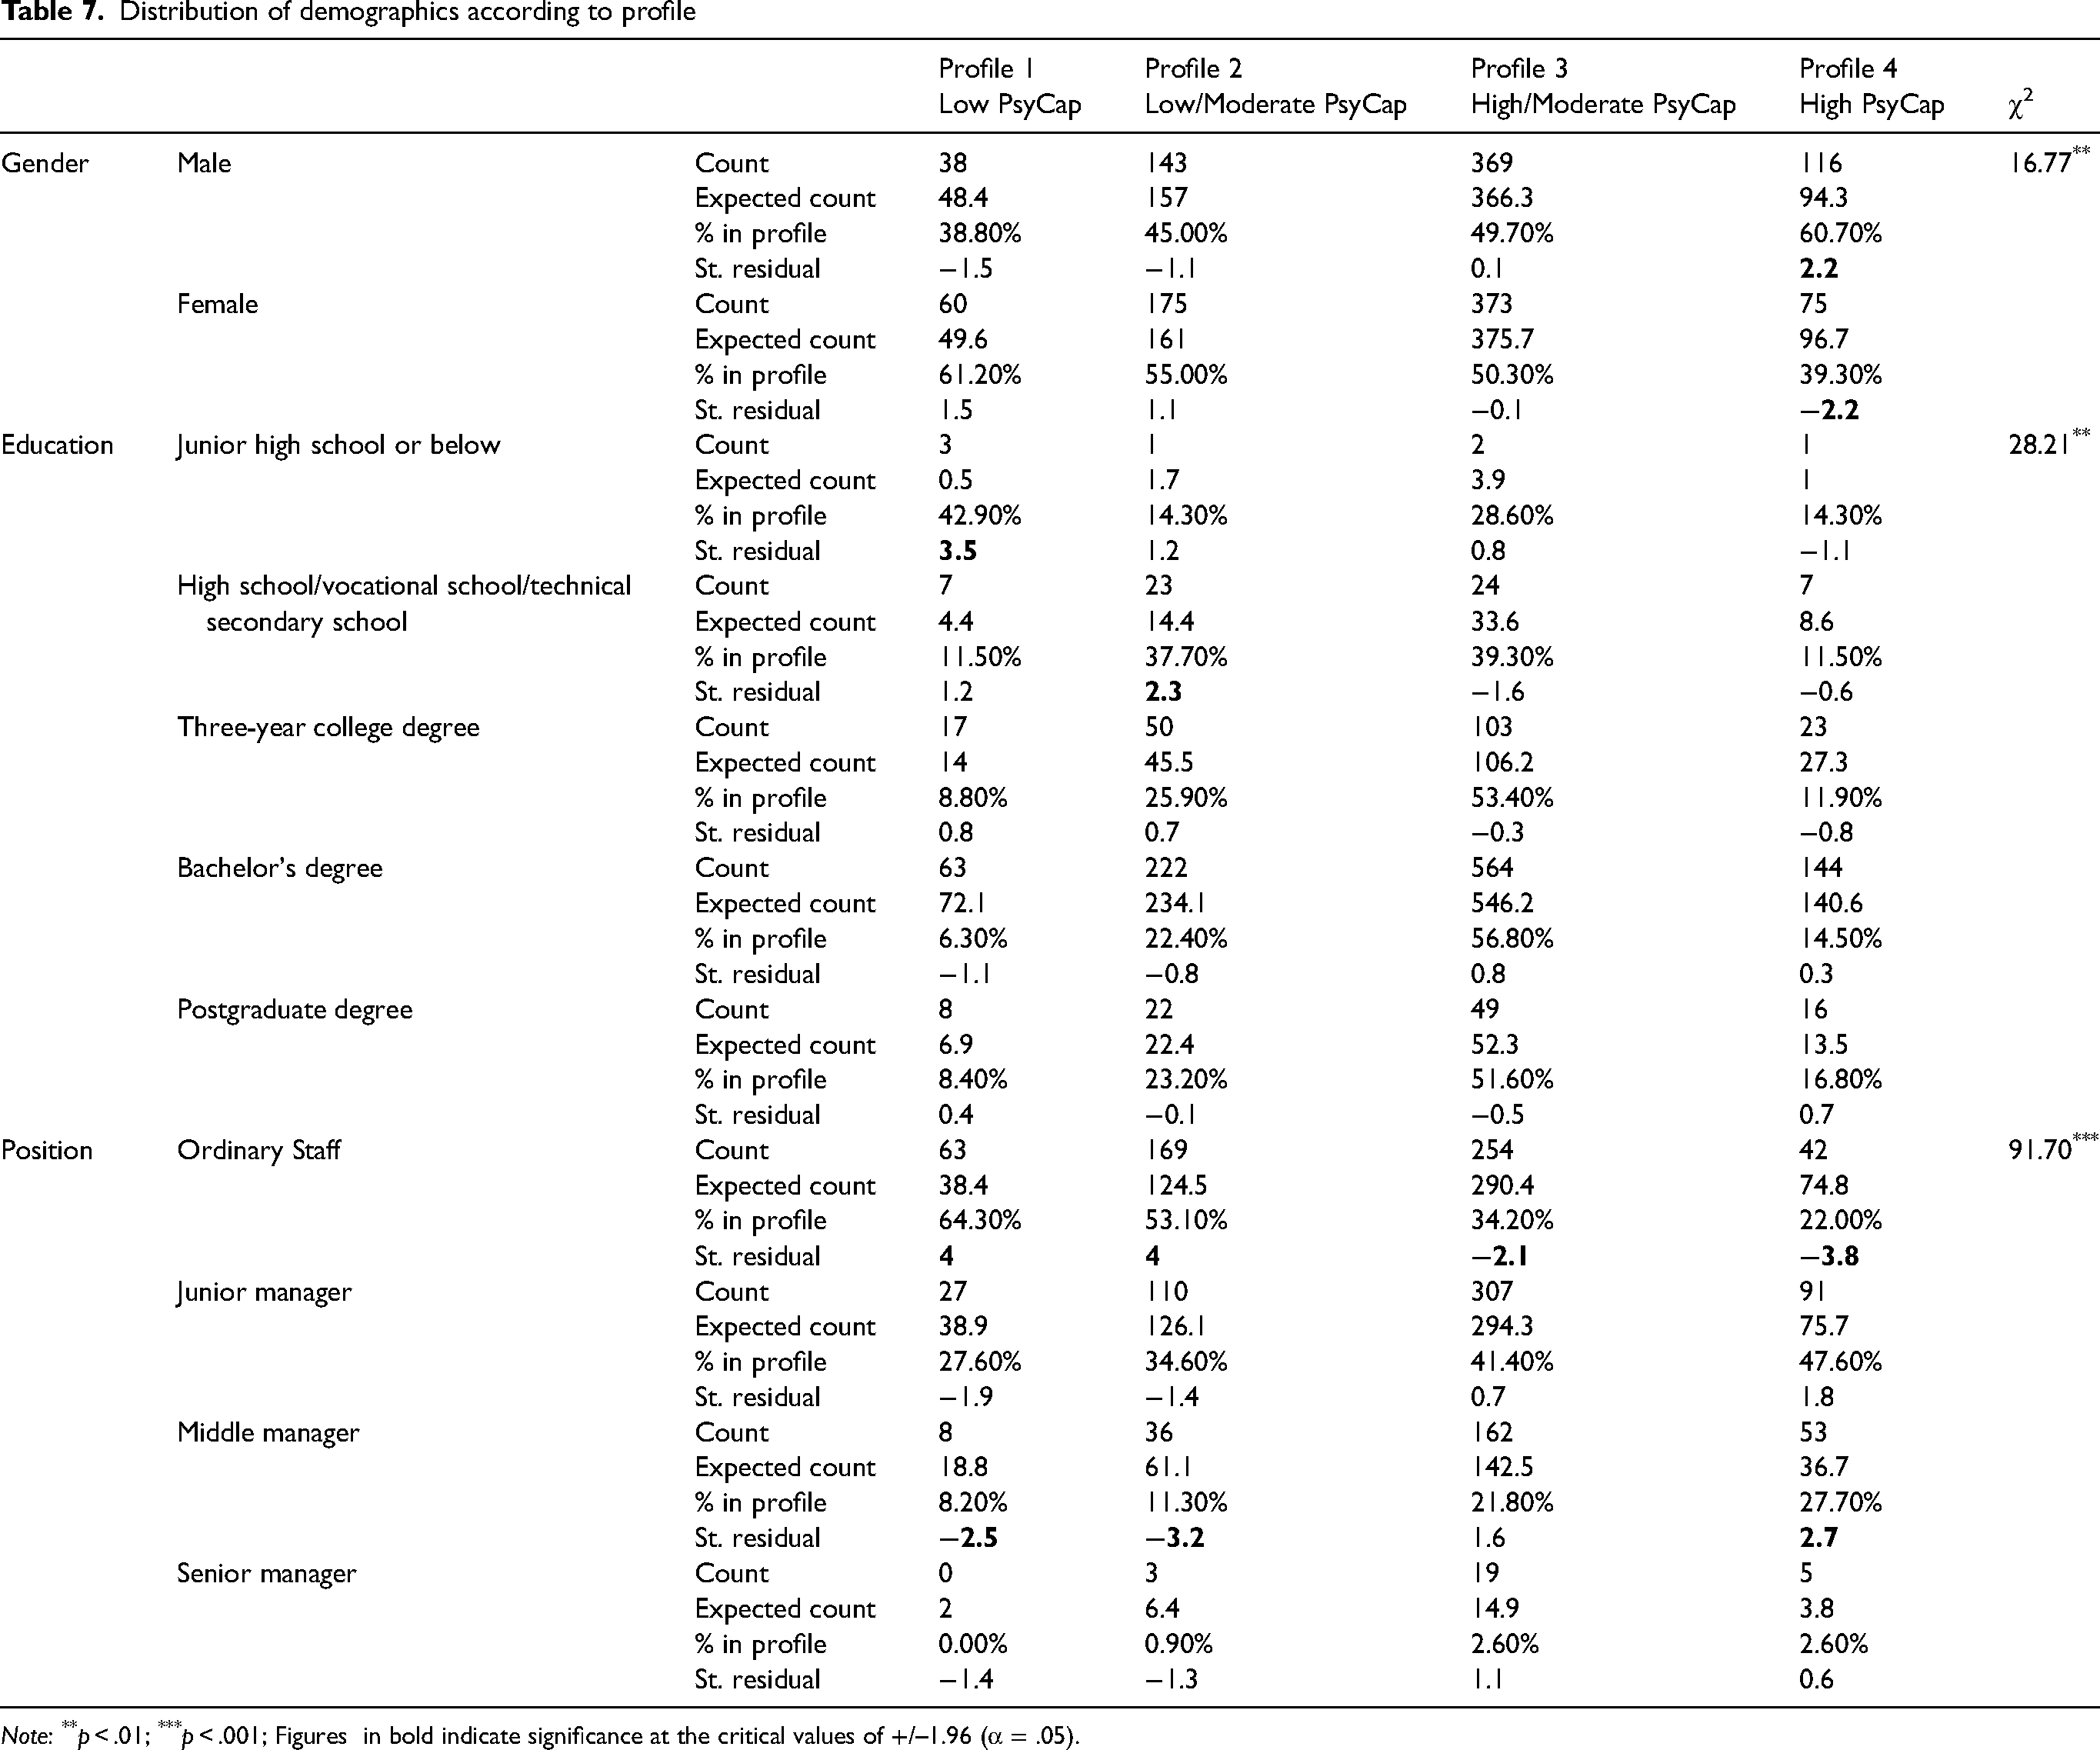
Note: **p < .01; ***p < .001; Figures in bold indicate significance at the critical values of +/–1.96 (α = .05).
With ANCOVAs, as also shown in Table 6, we found that there were significant differences across the four profiles for work engagement (F(3, 1340) = 281.86, p < .001, η2p = 0.39), job satisfaction (F(3, 1340) = 238.20, p < .001, η2p = 0.35), and turnover intention (F(3, 1340) = 129.35, p < .001, η2p = 0.23). Post hoc pairwise comparisons indicated that the Low PsyCap profile had the lowest levels of work engagement and job satisfaction and the highest levels of turnover intention, followed by the Low/Moderate PsyCap profile and High/Moderate PsyCap profile, while the High PsyCap profile had the highest levels of work engagement and job satisfaction and the lowest levels of turnover intention.
Discussion
Findings and implications
In the current research, we conducted two studies to extend the understanding of Chinese employees’ PsyCap. Specifically, Study 1 systematically evaluated the psychometric properties of the PCQ-12 among Chinese employees, and comparisons were made with the PCQ-24. Study 2 used the PCQ-12 validated in Study 1 to measure PsyCap and adopted a person-centered analytic approach to investigate latent profiles of Chinese employees’ PsyCap. In addition, we investigated how these profiles differ in terms of employees’ demographics and work outcomes. The main findings and implications are elaborated as follows.
First, the PCQ-12 was proven to be a valid tool for measuring PsyCap among Chinese employees. For example, the PCQ-12 has adequate reliability. Specifically, Cronbach's αs of the total PsyCap and its four subscales were all greater than the minimal acceptable 0.70 level (Leary, 2008), indicating the good internal consistency reliability of the PCQ-12. In addition, test-retest reliabilities over a month were significant and ranged from 0.54 to 0.68, demonstrating the state-like nature of PsyCap (Luthans et al., 2007a). Regarding construct validity, our results supported the second-order four-factor model of the PCQ-12, which confirms Luthans et al.'s (2007a) theory of PsyCap as an underlying common resource of the four dimensions, that is, self-efficacy, optimism, hope, and resilience. However, the model fit of the PCQ-24 was worse than that of the PCQ-12 and unacceptable. This finding is consistent with that of Rice et al.'s (2021) study, which also revealed that the model fit of the PCQ-12 was superior to that of the PCQ-24 for both Chilean and US workers. Notably, the poor fit of the PCQ-24 may be due to the reverse-coded items. In fact, in our supplementary analysis, when we deleted the three reverse-coded items and conducted CFA with the remaining 21 items, we found that the fit of the second-order four-factor model was also acceptable (CFI = 0.91, RMSEA = 0.08, SRMR = 0.05), but still worse than that of the PCQ-12, suggesting that the PCQ-12 could be used over the PCQ-24 to measure individuals’ PsyCap in most cases. Furthermore, our results demonstrated that although the four factors of the PCQ-12 convergently represent PsyCap, they are distinct (discriminant). Moreover, the PCQ-12 has sufficient criterion validity with its total score significantly predicting employees’ work attitudes and behaviors (e.g., work engagement, job burnout, job satisfaction, turnover intention, OCB, and voice) after two months. In summary, the PCQ-12 is superior to the PCQ-24 and can be used to measure employees’ PsyCap in China.
Second, by adopting a person-centered approach, we identified four quantitatively distinct PsyCap profiles with the four components of PsyCap at similar levels, that is, low, low/moderate, high/moderate, and high. We noticed that more than half (55.00%) of the Chinese employees belonged to the High/Moderate PsyCap profile, and nearly a quarter (14.16%) belonged to the High PsyCap profile, indicating that most employees in China have relatively high PsyCap. This result is similar to the finding of Djourova et al. (2019), who also found that most Spanish employees (88.47%) were classified in the High PsyCap profile with high scores on all four components of PsyCap. Regarding the differences in the four PsyCap profiles in terms of work outcomes, the High PsyCap profile had the highest levels of work engagement and job satisfaction and the lowest levels of turnover intention, which is consistent with the findings of previous studies. For example, Bouckenooghe et al. (2019) reported that employees with a high PsyCap profile had the highest levels of work engagement and job performance, and Djourova et al. (2019) revealed that employees with a high PsyCap profile had the highest levels of job satisfaction and OCB. These findings emphasize the synergistic effects of the four components of PsyCap on work outcomes and the importance of promoting PsyCap, especially among employees in Low PsyCap profile, to improve their performance at work.
Unexpectedly, we did not find any qualitatively distinct PsyCap profiles (i.e., low levels of some components and high levels of others), which is different from the results of some previous studies (Ferradás et al., 2019; Djourova et al., 2019). For example, Djourova et al. (2019), in their study of Spanish employees, revealed three qualitatively distinct PsyCap profiles representing a combination of high and low levels across the four components. In contrast, we found only four quantitatively distinct PsyCap profiles with the four components at similar levels, which may be related to Chinese culture, especially the Confucian philosophy. Specifically, Confucian teachings emphasize the cultivation of virtues and the pursuit of balance in all aspects of life. This emphasis on balance may translate into individuals seeking equilibrium in their PsyCap components, leading to similar levels across profiles. However, it is noteworthy that most of the samples in these previous studies belong to profiles that have similar levels on the four components, which supports the notion that the four components reinforce one another as indicators of PsyCap and that their communalities are greater than their differences (Luthans et al., 2007a; Luthans & Youssef-Morgan, 2017). In addition, we found that the effects of these quantitatively distinct PsyCap profiles on work outcomes vary with their synchronous levels on the four components, indicating that the combination of all four PsyCap components has a stronger relationship with work outcomes, which further provides evidence in favor of the composite PsyCap score (Djourova et al., 2019) and answers Dawkins et al.’s (2013) call to validate the use of the composite score.
The above findings have some evidence-based implications for managerial practice. First, the validated PCQ-12 in our study enables companies to have a more convenient and accurate assessment of their employees’ PsyCap so that they can evaluate the effectiveness of PysCap intervention more rigorously. Second, the use of latent profile analysis to divide employees into four different subgroups can help managers design and carry out differentiated interventions to improve their PsyCap and their performance at work. Specifically, employees in the High PsyCap profile can be provided with more job challenges and opportunities to strengthen their psychological capacities. They may also be encouraged to be role models for other types of employees so that the overall level of PsyCap in the organization can be improved. In contrast, employees in the Low PsyCap profile generally have low self-efficacy and are pessimistic about their development in the organization. For these employees, managers can provide them with more care, support, and PsyCap training to help them become self-confident, optimistic, hopeful, and resilient at work. Due to the state-like nature of PsyCap (Luthans et al., 2007a), employees in the High/Moderate PsyCap profile and the Low/Moderate profile can turn to the High PsyCap profile or the Low PsyCap profile. Accordingly, managers can adjust the organizational structure to shorten the distance between superiors and subordinates and establish a democratic, open, and positive work atmosphere in which employees can exert and develop their strengths as well as overcome their weaknesses so that they can turn to a better PsyCap profile.
In our research, we also examined the relationship between belonging to a certain profile and demographic variables. The results revealed that people with lower education and job position were more likely to belong to the Low PsyCap or Low/Moderate PsyCap profile, which had lower levels of work engagement and job satisfaction and higher levels of turnover, while males with higher position were more likely to belong to the High PsyCap profile. These findings suggest that more attention should be given to employees with low education and job positions to improve their PsyCap, thus leading to favorable work outcomes.
There are several limitations in the current research. First, our research seems somewhat exploratory, particularly Study 2. Given that the profiles identified by previous studies in two other countries are heterogeneous and no studies have adopted a person-centered approach to investigating Chinese employees’ PsyCap, we lack guidelines to propose specific hypotheses regarding the potential PsyCap profiles of Chinese employees (Bouckenooghe et al., 2019; Morin et al., 2011, 2018). Future research could be grounded in our findings, prior studies, and some reasonable theories, such as the COR theory (Hobfoll, 1989, 2002), to hypothesize the existence of PsyCap profiles that may show qualitative or quantitative differences in the combination of the four components (Bouckenooghe et al., 2019). Another limitation is that we identified only four quantitatively distinct PsyCap profiles, indicating that the additional value of adopting a person-centered approach is limited (Marsh et al., 2009; Pastor et al., 2007). However, this may also suggest that previous PsyCap studies that adopted a variable-centered approach are sufficient to explain the composite effects of the four components, and the traditional psychological capital intervention (PCI; Dello Russo & Stoykova, 2015; Luthans et al., 2006), which aims to improve PsyCap from its four components, is reasonable and can be further used in managerial practice. Despite this, we still encourage future studies to replicate our findings in other samples or contexts.
Conclusion
By conducting two studies, we investigated the measurement and profiles of PsyCap among Chinese employees. Specifically, the PCQ-12 was confirmed to be a reliable and valid tool for measuring Chinese employees’ PsyCap and superior to the PCQ-24. The validation of the PsyCap measurement not only develops and enriches the existing PsyCap literature but also enables organizations to more accurately assess their employees’ PsyCap so that the need for and effectiveness of PsyCap intervention can be evaluated more rigorously. In addition, by adopting a person-centered approach, we identified four quantitatively distinct PsyCap profiles with the four components of PsyCap at similar levels, that is, low, low/moderate, high/moderate, and high; these profiles significantly differ in work outcomes, with employees in the High PsyCap profile exhibiting the highest levels of work engagement and job satisfaction and the lowest levels of turnover intention, while employees in the Low PsyCap profile exhibit the opposite. Furthermore, we found that the majority of the sample belonged to high or high/moderate PsyCap profiles, indicating that employees in China have relatively high PsyCap, which further leads to more favorable work outcomes. These quantitatively distinct PsyCap profiles support the unitary structure of PsyCap with its four components converging into an underlying positive capacity and emphasize the synergistic effects of the four components on work outcomes; to a certain extent, these findings can inform the current debate over PsyCap and extend our understanding of employees’ PsyCap in Chinese culture, thus shedding light on managerial practices for evaluating and enhancing employees’ PsyCap in China.
Footnotes
Data availability
Declaration of conflicting interests
The authors declared no potential conflicts of interest with respect to the research, authorship, and/or publication of this article.
Ethical approval
The study was approved by the ethics committee of Institute of Psychology, Chinese Academy of Sciences (no. H22061). All procedures performed in studies involving human participants were in accordance with the ethical standards of the institutional and/or national research committee and with the 1964 Helsinki Declaration and its later amendments or comparable ethical standards.
Funding
The authors disclosed receipt of the following financial support for the research, authorship, and/or publication of this article: This work was supported by the National Natural Science Foundation of China (grant number 71672186).
Informed consent
All the participants included in the study were informed of the purpose of the study, and assured that the survey was anonymous and their responses would be kept confidential. They clicked “I agree” before answering the formal questionnaire.