
Abstract
To further understand the validity and generalizability of grit, this research investigated the psychometric properties of the Grit Scale in both individualistic (i.e., the US) and collectivistic (i.e., the Chinese) populations. Moreover, this research broadened the contributions of grit to vocational outcomes and showed that grit might be essential to success in other life domains beyond the academic context. Specifically, this cross-cultural research reported two studies that examined the conceptualization of grit proposed by Duckworth et al. (2007) and the concurrent validity of grit to vocational outcomes. Study 1 explored the factor structure of grit in a US general sample (N = 2140) and a US college student sample (N = 1935). Study 2 examined the factor structure of grit in a Chinese employee sample (N = 675) and explored its concurrent validity to occupational well-being and proactive work behavior. Results showed that the bifactor model of grit scale fit best in both the US and Chinese samples. The high omega reliabilities indicated that the general grit score and its two subscales (i.e., perseverance of effort and consistency of interests) could be considered reliable. However, the multiple-group CFA measurement invariance test showed that only partial metric invariance for the perseverance of effort factor was verified across the three samples. Perseverance of effort explained more variance in vocational outcomes than the consistency of interests did among Chinese employees. The findings verified the multidimensionality of the Grit Scale and indicated that the relationships between the two facets of grit and vocational outcomes should be separately investigated.
Introduction
The construct of “grit” refers to perseverance and passion for long-term goals and was defined as a high-order construct with two lower-order features: perseverance of effort (POE) and consistency of interests (COI; Duckworth et al., 2007). POE refers to an individual's tendency to work hard in the face of setbacks or obstacles, while COI is the tendency not to change goals and interests frequently (Duckworth et al., 2007). These dual tendencies emerged in interviews with high achievers across a range of physical and intellectual domains (Duckworth et al., 2007), and they are distinct but also related to each other (Duckworth et al., 2021). They both describe dispositions toward long-term goals that take months and years to complete. The two grit facets were distinguishable in that POE had more overlap with conscientiousness and corresponded with goal striving, whereas COI reflects long-lasting goal commitment.
Since being introduced, grit has gained a wide application to understand success and achievement not only because it is deemed as successful as cognitive ability and personality in predicting performance (Duckworth, 2013), but also because grit is more liable to be influenced by intervention than other antecedents of success such as cognitive ability and socioeconomic status (Duckworth & Gross, 2014). The original Grit Scale (Duckworth et al., 2007) and the Short Grit Scale (Duckworth & Quinn, 2009) have been examined for their structural validity in different cultures (e.g., Disabato et al., 2019) and shown to be valid in predicting emotional or performance outcomes (e.g., Bowman et al., 2015). Despite the widespread enthusiasm for grit as a potentially novel contributor to success, there are still several issues that need to be further addressed.
First, although Duckworth et al. (2007) have reported grit as a single construct with two subscales and empirical studies have tested the two-order factor with confirmatory factor analyses (CFA; e.g., Duckworth & Quinn, 2009; Wolters & Hussain, 2015), most research on grit only reported findings about the overall grit (e.g., Lee & Ha, 2022). To determine whether an overall grit score is enough or whether the POE and COI should be reported separately, more evidence about the structural validity of grit is needed.
In addition, there is a mathematical problem regarding the higher-order factor model with only two subscales (Muenks et al., 2017). A higher-order factor model with two lower-order factors is mathematically equivalent to a “two correlated first-order factors” model with no higher-order factor (Schmid & Leiman, 1957). Thus, a higher-order factor model is not the best model to test whether grit's two subscales make up a single and cohesive construct. Instead, a bifactor model of grit, in which one underlying factor is posited, and two subscales capture the residual dependencies among the items (e.g., Holzinger & Swineford, 1937), is more appropriate.
Second, researchers have not yet systematically examined whether grit's factor structure is invariant across different populations or cultural groups. The conceptualization of grit is embedded in specific values and beliefs (Duckworth et al., 2007), thus the factor structure of grit may differ in different cultures. Measurement invariance among different populations is the prerequisite for comparing studies across culture groups (Byrne & Watkins, 2003). Therefore, deconstructing grit factor structure in diverse cultures is substantial in providing a deep understanding of the validity and generalizability of grit and supporting valuable cross-cultural collaboration projects that help to identify interesting similarities and differences across countries. To further address the cross-culture structural difference in the Grit Scale, in light of Hofstede's (2001) cultural framework with individualistic or collectivistic orientation, the present research chooses the USA as the representative of an individualistic culture and China as the representative of a collectivistic culture.
The USA is an individualistic culture that encourages the independence of self from others and values personal accomplishments (Triandis et al., 1988). China is a typical collectivistic country that adopts the Confucian doctrine as the primary ideological system, which values interdependence and harmonious social interactions (Cheung et al., 2001). Such cultural differences may contribute to the distinct structures of grit in US and Chinese samples. Specifically, POE was highlighted as the key to success and shown to contribute to adaptive outcomes in both individualistic (e.g., Meriac et al., 2015) and collectivistic cultural contexts (e.g., Li et al., 2018). However, besides the function of achieving success like in individualistic (e.g., US) cultures, “perseverance also has a strong moral significance” (Li, 2004, 2006) in showing individuals’ “fulfillment of their moral obligation to their parents” (Salili, 1996), as in the Chinese context. Indeed, studies showed that the predictive effect of perseverance on achievement was stronger in East Asian samples compared with Western samples (e.g., Xu et al., 2021).
As for COI, cultural influence is more notable. In the USA, remaining steadfastly committed to a goal fits the values of personal autonomy and pursuing self-set goals. Indeed, studies suggested that individuals within the Western context are encouraged to pursue their interests (e.g., Chen, 2021). In contrast, individuals in collectivist cultures are supposed to prioritize the group goals and they might adopt their goals according to the needs of significant social groups (e.g., choosing a certain career to honor the family; Datu et al., 2016). In other words, COI might not always be adaptive in a collectivist setting. This was supported by recent findings that COI was not related to subjective well-being in the Chinese context (e.g., Li & Lee, 2020). Therefore, unlike in the US context where POE and COI might have similar contributions to the grit construct, we expected that in the Chinese setting, POE should be a more predominant component than COI in the bifactor model of grit.
Third, empirical evidence about predictions of grit on individual success outcomes mostly focused on student samples, and other populations have often been overlooked. However, as pointed out by Duckworth (2016), grit should be not only an important predictor in academic settings, but also a valuable predictor in other settings such as the workplace. Given the long working duration and inevitable setbacks in the workplace, being persevering and passionate in pursuit of long-term goals would allow people to persistently invest more effects in work and benefit their vocational success (Southwick et al., 2019). As a noncognitive trait that is amenable to interventions (Duckworth & Gross, 2014), examining the predictability of grit for vocational outcomes would have more practical implications than studying other cognitive traits (e.g., intelligence). However, a clear understanding of whether grit contributes to vocational outcomes is still lacking (e.g., Southwick et al., 2019; Suzuki et al., 2015).
To address the above questions, our research examined the psychometric properties of the Grit Scale (Duckworth et al., 2007) with two studies. Study 1 aims to (1) test the factor structure of grit in a similar sample as the sample in Duckworth et al. (2007) when developing the Grit Scale, to examine grit structure in its “birthplace,” US culture; (2) use a US student sample to examine grit structure in the academic context; and (3) test measurement invariance among the two US samples. Study 2 (1) examines the factor structure of grit among a Chinese employee sample; (2) tests the measurement invariance models across the three samples; and (3) explores the concurrent validity of grit to vocational outcomes (i.e., occupational well-being and proactive work behavior).
The structural validity of grit scales
Since the Grit Scale (Duckworth et al., 2007) and the Short Grit Scale (Duckworth & Quinn, 2009) have been developed, plenty of empirical studies have examined their structural validity (e.g., Schmidt et al., 2019). In the literature, two-factor structure models of grit were popularly tested with CFA. The typical factor structure model is two first-order factors that load on one second-order factor (e.g., Mullen & Crowe, 2018; Schmidt et al., 2019). For example, Duckworth and Quinn (2009) reported a better CFA model fit of the higher-order model than a single-factor model. Another factor structure is a two-factor model that allows the correlation between the two factors (Fosnacht et al., 2019; Karaman et al., 2019). For example, Fosnacht et al. (2019) reported a CFA model fit of the two-correlated factors model among US undergraduates. However, both the higher-order model or the two-factor model with the factor correlation are inappropriate to test the factor structure of grit (Credé et al., 2017).
Specifically, in order to be statistically identified, a higher-order CFA model without any constraints requires at least three first-order factors (Kline, 2011). Thus, a higher-order factor model is not the best model to test grit's factor structure, which has only two first-order factors. The two-correlated-factor model is also not appropriate to test the multidimensional structure of grit because its assumption is that items reflect only one construct (Disabato et al., 2019). The bifactor model should be used to test the factor structure of grit because its assumption is that items reflect both a broad construct and specific dimensions. The bifactor model also shows whether items are too similar in item content according to item loadings onto group factors (Reise, 2012). This may help to determine whether reporting findings of two grit dimensions separately is needed. To date, there are only a few studies that examined the bifactor structure of grit (e.g., Disabato et al., 2019; Muenks et al., 2017). For example, Muenks et al. (2017) reported a better explanation of the observed item response patterns in the grit's bifactor model than the one-factor and two-factor models among US students. Therefore, more studies examining the possible bifactor structure of grit are much needed.
The grit scales (Duckworth et al., 2007; Duckworth & Quinn, 2009) were adapted and translated into different languages and examined the structure validity in these languages, such as Chinese (Li et al., 2018), German (Fleckenstein et al., 2014), Polish (Wyszyńska et al., 2017), Korean (Kim & Lee, 2015), Japanese (Nishikawa et al., 2015), and Spanish (Arco-Tirado et al., 2018). Nevertheless, few studies have explored the culture invariance of grit's factor structure from a cross-culture perspective. For example, Disabato et al. (2019) have reported the metric variant (i.e., variant factor loadings) structure of the original Grit Scale with participants from six of the seven continents (excluding Antarctica). In a collectivist setting, Datu et al. (2016) found that COI did not load on the second-order grit factor among Philippine students. Accordingly, more cross-cultural comparisons should be conducted to explore the cultural difference in grit's factor structure.
Grit and vocational outcomes
Since grit was proposed by Duckworth and her collaborators (e.g., Duckworth et al., 2007), research investigating grit's influence has mostly been conducted among student samples and focused on educational achievement or other positive outcomes in academic settings (Credé et al., 2017). For example, grit was found to predict students’ academic performance (e.g., Tang et al., 2019), retention (e.g., Prasad et al., 2017), and engagement (e.g., Lan & Moscardino, 2019). Although Duckworth and her collaborators (e.g., Duckworth, 2016; Duckworth et al., 2007) also theoretically highlighted the values of grit in the workplace, a clear understanding of whether grit contributes to occupational outcomes is still lacking (e.g., Suzuki et al., 2015), especially in the collectivistic cultural setting. Rather than focusing on academic achievement in a school background, employees need to overcome a greater range of difficulties and handle a variety of work tasks or challenges. Investigating the association between grit and vocational outcomes may help to broaden the contributions of grit to success and performance and demonstrate the theoretical assumption by Duckworth et al. (2007) that grit might be essential to success in several life domains (e.g., work, school). With a Chinese employee sample, we examined grit's concurrent validity to two vocational outcomes: occupational well-being as the representative of the attitudinal outcome and proactive work behavior as the representative of the behavioral outcome.
Occupational well-being refers to the evaluation of one's working life experiences and was regarded as an important work outcome being examined by numerous researchers (e.g., Ion et al., 2017). People high in grit are more optimistic when they face adversities and setbacks and continue their effects to reach goals, which results in well-being and happiness (Hou et al., 2022). A few authors explored the relationship between grit and job satisfaction and inconsistent results were reported (e.g., Dugan et al., 2019; Ion et al., 2017). For example, in a collectivistic context, Ion et al. (2017) reported a nonsignificant relationship between grit and job satisfaction among Romanian working adults. In the individualistic context, Meriac et al. (2015) found that job satisfaction was positively associated with POE, but not COI among employed American students. Dugan et al. (2019) reported that salespeople higher in POE demonstrated higher levels of job satisfaction (COI was not included in their study) in the USA. In a study of American nurses, Sellers et al. (2019) found that grit was positively associated with job satisfaction and negatively associated with job dissatisfaction. One possible reason for such inconsistency might be the cultural difference. More studies about the relationship between grit and occupational well-being should be conducted in the collectivistic context.
Moreover, a meta-analysis suggested that the effect size of two facets of grit in predicting psychological variables differ, and using the overall grit score might impair the predictive power of this concept (Credé et al., 2017). Especially, given the low correlation between POE and COI in collectivist contexts (Disabato et al., 2019), the relationship between facets of grit and occupational well-being should be reported separately. Previous studies examining the two facets of grit showed that POE has a stronger correlation with well-being-related variables compared to COI (e.g., Bowman et al., 2015; Datu et al., 2016; Meriac et al., 2015). Therefore, we hypothesized that a higher level of POE might be positively associated with occupational well-being, and COI would display a weaker (or even nonsignificant) relationship with occupational well-being compared with POE.
Proactive work behavior refers to individuals’ self-directed actions to initiate change in the work system or work roles (Griffin et al., 2007). In the field of work performance, researchers increasingly recognized the importance of studying employees’ proactive work behavior because of the dynamic nature of contemporary organizations (Parker et al., 2019). Gritty individuals might proactively engage in work-changing behaviors. Specifically, individuals with high POE may incline to develop work-related goal hierarchies and view negative feedback as challenges, which prompts them to allocate resources for task modification and engage in proactive adaptation (Jordan et al., 2019). With high COI, individuals would have long-lasting goal commitment (Duckworth et al., 2021) and are more likely to engage longer in the deliberate practice of proactive behaviors (Clements & Kamau, 2018). A few articles reported that grit could predict employees’ proactive work behavior. For example, with a sample of Pakistani public sector employees, Nisar et al. (2020) reported that grit positively predicted voice behavior. Among Korean medical center employees, Hyun (2020) found that higher grit was associated with more job-crafting behaviors. Accordingly, we hypothesized that a higher level of grit might be positively associated with proactive work behavior.
Study 1
Study 1 sought (1) to examine grit structure both in a general US sample and in its frequently used field, the academic context, and (2) to test measurement invariance among the two US samples. Toward that end, we first test the factor structure of grit in a similar sample as that found in Duckworth et al. (2007) when developing the Grit Scale. Gender invariance was also examined. We then used a US student sample to investigate grit structure in the academic context, as well as tested measurement invariance among the two US samples. Of particular interest was whether the bifactor structure of grit showed the best fit in both samples so that the view that “the two subscales of grit make up a single and cohesive construct” (Duckworth et al., 2007) could be supported.
Methods
Participants and procedure
Measures
The 12-item original Grit Scale (Duckworth et al., 2007) was used to measure participants' grit on a 5-point Likert scale (1 = not like me at all, 5 = very much like me). This scale comprises two subscales, each having six items. Six items describe the COI subscale (e.g., “New ideas and projects sometimes distract me from previous ones” [reverse scored]) and the other six items describe the POE subscale (e.g., “Setbacks don't discourage me”). To make the COI score consistent with the direction of interest consistency (i.e., higher COI scores mean higher tendencies to maintain interest), item values were reversed for items of the COI subscale.
Data analysis
The values of skewness and kurtosis for all items ranged from −1.28 to .22 and from −1.09 to 1.05 for sample 1; and ranged from −1.42 to .24 and from −0.92 to 3.12 for sample 2, respectively (see Appendix 1). The values indicated that all items had a normal distribution (Kline, 1998). CFA was conducted to examine the factor structure of the Grit Scale using Mplus (version 7.4). Maximum likelihood (ML) estimation was used to test the CFA models. Missing data were handled using full information maximum likelihood (FIML) estimation. Evaluation of model fit was based on the comparative fit index (CFI), the root mean square error of approximation (RMSEA), and the standardized root mean squared residual (SRMR). For good model–data fit criteria, we used the following guidelines: CFI ≥.95 (Hu & Bentler, 1999), RMSEA ≤.08 (Browne & Cudeck, 1993), SRMR ≤.08 (Hu & Bentler, 1999). The acceptable model–data fit criteria for CFI ≥.90 was adopted (Hu & Bentler, 1999).
Multiple-group CFA measurement invariance across the two samples and gender (only in Sample 1) was then tested using the ML estimator. Three types of measurement invariance were tested: configural invariance (equality for form), metric invariance (equality for factor loadings), and scalar invariance (equality for intercepts). Because χ2 is sensitive to sample size, when conducting model comparisons, other metrics should be used in conjunction with χ2 (Chen, 2007). Specifically, at least two of the following three criteria had to be matched to determine significant differences between these two models: Δχ2 significant at p <.05, ΔCFI ≥.01, and ΔRMSEA ≥.015 (Negru-Subtirica et al., 2015).
Results
Confirmatory factor analysis
To assess the factor structure of the Grit Scale, we estimated four different models by CFA for each sample: (a) a one-factor model in which all items load onto a single factor; (b) a two uncorrelated-factor model in which items from each grit dimension loading only onto their respective factor, and set the correlation of two factors to zero; (c) a “two correlated-factor” model in which items from each grit dimension loading only onto their respective factor, and allowed the two factors to correlate; and (d) a bifactor model in which items loadings as in the two-factor model, plus a general factor with loadings on all items. Correlations among the general factor and two factors were constrained to zero. To identify the bifactor model, the variances of the general factor and two factors were fixed to one.
The fit indices for each of these models are summarized in Table 1. For Sample 1, the one-factor model, two-uncorrelated-factor model, and two-correlated-factor model fit the data poorly, and thus were rejected. The bifactor model fit the data well and was selected as the final model. For Sample 2, the one-factor model, two-uncorrelated-factor model, and two-correlated-factor model fit the data poorly. The bifactor model displayed an acceptable model fit and thus was kept as the final model. Figure 1 presents the factor loadings for the bifactor CFA models.
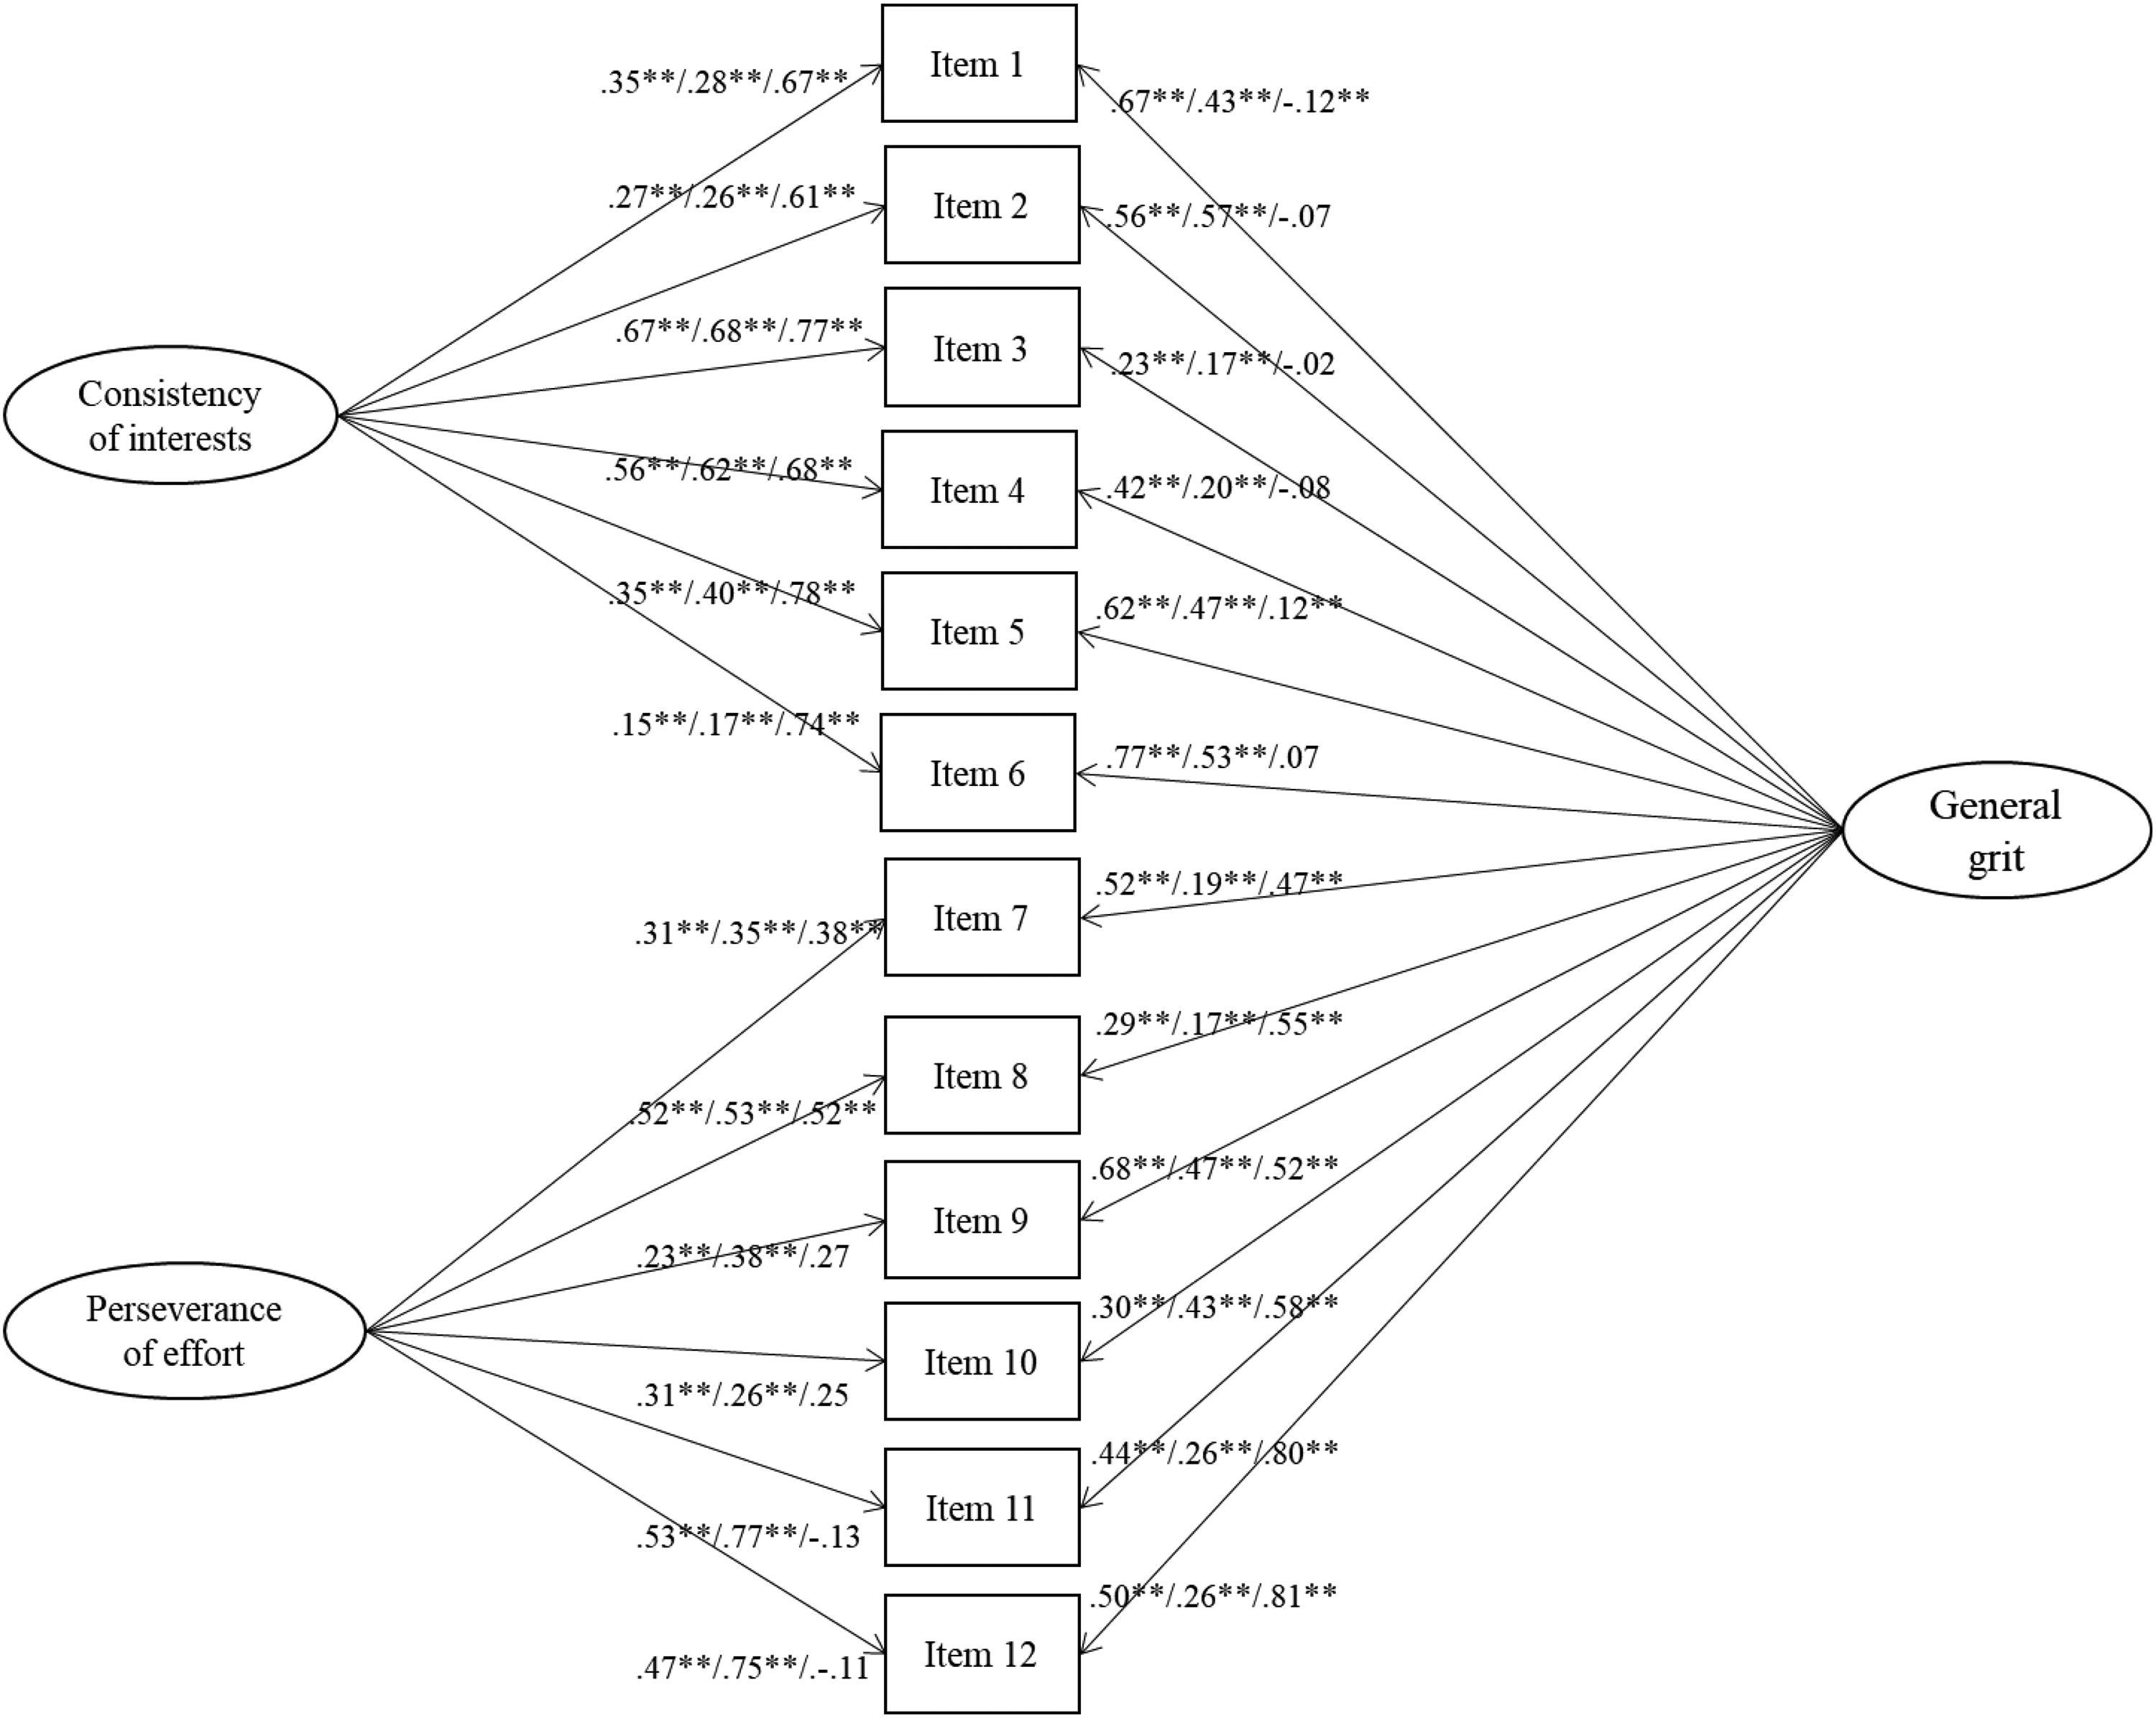
Factor loadings of grit bifactor model in the US and Chinese samples.
Fit statistics of alternative grit inventory measurement models.
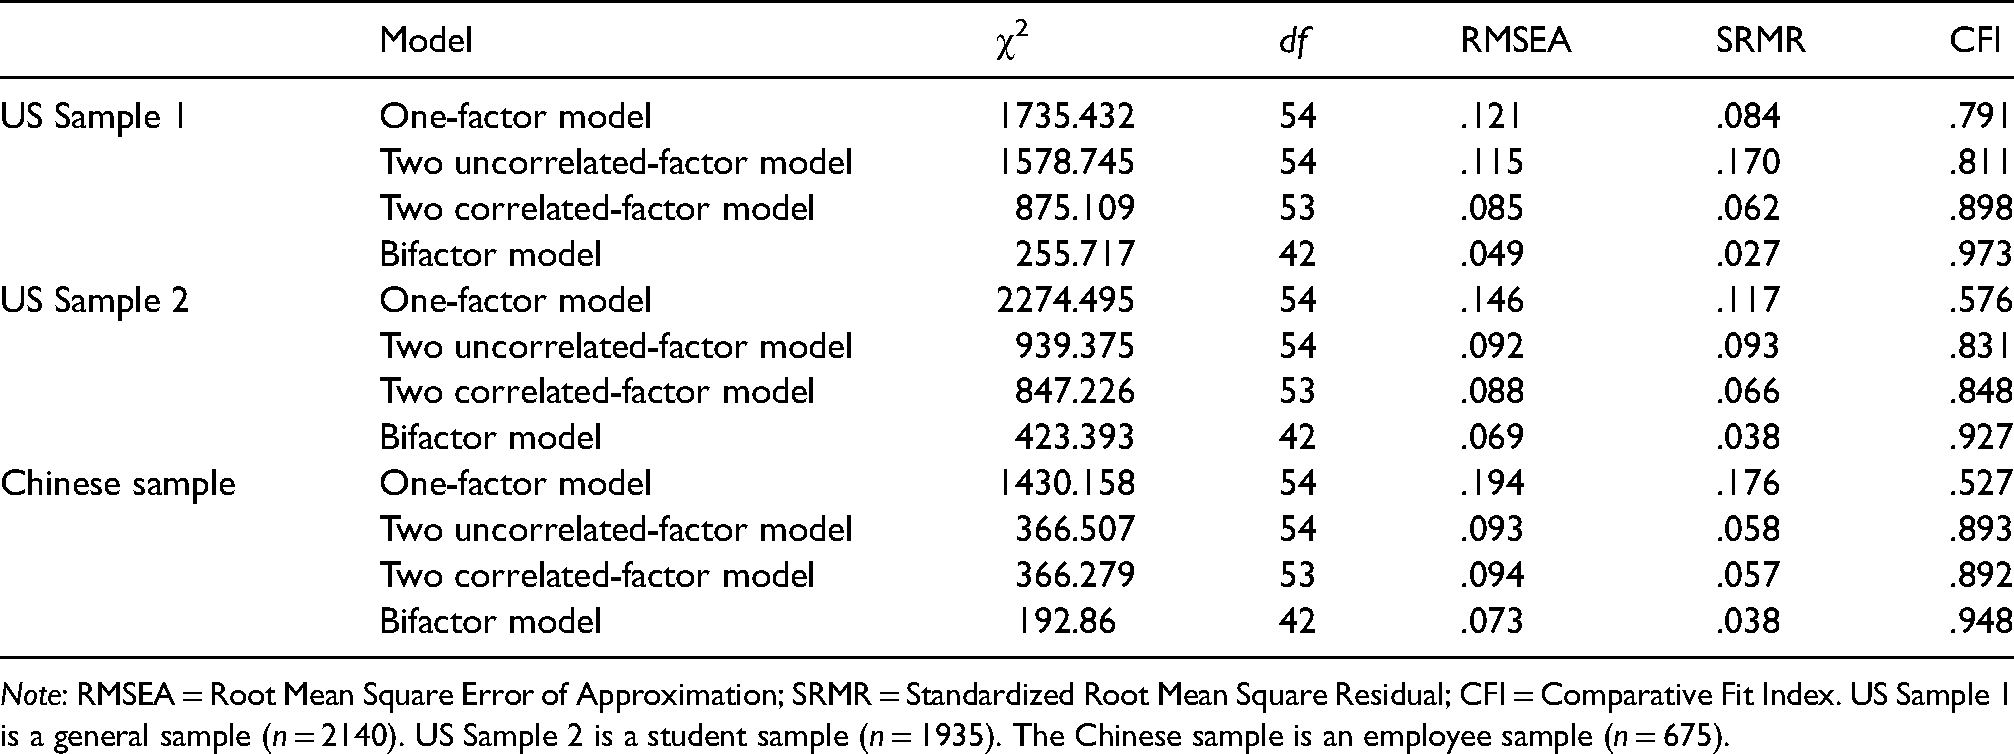
Note: RMSEA = Root Mean Square Error of Approximation; SRMR = Standardized Root Mean Square Residual; CFI = Comparative Fit Index. US Sample 1 is a general sample (n = 2140). US Sample 2 is a student sample (n = 1935). The Chinese sample is an employee sample (n = 675).
In Sample 1, the general grit factor explained 27.6% of the total variance, while the specific COI and specific POE factors explained 9.2% and 8.5% of the total variance, respectively. The general (specific) explained common variance (ECV), which indicates the percentage of common variance attributable to the general (specific) factor, was also computed. The general grit factor explained 61% of the common variance. When only the COI items were considered, the specific COI factor accounted for 20.3% of the common variance, whereas the specific POE factor explained 18.7% of this common variance with regard to the POE items. These results indicated that although over half of the common variance was accounted for by the general grit factor, a general ECV value that is lower than .70 suggested a multidimensional structure of the Grit Scale and the subscale scores may have value (Quinn, 2014).
In Sample 2, the general grit factor explained 14% of the total variance, while the specific COI and specific POE factors explained 9.9% and 14.8% of the total variance, respectively. The general grit factor explained 36.2% of the common variance. When only the COI items were considered, the specific COI factor accounted for 25.5% of the common variance, whereas the specific POE factor explained 38.3% of this common variance regarding the POE items. These results indicated that less than half of the common variance was accounted for by the general grit factor, suggesting a multidimensional structure of the Grit Scale and the scores of two subscales may be valuable.
Reliability
Given that Cronbach's alpha coefficient assumes all consistent variability is true score variance from a single construct, it is thus inappropriate to use it as the reliability index for a bifactor model in which consistent variance is contributed by both general and domain-specific factors (Yang & Green, 2011). To obtain a better gauge of reliability, the omega (omega subscale) that estimates the reliability of a latent factor by combining the general and specific factor variance, and the omega hierarchical (omega hierarchical subscale) that estimates the reliability of a latent factor with all other latent construct variance removed (Rodriguez et al., 2016), were computed using the Omega software (Watkins, 2013).
In Sample 1, the omega reliability estimate for the total score was a strong .88, whereas the omega hierarchical was lower (.67), suggesting that multidimensionality complicates the interpretation of the total score. The omega subscale for COI and POE were .85 and .78, respectively, suggesting the two subscale scores could be considered reliable. The omega hierarchical subscale for COI and POE were .29 and .34, respectively, suggesting that the two subscales provide 34.1% (.29/.85) and 43.6% (.34/.78) unique variance of the corresponding items, respectively.
In Sample 2, the omega reliability estimate for the total score was a strong .81, whereas the omega hierarchical was lower (.43), suggesting that multidimensionality complicates the interpretation of the total score. The omega subscale for COI and POE are .75 and .78, respectively, suggesting the two subscale scores could be considered reliable. The omega hierarchical subscale for COI was .38, indicating that this factor accounted for 50.7% (.38/.75) variance of the items under this subscale. The omega hierarchical subscale for POE was .58, suggesting that this subscale provides unique and reliable variance (.58/.78 = 74.4%), and little variation on this trait was attributed to the general factor (1 − .58/.78 = 25.6%).
Measurement invariance across the two US samples and gender
The measurement invariance test was then conducted to examine whether the bifactor structure of grit was identical between the two US samples and between males (N = 682) and females (N = 1439) in Sample 1. Because the gender information was missing in Sample 2, a measurement invariance test regarding gender was not conducted. As shown in Table 2, a configural model of two US samples showed good model fit, thereby suggesting configural invariance across the two samples. The metric invariance model showed a worse model fit than the configural model, suggesting metric variance across the two samples. Therefore, we test the partial metric invariance models for general (equality for item loadings under general factors) and specific factors (equality for item loadings under POE and COI factors) separately and did not test the scalar invariance model. Results indicated that the partial metric invariance model for the general factor fit worse than the configural invariance model. The partial metric invariance model for the specific factors (see Appendix 2) did not fit worse than the configural invariance model and was thus adopted as the final partial metric invariance model across the two samples.
Measurement invariance tests of grit scale across samples and gender.

Note: POE = perseverance of effort; COI = consistency of interests; RMSEA = Root Mean Square Error of Approximation; SRMR = Standardized Root Mean Square Residual; CFI = Comparative Fit Index. a ΔCFI or ΔRMSEA higher than cutoffs.
*p <.05. **p <.01.
The configural model of gender in Sample 1 showed good model fit, thereby suggesting configural invariance across gender. The metric invariance model did not show a worse model fit compared with the configural model, suggesting metric invariance across gender. The scalar invariance model showed a good model fit and did not fit worse than the metric invariance model, suggesting scalar invariance for the bifactor model across gender.
Discussion
Study 1 tested the factor structure of the original Grit Scale (Duckworth et al., 2007) and investigated whether grit is a single construct with two dimensions. The CFA showed that the bifactor model fit the observed data best in the two US samples. Such factor analysis results provide further evidence for the multidimensionality of grit and suggest using both the subscale scores and the total score. This result was consistent with previous studies that showed bifactor models fit the data best among one-factor and two-factor models (e.g., Disabato et al., 2019; Muenks et al., 2017). For example, Muenks et al. (2017) found that for US college students, grit has a bifactor structure. Disabato et al. (2019) also reported the multidimensionality of grit in individualistic countries.
Duckworth and her collaborators (e.g., Duckworth et al., 2007; Duckworth & Quinn, 2009) suggested developing a Short Grit Scale because the model fit of the original Grit Scale is poor. However, like other existing studies (e.g., Disabato et al., 2019; Muenks et al., 2017), the present study suggested that the original Grit Scale has a good model fit with a bifactor model. In addition, results showed that in both the US samples, items 3 and 4 have higher loading on COI than on general grit, and items 8 and 11 have higher loading on POE than on general grit, which suggested that those items are good representatives for the specific factors. However, both items 3 and 4 were excluded from the COI, and item 8 was excluded from the POE by the Short Grit Scale (Duckworth & Quinn, 2009). Therefore, given the multidimensionality of grit, whether the items in the Short Grit Scale could measure the unique subfactors should be reconsidered.
Study 2
Study 2 sought to examine (1) the factor structure of grit within a collectivistic context, (2) the measurement invariance of grit scale across the individualistic and collectivistic contexts, and (3) the concurrent validity of grit to success in the vocational domain. Toward that end, we first tested the factor structure of grit among a Chinese employee sample and examined the measurement invariance across the Chinese and US samples. We then tested the relationships between grit and attitudinal outcome (i.e., occupational well-being) and behavioral outcome (i.e., proactive work behavior) in the vocational domain.
Method
Participants and procedure
The University Research Ethics Committee does not require a formal ethical review for this study, because the participants are adults, the data are completely anonymous, the topic being researched is not likely to disturb participants, and there is no risk of possible disclosures. Informed consent was given by clicking on the link to start the research and participants were informed that they could withdraw from the study at any time. Participants in the current study consisted of 675 Chinese employees (47.3% female; Mage = 27.67 years; SDage = 6.91) who voluntarily completed the online self-report questionnaires in Chinese. The employees were recruited from Chinese commercial companies in Shanghai and Beijing, China, by the Wenjuanxing online platform. Upon completing the questionnaire, each participant received a remuneration of RMB 20. Most of the participants had secondary education or higher (86.8%). Expect for two people who did not report their ages, none of the variables included missing data. The data are available from the corresponding author upon reasonable request.
Measurement
Data analysis
The values of skewness and kurtosis for all variables (12 grit items, occupational well-being, and proactive work behavior) ranged from −.95 to .50 and from −1.06 to 2.29, respectively. The values indicated that all research variables had a normal distribution (Kline, 1998). Confirmatory factor analyses were conducted to examine the factor structure of the Grit Scale using Mplus (Version 7.4). ML was used to test the CFA models. Evaluation of model fit was based on the CFI, RMSEA, and SRMR. Hierarchical regression models were then conducted to explore the influence of grit on organizational well-being and proactive work behavior. In terms of common method bias (CMB), Harman's single factor was used to test the potential limitation of self-reported grit, occupational well-being, and proactive work behavior. The total variance for a single factor was 24.42%, suggesting an acceptable rate lower than 50% (Podsakoff et al., 2003).
Results
Confirmatory factor analysis
To assess the factor structure of the Grit Scale (Duckworth et al., 2007), we estimated the same four-factor models as in Study 1 by CFA: one-factor, two-uncorrelated-factor model, two-correlated-factor model, and the bifactor model (see Table 1). The fit indices for each of these models were summarized in Table 1. The one-factor model, two-correlated-factor model, and two uncorrelated-factor models fit the data poorly and thus were rejected. The bifactor model fit indices were acceptable, thus the bifactor model was selected among the four CFA models. However, a close look at the factor loading shows that items 9, 10, 11, and 12 onto POE were nonsignificant, suggesting that these more directly inform a general factor. Factor loadings of items 2, 3, 4, and 6 onto the general factor were nonsignificant. Interestingly, item 1 had negative loadings on the general factor, but positive loadings on the specific COI factor, which may be due to a strong relationship with the COI factor. Such a case was also reported by other studies of bifactor factor models (e.g., Denovan & Dagnall, 2019; Yang et al., 2013). Figure 1 presents the factor loadings for the bifactor model.
The general grit factor explained 20.6% of the total variance, while the specific COI and specific POE factors explained 25.3% and 4.8% of the total variance, respectively. The general grit factor explained 40.6% of the common variance. When only the COI items were considered, the specific COI factor accounted for 49.8% of the common variance, whereas the specific POE factor explained 9.5% of this common variance regarding the POE items. These results indicated that less than half of the common variance was accounted for by the general grit factor and only a small amount of variance was accounted for by the POE factor.
Reliability
Given that Cronbach's alpha coefficient is based on strict assumptions (e.g., tau-equivalence of all items), omega (omega subscale) and omega hierarchical (omega hierarchical subscale) were computed using the Omega software (Watkins, 2013). The omega reliability estimate for the total score was a strong .85, the omega hierarchical, however, was lower (.34), suggesting that multidimensionality complicates the interpretation of the total score. The omega subscale for COI and POE were .86 and .83, respectively, suggesting the two subscale scores could be considered reliable. The omega hierarchical subscale for COI and POE were .37 and .39, respectively, suggesting that the two subscales provide 43% (.37/.86) and 47% (.39/.83) unique variance of the corresponding items, respectively.
Measurement invariance across gender and culture
The measurement invariance test was then conducted to examine whether the bifactor factor structure of grit was identical between males (N = 356) and females (N = 319). As shown in Table 2, the configural model of gender showed an acceptable model fit. The metric invariance model showed an acceptable model fit and did not fit worse than the configural model, suggesting metric invariance across gender. The scalar invariance model also showed an acceptable model fit and did not fit worse than the metric invariance model, suggesting intercept invariance for the bifactor model across gender.
The measurement invariance test was then conducted to examine whether the bifactor structure of grit was identical between the two US samples and the Chinese sample. The configural model of the three samples showed a good model fit, suggesting the pattern of loadings of items on the latent factor invariant in the two cultures. Because only the partial metric invariance model was verified across the two US samples, possible partial metric invariance models for general and specific factors were then tested across the three samples separately. Results indicated that both the partial metric invariance model for the general factor and specific factors fit worse than the configural invariance model. Because the partial metric invariance model for specific factors fit the data better than the partial metric invariance model for the general factor, we then tested the partial metric invariance models for POE and COI factors separately. Results indicated that both the partial metric invariance models for POE and COI factors did not fit worse than the configural invariance model. AIC and sample size-adjusted BIC values suggested that the partial metric invariance model for POE factor (AIC = 147749.50, adjusted BIC = 148183.55) provided a better fit to the data than the partial metric invariance model for COI factor (AIC = 147757.51, adjusted BIC = 148191.56). Therefore, the partial metric invariance model for the POE factor (see Appendix 3) was adopted as the final partial metric invariance model across three samples.
Concurrent validity
After confirming the reliability of grit facet scores, the concurrent validity of each vocational success indicator (i.e., occupational well-being and proactive work behavior) was tested. The descriptive statistics and correlations among research variables were presented in Table 3. POE displayed a nonsignificant correlation with COI, a medium correlation with general grit and proactive work behavior, and small correlations with occupational pleasure and displeasure. COI displayed a high correlation with general grit and small correlations with occupational displeasure and proactive work behavior. General grit displayed small correlations with occupational pleasure and displeasure and proactive work behavior.
Descriptive statistics and correlations among the measured variables in the Chinese sample (n = 675).

Note. POE = perseverance of effort; COI = consistency of interests. *p <0.05. **p <0.01.
A series of hierarchical regressions were conducted to determine whether grit predicts vocational success indicators beyond gender and age (see Table 4). Because of the high correlation between general grit and COI score (i.e., .80), to avoid multicollinearity, the general grit was not added to the regression models. Age and gender were entered in the regression model in Step 1, then two factors of grit were added to the regression model. Results showed that POE was positively related to occupational pleasure (β = .26, p <.001) and proactive work behavior (β = .41, p <.001), whereas negatively related to occupational displeasure (β = −.28, p <.001). COI was negatively related to occupational displeasure (β = −.11, p = .003) and proactive work behavior (β = −.12, p = .001). The relationships between POE and vocational success indicators had higher effect sizes (i.e., sr2) than the relationship between COI and vocational success indicators.
Concurrent validity of grit to occupational well-being and proactive work behavior in the Chinese sample.

Note. sr2, squared semi−partial correlations. *p <.05. **p <.01.
Discussion
Like in the US sample, the best-fit model in the Chinese employee sample is the bifactor model. This result suggested that for Chinese employees, as with Duckworth et al.'s (2007) original conceptualization, grit is a single construct with two correlated dimensions. The omega reliability suggested that the total score of the Grit Scale and scores of the two subscales are reliable in the Chinese sample. The four POE items that primarily loaded on the general grit factor indicate that, for the Chinese, “being a harder worker” or “finishing whatever they begin” not only reflects making effects but also means making consistent contributions to their work. The negative loading of item 1 on the general factor could be a result of the crossover suppression effects (Paulhus et al., 2004). Specifically, the prediction of the specific COI factor on item 1 was so strong that it overwhelmed the prediction of the general factor on item 1. These COI items primarily loaded on the specific COI factor indicating that “focusing on certain ideas or projects over time” forms a construct itself, but it did not fit in with what the Chinese believe as being passionate about long-term goals.
Configural invariance suggested that the basic organization of grit is supported in the two cultures. The different factor loadings (i.e., metric noninvariant) of grit in the US and Chinese contexts may indicate a form of cultural difference that participants from different cultures may use different conceptual frames of reference when responding to at least some items of the Grit Scale. Specifically, unlike in the US samples, loadings of COI items on general grit were small or even nonsignificant in the Chinese sample. The results suggested that COI items may fail to capture the characteristics of passion for long-term goals in collectivistic cultures (Disabato et al., 2019). Different from people in individualistic cultures who emphasize personal autonomy and pursuit of self-set goals, people in collectivistic cultures put more emphasis on collective value and would adjust their goals according to significant others or the social context (Datu et al., 2016). Their interest may vary across time depending on the expectations of the context. Therefore, items under the COI dimension that cover the continuous pursuit of self-set goals may fail to incorporate the collectivistic forms of grit.
The nonsignificant relationship between POE and COI may be due to the special characteristics of the Chinese. Specifically, group objectives and interpersonal relationships are highly valued and emphasized in collectivistic countries (Cheung et al., 2011). Individuals may change their interests over time to fulfill their groups' (e.g., organizations, families, or peers) expectations, but they still keep a stronger POE for achieving to group goals. Such a result is also consistent with previous studies focusing on grit structure in collectivist cultures (e.g., Datu et al., 2016). For example, with a sample of Philippine high school students, Datu et al. (2016) found that POE and COI are not correlated. Disabato et al. (2019) also reported the .02 observed correlation between the POE and COI subscale scores among the samples from East and South Asia.
Although an increasing amount of evidence showed that the POE and COI contributed differently (e.g., Credé et al., 2017), those limited previous studies about grit in the workplace mostly examined associations between general grit and career outcomes (e.g., Ion et al., 2017). The present study added evidence for the concurrent validity of POE and COI to vocational success. Results indicated that occupational pleasure was only related to POE, but not to COI, which is consistent with previous studies showing positive links between job satisfaction and POE, but not COI (e.g., Kim et al., 2019). One possible reason that COI showed a nonsignificant relationship with occupational pleasure is the possible moderating effects of obstacles individuals meet in their work. Specifically, when obstacles are manageable, COI might be beneficial for goal achievement and would be related to higher occupational well-being. However, when the obstacles are no longer manageable and when pursuing consistent interests does not seem to pay off, COI would be negatively related to occupational well-being. The findings that both POE and COI were negatively related to occupational displeasure comport with prior studies conducted among employees, such that two facets of grit are negatively linked to stress (Meriac et al., 2015), psychological distress, and burnout syndrome (e.g., Zhong et al., 2018).
In addition, higher POE was found to be associated with more proactive work behavior, whereas higher COI was associated with less proactive work behavior. One possible explanation is that individuals who are consistent with their interests can be deemed to lack novelty-seeking and would display low levels of perceptual curiosity (Disabato et al., 2019) and innovation (Mooradian et al., 2016). Low curiosity prevents individuals from framing the external environment and identifying and exploiting opportunities (Wu et al., 2013), which further decreases proactive work behaviors (e.g., Harrison et al., 2011). In addition, the avoidance of generating and implementing new ideas (i.e., innovation) was thought to be associated with less self-directed initiative behavior in the workplace (i.e., proactive work behavior; Unsworth & Parker, 2003). When individuals who score high in POE set a goal to modify the situation to achieve greater personal or organizational effectiveness, they may initially put in high efforts to attain this goal despite adversity (Duckworth et al., 2007). Indeed, research showed a positive link between POE and the performance of innovation, for example, using new technologies (e.g., Mooradian et al., 2016).
Conclusions, implications, and limitations
To examine the structural validity of the Grit Scale (Duckworth et al., 2007) and explore its cross-cultural invariance in factor structure, four factor-structure models were tested in two US samples and a Chinese employee sample: one-factor model, two-uncorrelated-factor model, two-correlated-factor model, and the bifactor model. The conceptualization of grit proposed by Duckworth et al. (2007) was well supported in the US samples and the Chinese sample with the bifactor model fitting the data best. In addition, the configural invariant and metric variant results were shown between the Chinese sample and the two US samples. Actually, Disabato et al. (2019) did report the culture variance of grit factor loadings across individualistic and collectivistic contexts. Consequently, these findings indicated that the Grit Scale is a metric variant between different cultural samples.
The relationships between two grit facets and occupational well-being and proactive work behavior supported the concurrent validity of grit to vocational outcomes in a Chinese employee sample. In general, consistent with the previous meta-analysis exploring different predictive validities of POE and COI in academic settings (Credé et al., 2017), the present study found that POE accounted for more variance in vocational success than COI did.
The current research had theoretical and empirical contributions. First, our research provided new evidence for the tests of the conceptualization of grit by assessing grit's factor structure with not only the one-factor model and two-factor models, but also the bifactor model, to which little attention has been paid in previous empirical studies (Credé et al., 2017). Second, grit's structural validity in both individualistic and collectivistic populations was tested in this research. The examination of the Grit Scale with a Chinese sample contributes to the call to counter WEIRD science (Henrich et al., 2010) by extending research beyond typical Western European samples. Given that only partial metric invariance for the POE factor was supported across American and Chinese cultures in this research, future cross-cultural research regarding grit or studies that aim to compare grit levels across different cultures are suggested to focus on the POE factor. Third, this research provided evidence for the concurrent validity of grit in the workplace, expanding our understanding of how grit contributes to occupational outcomes. Training programs that cultivate employees’ grit were suggested to be developed.
Some limitations existed in the current research. First, given that researchers have argued the possible conceptual overlap between grit and other constructs, such as conscientiousness (e.g., Ion et al., 2017) and self-control (e.g., Duckworth & Gross, 2014), future work should examine the concurrent and predictive validity of grit over those related constructs. Second, for comparing the cultural variance of grit, the present research examined the factor structure of grit across the US and Chinese settings. However, Chinese participants in this study were from urban areas (i.e., Shanghai and Beijing), which are highly influenced by the globalization process and may show different grit structures for individuals from rural areas. Future studies are suggested to further test the factor structure of grit (including the possible bifactor model) in Chinese rural areas. Moreover, given that most empirical studies about grit were conducted among students (e.g., Credé et al., 2017), it is also worthwhile to explore whether the factor structure of grit varies across educational levels in future studies. Third, although the Harman single-factor test showed that this study was not influenced by common method bias, integrating indicators and triangle reports provided by significant others (e.g., teachers, colleagues, and supervisors) could have strengthened the findings. Finally, based on the metric variant results of grit scale, future studies could revise the grit items (especially items in COI), so that this scale could fit in the specific cultural context.
Footnotes
Acknowledgement
The authors would like to thank Neal Schmitt and Jacob Bradburn for sharing their College Board Project grit data with us for this study.
Author contributions
All authors contributed to the study conception and design. Material preparation and data collection were performed by Frederick T. L. Leong and Weiqiao Fan. Data analysis was performed by Mengting Li. The first draft of the manuscript was written by Mengting Li and all authors commented on previous versions of the manuscript. All authors read and approved the final manuscript.
Data availability statement
The data that support the findings of this study are available from the corresponding author upon reasonable request.
Ethics statement
Study 1 (Sample 2) involving human participants was reviewed and approved by Michigan State University. Participants gave their informed consent before participating in the research and were informed that they could withdraw from the study at any time. The University Research Ethics Committee does not require formal ethical review for Study 2.
Declaration of conflicting interests
The author(s) declared no potential conflicts of interest with respect to the research, authorship, and/or publication of this article.
Funding
The author(s) disclosed receipt of the following financial support for the research, authorship, and/or publication of this article: This work was supported by the National Social Science Fund of China—Education (Grant number no. BIA210175).
Appendix 1
Item descriptive statistics in the US and Chinese samples.

| Subscale | Wording | US Sample 1 | US Sample 2 | Chinese sample | |||||||||
|---|---|---|---|---|---|---|---|---|---|---|---|---|---|
| M | SD | Skew-ness | Kurtosis | M | SD | Skew-ness | Kurtosis | M | SD | Skew-ness | Kurtosis | ||
| Consistency of interests | 1. I often set a goal but later choose to pursue a different one. | 3.07 | 1.19 | −.22 | −.89 | 3.18 | .90 | −.29 | −.19 | 2.67 | 1.08 | .40 | −.70 |
| 2. New ideas and new projects sometimes distract me from previous ones. | 2.47 | 1.13 | .22 | −.87 | 2.73 | .97 | .24 | −.68 | 2.55 | .99 | .50 | −.37 | |
| 3. I become interested in new pursuits every few months. | 2.86 | 1.10 | −.09 | −.77 | 2.88 | .93 | −.05 | −.53 | 2.83 | 1.11 | .10 | −.97 | |
| 4. My interests change from year to year. | 2.94 | 1.21 | −.19 | −.98 | 3.02 | .99 | −.14 | −.67 | 2.92 | 1.10 | −.04 | −1.00 | |
| 5. I have been obsessed with a certain idea or project for a short time but later lost interest. | 2.84 | 1.28 | .02 | −1.07 | 2.97 | 1.05 | −.03 | −.91 | 2.88 | 1.13 | .03 | −1.06 | |
| 6. I have difficulty maintaining my focus on projects that take more than a few months to complete. | 2.99 | 1.29 | −.14 | −1.09 | 2.94 | 1.08 | −.03 | −.92 | 3.13 | 1.14 | −.25 | −.97 | |
| Perseverance of effort | 7. I have achieved a goal that took years of work. | 3.62 | 1.31 | −.50 | −.99 | 3.97 | 1.03 | −.93 | .18 | 3.55 | .99 | −.46 | −.48 |
| 8. I have overcome setbacks to conquer an important challenge. | 4.01 | .94 | −.54 | −.52 | 4.23 | .75 | −1.12 | 2.21 | 3.81 | .80 | −.62 | .54 | |
| 9. I finish whatever I begin. | 3.57 | 1.07 | −.30 | −.69 | 3.70 | .95 | −.43 | −.35 | 3.66 | .90 | −.55 | −.15 | |
| 10. Setbacks don't discourage me. | 3.20 | 1.18 | −.04 | −.91 | 3.45 | 1.03 | −.18 | −.83 | 3.82 | .86 | −.57 | −.06 | |
| 11. I am a hard worker. | 4.33 | .90 | −1.28 | 1.05 | 4.39 | .72 | −1.42 | 3.12 | 4.04 | .74 | −.95 | 2.29 | |
| 12. I am diligent. | 3.96 | .95 | −.54 | −.44 | 4.19 | .75 | −.96 | 1.61 | 3.96 | .84 | −.72 | .58 | |