
Abstract
Background and Objective:
Hospital administrative data serves as a rich source of information for resource allocation, surveillance, and international comparisons. Differences in coding practices and guidelines lead to variations in hospital administrative data. This study outlines our team’s process of creating a standardised tool, the Hospital Administrative Data Quality (HADQ) scoring tool, which will allow countries to assess their HADQ.
Method:
We previously developed 24 indicators through a Delphi consensus method. To test the applicability of these indicators, we approached 50 countries with an online survey comprised of qualitative and quantitative questions based on the 24 indicators. An overall score out of 20 for data quality was calculated for each country based on the survey responses. The score was classified into three categories: high data quality, moderate data quality and low data quality.
Results:
Of the 50 countries invited, 17 responded. Surveys from two countries were excluded due to insufficient data. Country responses were evaluated and scored by dimension. The data quality indicators showed positive face validity and were applicable for most countries providing comparative information for development of the tool with good discrimination. Canada, United States of America, New Zealand, United Kingdom, and Spain were among the countries with an overall high data quality score. Most countries scored high in 3 out of 5 dimensions of data quality. A few counties scored 0 in “Relevance” and “Timeliness” resulting in a lower score.
Conclusion
The HADQ tool developed in this study will support the assessment and comparison of HADQ by applying the same standard within and across countries.
Implications for health information management practice:
The HADQ tool can be used by diverse users such as the researchers, government bodies and policymakers interested in improving hospital administrative data quality following standardised indicators that can applied globally.
Keywords
Introduction
Hospital administrative data that encompass international classification of disease (ICD) coded data are a rich source of information that serve many important purposes, including resource allocation, research, surveillance and assessing the quality of care as well as variations in healthcare delivery (Cadarette and Wong, 2015; Lucyk et al., 2015; Sarrazin and Rosenthal, 2012). As Carvalho et al. (2021) pointed out, this is sometimes the only feasible data source for research studies exploring international comparisons. Hospital administrative data have been used for international comparisons, underlining the importance of coded data and its quality. Some of these examples include comparisons of healthcare services utilisation and spending at the end of life (Blankart et al., 2021), hospital administrative costs (Bottle et al., 2013), clinical outcomes at the hospital level (Bottle et al., 2013), re-admission rates and reasons for re-admissions (Hekkert et al., 2019), and patient outcomes and healthcare resource use for heart failure hospitalisations (Sundaram et al., 2022).
Globally, differences in coding guidelines and practices have led to variations in the quality of hospital coded data (Drosler et al., 2007). Quan et al. (2008) and Carinci et al. (2015) presented the various challenges in accurately assessing and comparing patient safety indicators from ICD-coded data and drawing comparisons on healthcare quality indicators across nations due to variations in coding versions, procedure coding systems and patient classification systems (Carinci et al., 2015; Quan et al., 2008). Issues with coded data quality can include misclassifications, lack of detail in identifying different disease subtypes and difficulties in comparing data across regions (Lucyk, 2016). High-quality data are crucial for guiding clinical decisions, improving healthcare quality and fostering innovation and research in the field (Kruse et al., 2016). The ICD coding was initially created as a global standard to track diseases, allowing hospitals worldwide to report in a common language. Coder training, audits, documentation and software or tools used are all important aspects of data quality (Eastwood et al., 2023; Lucyk et al., 2017). Although the ICD 10th revision (ICD-10), launched in 1987, promoted international comparability, Jette et al. (2010) highlighted the challenges the country-specific modifications pose to the international comparability of morbidity and mortality data. Despite attempts by the World Health Organization (WHO) to regulate modifications derived from the original version, differences exist, including structural variations and definitions of main conditions (Otero-Varela et al., 2021).
Monitoring the quality of health care and health system performance internationally is one of the pertinent roles of the Organization for Economic Co-operation and Development (OECD), which initiated a Health Care Quality Indicators (HCQI) project in 2001 and developed a set of indicators to measure quality across countries (Kelley et al., 2006). As part of the HCQI project, the OECD has been reporting on comparisons of healthcare quality since 2007 through the publication of the “Health at a Glance” series (OECD, 2023). One of the dimensions of the HCQI is patient safety comprised of 21 indicators (Mattke et al., 2006) that rely on hospital ICD-coded data to identify and monitor safety events. Given the utmost importance of hospital administrative data, it becomes crucial to assess its quality before using it for comparative research or funding purposes.
Data quality is a multi-dimensional concept often defined within various frameworks that differ between countries, making international comparisons challenging. Nationally and internationally, multiple data quality frameworks exist that are comprised of different data quality dimensions that also share similarities (Ramasamy and Chowdhury, 2020; Smith et al., 2018). For example, data quality frameworks have been developed by the Canadian Institute for Health Information, Statistics Canada, Australian Bureau of Statistics, New Zealand Ministry of Health, Irish Health Information and Quality Authority and other organisations (Austrailian Bureau of Statistics, 2009; Health Information and Quality Authority, 2018; Kerr, 2000; Long and Seko, 2002; Statistics Canada (n.d.)). As such, an international standardised approach to assess data quality is still lacking due to the inconsistencies between frameworks within and between countries. The data quality indicators (DQIs) assessed in the current study were developed using the robust Delphi technique with health information expert panel members from a variety of organisations who rated each indicator based on its appropriateness at a global scale. Recognising the need to develop a standardised way to assess hospital administrative data internationally, our research team previously conducted a comprehensive environmental scan that identified potential indicators to assess data quality followed by a modified Delphi consensus panel of international health information experts to finalise and refine the indicators (Otero-Varela et al., 2024). The resulting final set consisted of 24 DQIs classified according to Canadian Institute for Health Information’s (CIHI) Information Quality Framework (Canadian Institute for Health Information, n.d.) comprising five different dimensions: (1) Relevance, (2) Accuracy and Reliability, (3) Comparability and Coherence, (4) Timeliness and (5) Accessibility and Clarity (Otero-Varela et al., 2024).
Building on this prior work, the purpose of our current study was to assess the applicability of the previously developed DQIs by testing at an international level and developing a standardised scoring tool. By applicability, we mean testing the feasibility and utility for collecting DQI data in a variety of countries with variable healthcare systems. This proposed scoring tool would enable the assessment of administrative data quality in a standardised manner allowing individual countries to assess their data quality and recognise areas for improvement.
Method
Literature-based evidence search
We previously conducted an international survey to explore the ICD version and the data collection features used worldwide in which 26 countries participated (Otero-Varela et al., 2021). In the current study testing the feasibility and utility of the 24 DQIs, the initial approach was to conduct a thorough grey literature search using terms such as “International Classification of Diseases in [country name]” or “Health Information Management Association in [country name]” or “Patient Health Identifier” or “Health Administrative Databases in [country name]” to find evidence on each indicator and ascertain how well it was met for the same 26 countries. This search resulted in the finding of some peer-reviewed literature as well. A few countries, for example, Canada and Australia, had sufficient information available through organisational websites such as the CIHI (Canadian Institute for Health Information, n.d.), the Australian Institute of Health and Welfare (Austrailian Government, n.d.), and The Independent Health and Aged Care Pricing Authority (Independant Health and Aged Care Pricing Authority, n.d.). However, many other countries, such as Mauritius and Barbados, did not have such information online. Overall, as the search lacked considerable evidence, the subsequent approach used was the development and administration of an international survey about the DQIs.
DQI Application using an international survey
We approached a total of 50 countries that had publicly available contacts through memberships with international organisations such as the International Federation of Health Information Management Association (n.d.), World Health Organization Family of International Classification (WHO-FIC) Network (World Health Organization, n.d.), Pan American Health Organization (n.d.) as well as the Ministries of Health and participants that previously participated in the 3-round Delphi panel finalising the DQIs. The survey was developed using Qualtrics software and collected between October 2022 and February 2023. Two reminders were sent during this interval if the survey was not completed. Characteristics such as population, gross domestic product (GDP) per capita, percentage of GDP used for health care and ICD version used were noted for each participating country. Sustainable development goals indicators of universal health coverage indicate the average coverage of essential health services and out-of-pocket health spending (World Health Organization, 2019).
The survey included the DQIs depicted through qualitative and quantitative questions. For each qualitative survey question, respondents were provided three options to choose from: “Yes” if their country met the indicator, “No” if their country did not meet the indicator, and “Other” to provide a text response if either a “Yes” or a “No” was not an accurate/appropriate response. For quantitative percentage questions, respondents had four options to choose from: 0% to 25%, 26% to 50%, 51% to 75% and 76% to 100%. Additional questions to collect information about respondent attributes such as the job title and the number of years of experience working with hospital coded data were also included.
This study was approved by the Conjoint Health Research Ethics Board at the University of Calgary (REB19-1465).
Scoring tool
The scoring tool was generated in a two-step process. This process was guided by the scoring criteria methodology followed by Savvopoulos et al. (2018) for developing a scoring tool to assess the quality of discharge summaries, where based on the information in the discharge summary, the individual items in the quality criteria were assigned a score from 0 to 2 (Savvopoulos et al., 2018). As such, if the discharge summary contained optimal information for an individual item, a score of 2 was assigned, deficient or excessive information resulted in a deduction of one point, and a score of 0 was assigned if the information was completely absent in the summary.
Results
As the survey provided more comprehensive data about the individual DQIs compared to the literature-based evidence, the results included and discussed in this article are from the survey.
Following our scoring method outlined above, we first assessed individual indicators based on the information in the survey responses. For qualitative indicators, a maximum score of 2 was assigned for a Yes answer and a score of 0 for a No response. For quantitative indicators, a score of 0 or 2 was assigned for percentage ranges of 0% to 25% or 76% to 100% depending on the indicator. For example, 76% to 100% of inpatient admissions captured would be ideal and thus a score of 2 whereas 76% to 100% of charts using “Symptom” codes would not be and thus given a score of 0. For percentage ranges 25% to 50% or 51% to 75%, a score of 1 was given. Second, we standardised the dimensions by scoring each dimension out of 4. Table 1 demonstrates the scoring and standardisation of the scores. With 5 dimensions, the total score was then summed out of 20. The HADQ Score was classified into 3 categories: high data quality score (⩾18), moderate data quality score (13–17.9) and low data quality score (<13). Based on the survey responses, scores were calculated and each country was classified into one of the three categories for data quality score. Radar figures were generated to show individual scores by each dimension and country.
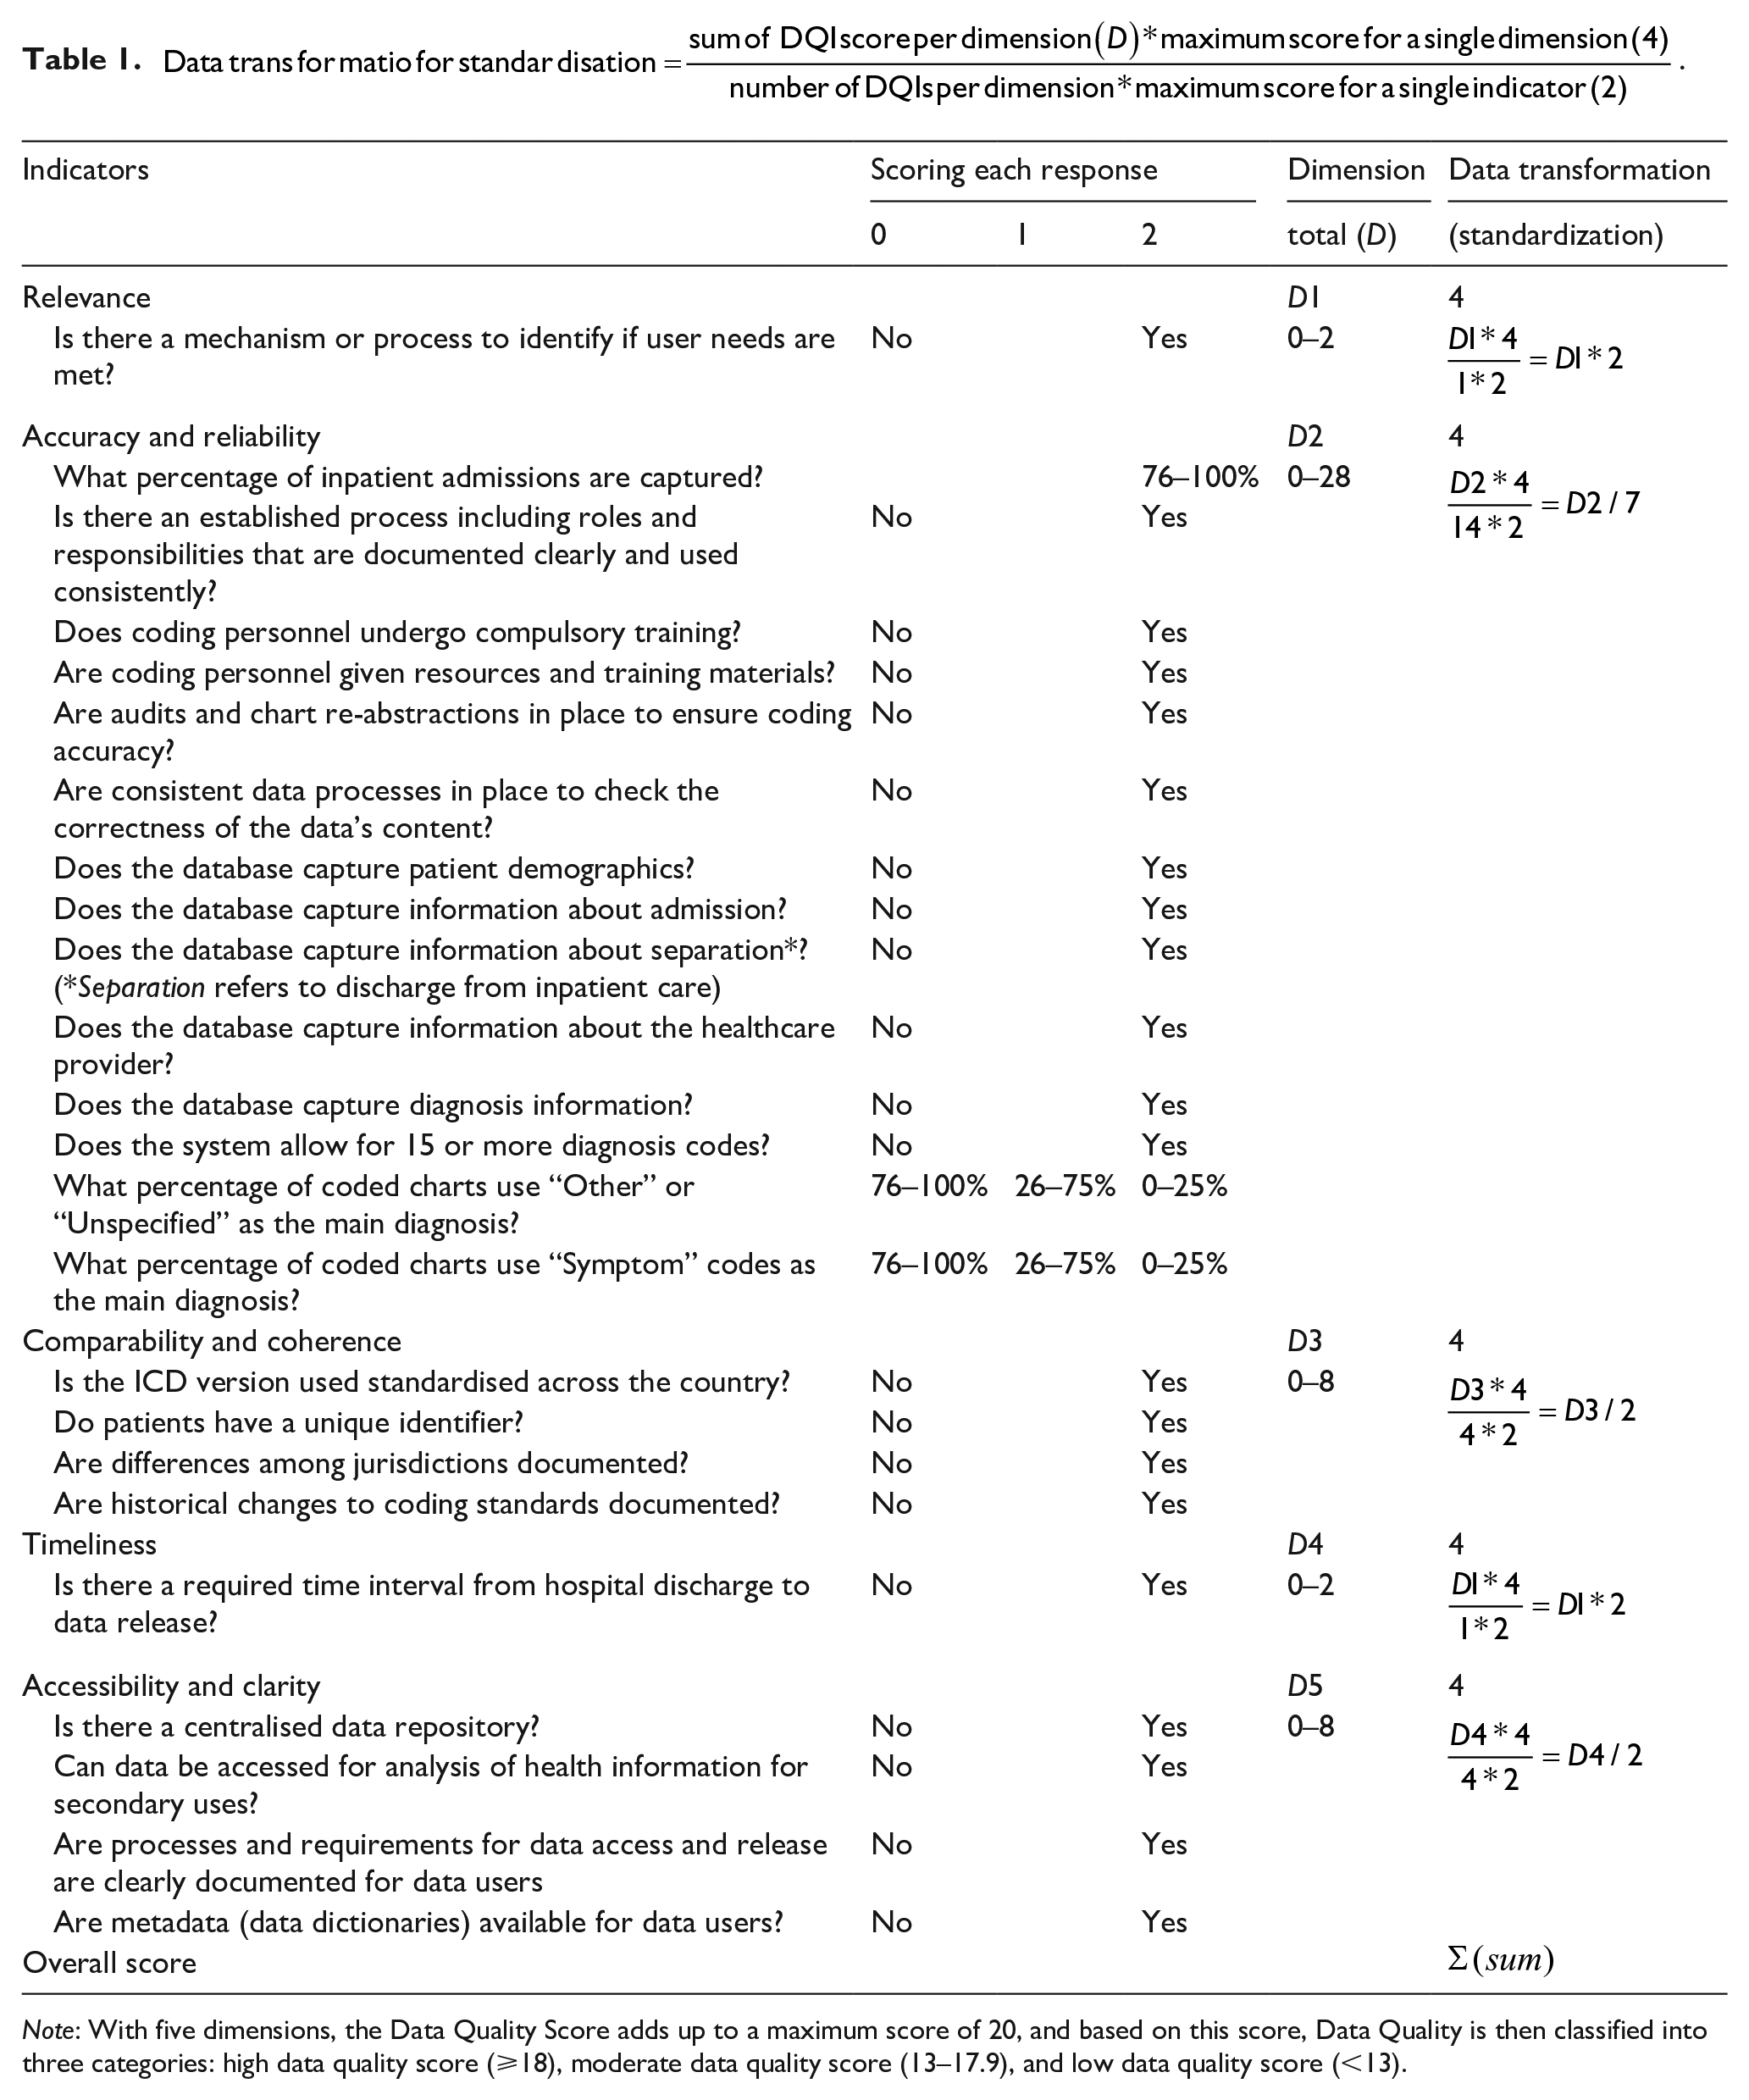
Note: With five dimensions, the Data Quality Score adds up to a maximum score of 20, and based on this score, Data Quality is then classified into three categories: high data quality score (⩾18), moderate data quality score (13–17.9), and low data quality score (<13).
Demographic data
Of the 50 countries approached, 17 responded with a 34% response rate. Surveys from two countries were excluded from the analysis due to the incomplete responses to questions, with the remaining 15 countries included in the analysis. Various professionals responded to the survey, ranging from Health Information Managers, Health Records Officers, and Heads of WHO-FIC Collaborating Centres to Clinical Specialists and Statisticians. Participants’ experience working with administrative health data ranged from 2 to 34 years, with most having over 20 years of experience. A general overview of the countries that completed the survey is included in Table 2. We collected data from countries with a range of overall GDP, proportion of GDP spent on health care, and average coverage of essential health services and out-of-pocket health spending. All countries used ICD-10, although several had country-specific versions.
Characteristics of countries completing the survey.
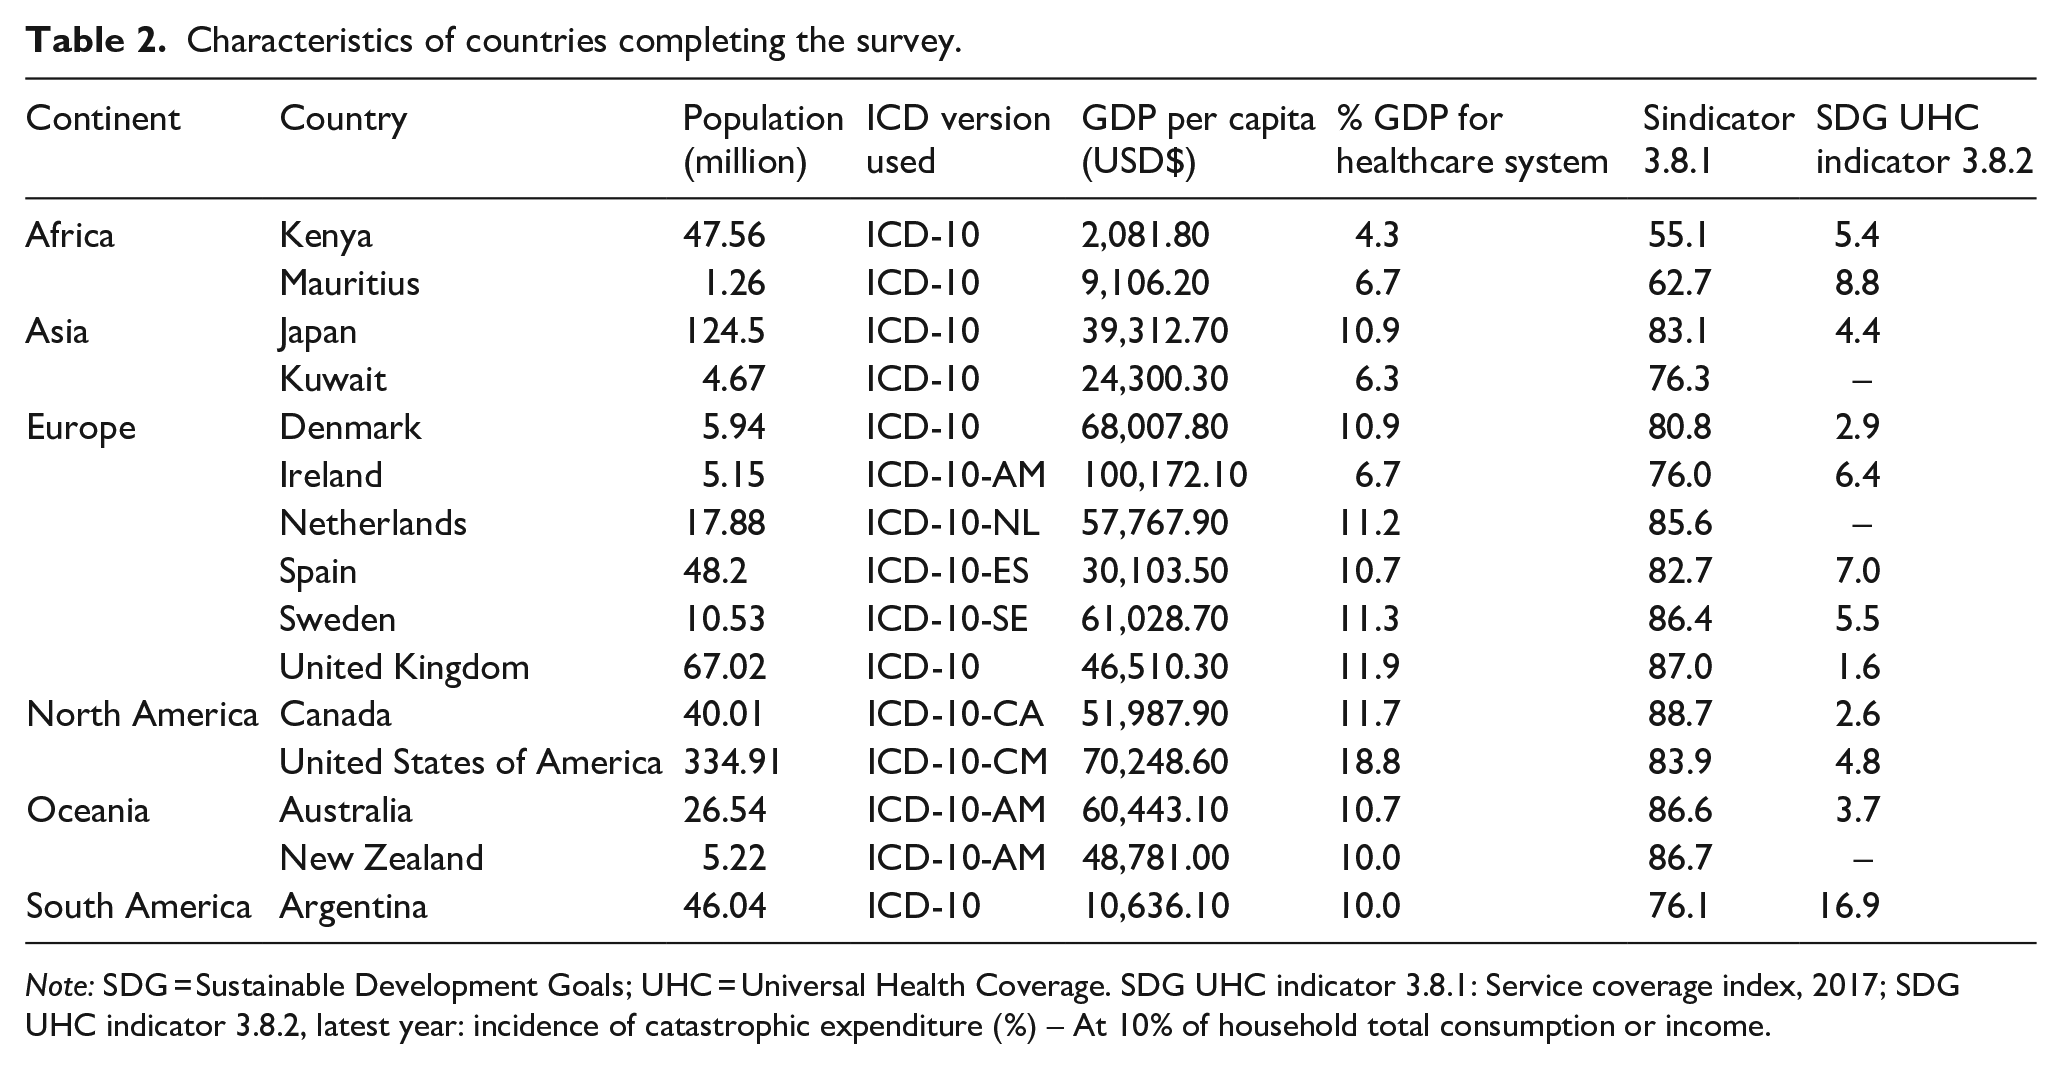
Note: SDG = Sustainable Development Goals; UHC = Universal Health Coverage. SDG UHC indicator 3.8.1: Service coverage index, 2017; SDG UHC indicator 3.8.2, latest year: incidence of catastrophic expenditure (%) – At 10% of household total consumption or income.
International survey results and DQIs applicability
Figure 1 shows survey results completed by representatives from 15 countries representing 5 geographic continents. For qualitative questions, the colour blue indicates a “Yes” response, red indicates a “No” answer and grey indicates questions with missing information. For quantitative questions, percentages are indicated where blue shows a favourable response and red shows an unfavourable response. We note several questions were answered as “Other” where the respondent provided a qualitative text response. Most were translated into a “Yes” or a “No” reply based on the text response. For instance, one respondent answered “captures information about the hospital and about the healthcare provider’s specialty” to the survey question asking if the database captured information about the healthcare provider. Therefore, this response was considered to have met this indicator and is presented in blue. On the other hand, if a respondent selected “Other” and provided text responses such as “unsure,” “I don’t know,” or “I think so,” these were considered neither a “Yes” nor a “No” and were therefore presented in the colour grey. Additionally, some responses indicated meeting the indicator “partly” in the text response; though not fully satisfied, these indicators were presented in blue.
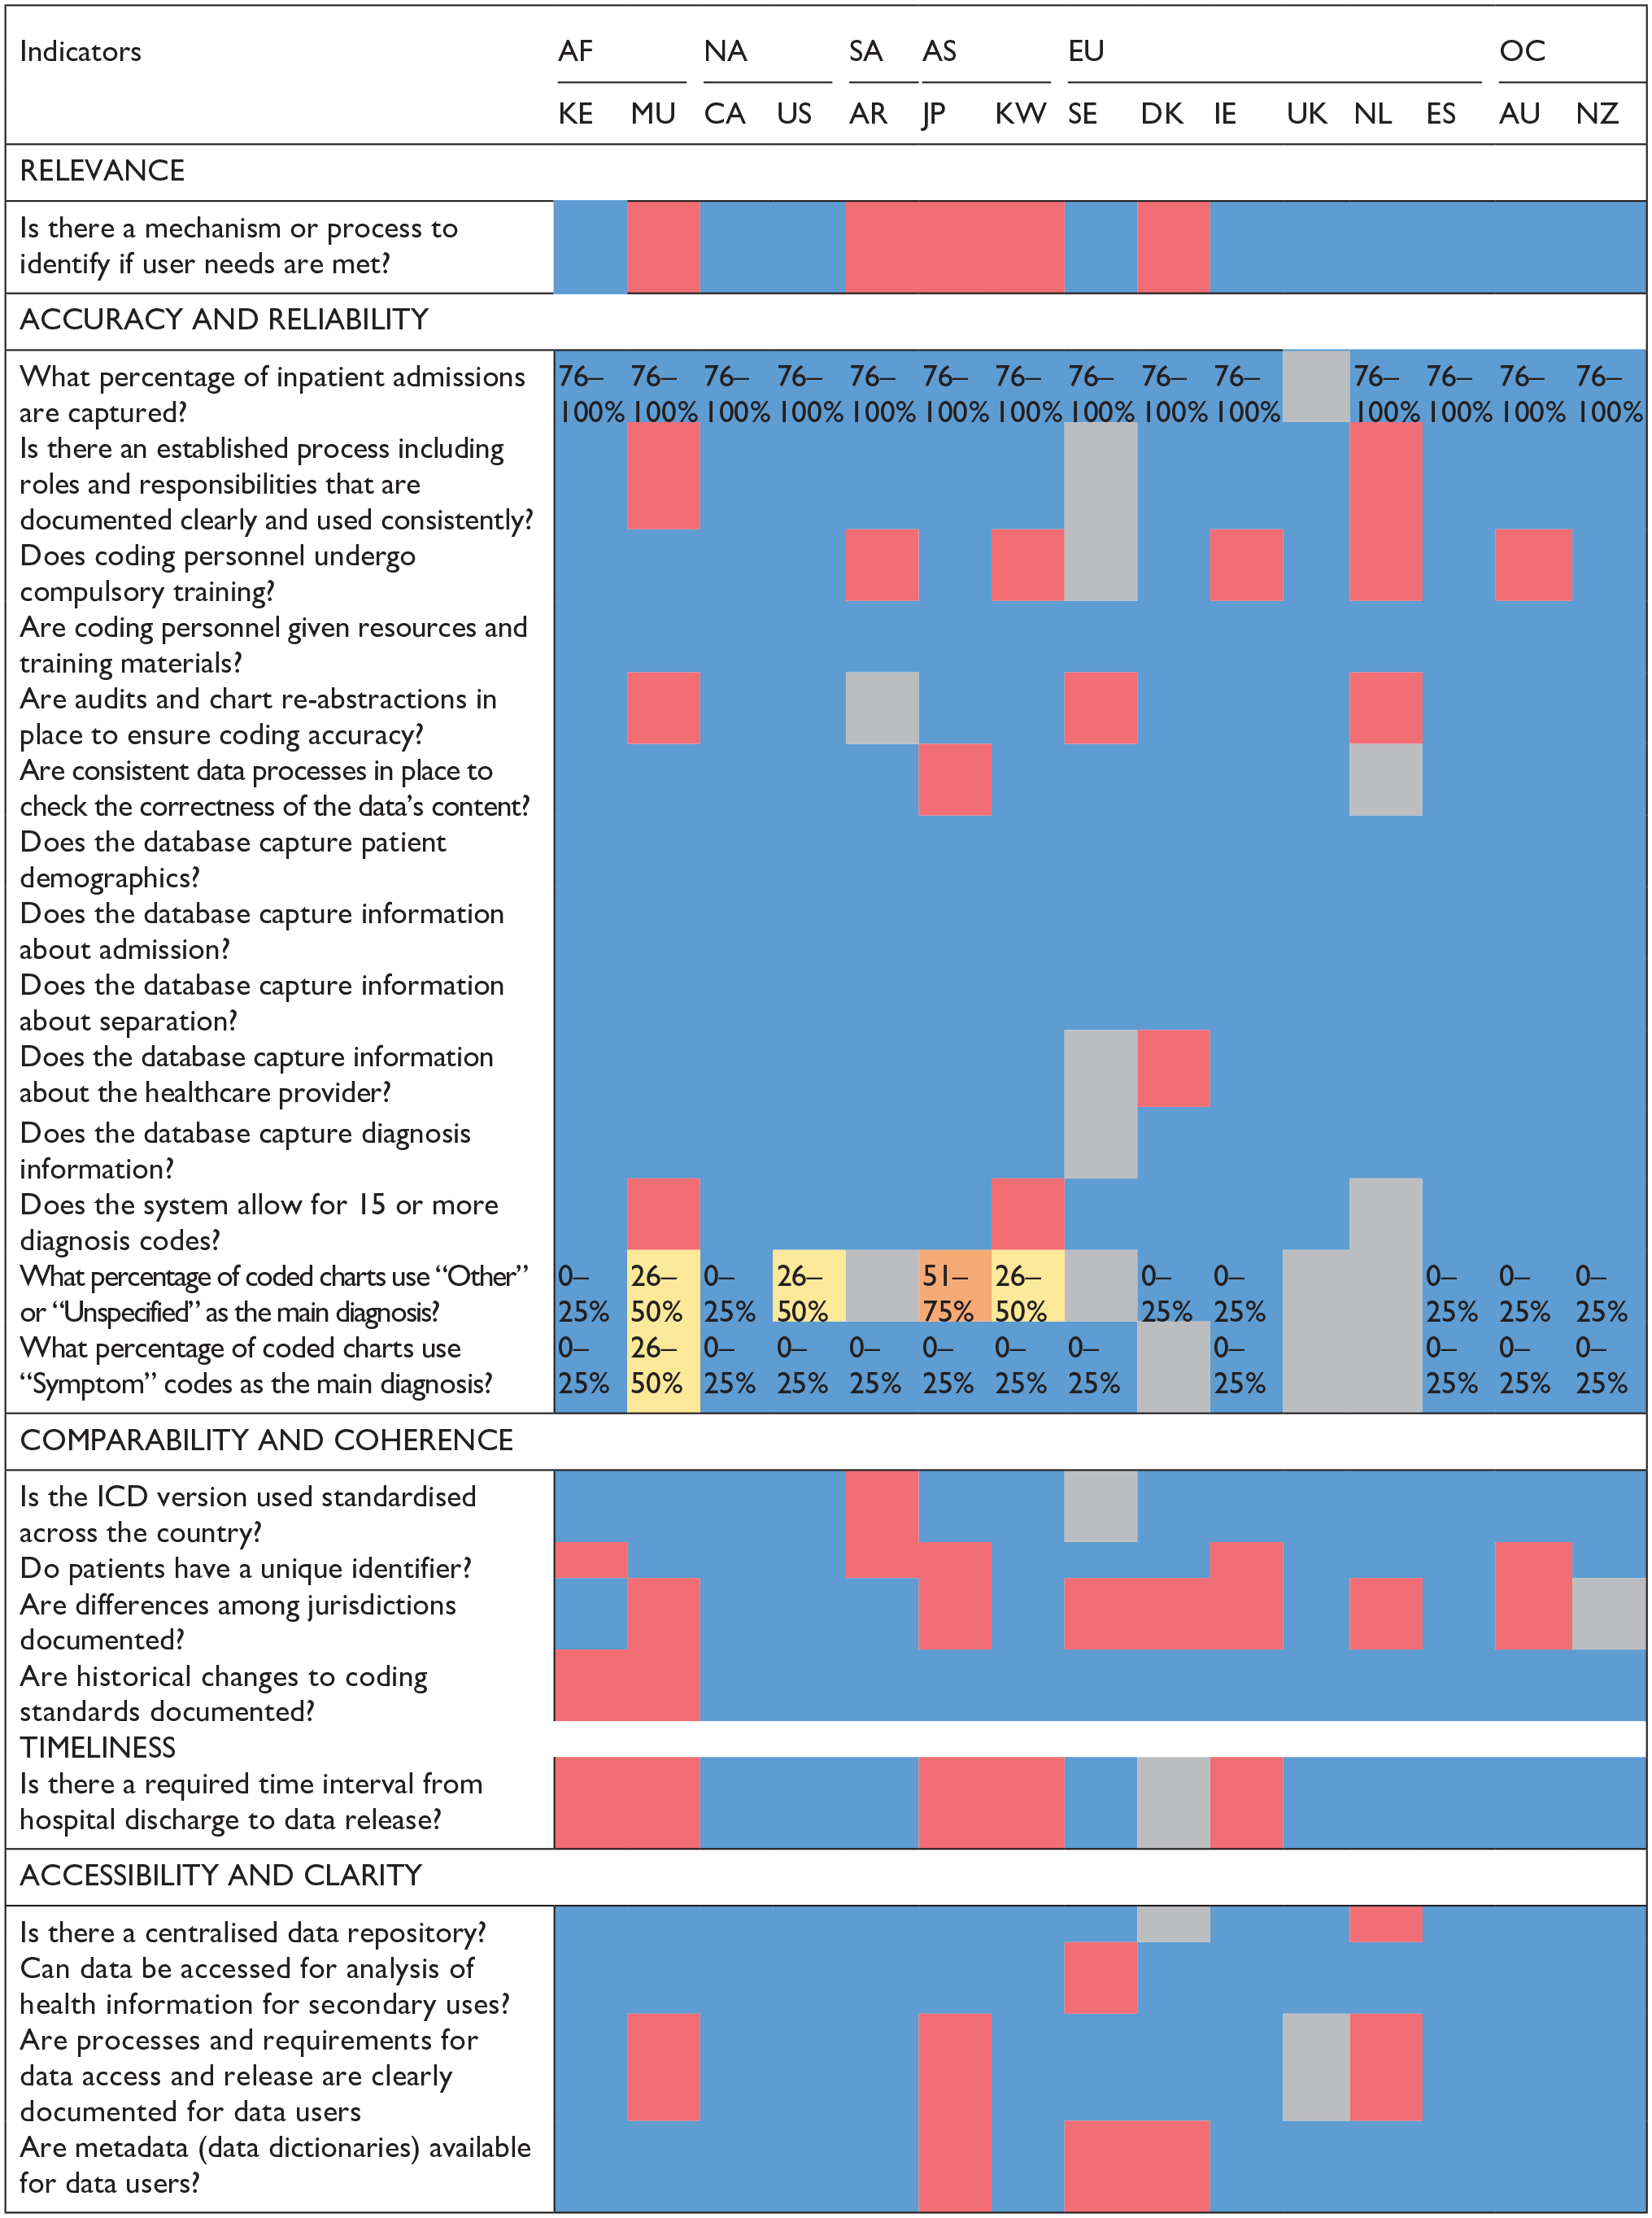
Survey results of data quality indicators applied in 15 countries.
Overall, the survey results show that most DQIs are met by the countries participating in the study, thus validating the applicability of the DQIs on an international scale. Countries that met most DQIs included Canada, the United States of America, Spain and New Zealand and the United Kingdom met all the indicators it responded to besides the four indicators left unanswered, whereas Australia and Kenya met 21 out of 24 DQIs. The study team reiterates that this survey is not intended to rank countries based on the DQIs they meet or do not meet. Instead, it is to test, in multiple countries, the applicability of the DQIs previously determined by the research team. These DQIs provide information about the comprehensiveness and quality of the hospital administrative databases for each country. This DQI scoring tool demonstrates where individual countries differ in terms of data quality practices. For instance, five countries indicated “No” to coding personnel undergoing compulsory training. Some of the countries studied required coders to have a certain level of training without evaluating their skills through a certification examination. Another example is that under the “comparability and coherence” dimension, eight countries indicated that practice differences across jurisdictions (e.g., health authorities, provinces, states), which impact data analysis and interpretation, are not documented for data users. Overall, the survey results indicate that DQIs were applicable for the majority of the countries providing comparative information across five different dimensions of health administrative data quality. Given the applicability of the DQIs based on these results, the tool can be utilised as a starting point by countries that are yet to form guidelines for establishing hospital administrative databases as well as other countries that have systems in place but lack standardisation within the country.
Scoring Criteria and Tool
The radar figures (Figure 2a, b, c]) show the scoring levels for the 15 countries completing the survey. With a score of greater than 3 in each dimension and an overall score of ⩾18, Canada, Spain, the USA, New Zealand and the United Kingdom are among the countries in the high data quality score category (Figure 2a). Australia, Kenya, Ireland, Netherlands and Sweden are classified into moderate data quality score category with an overall score between 13.0 and 17.9.
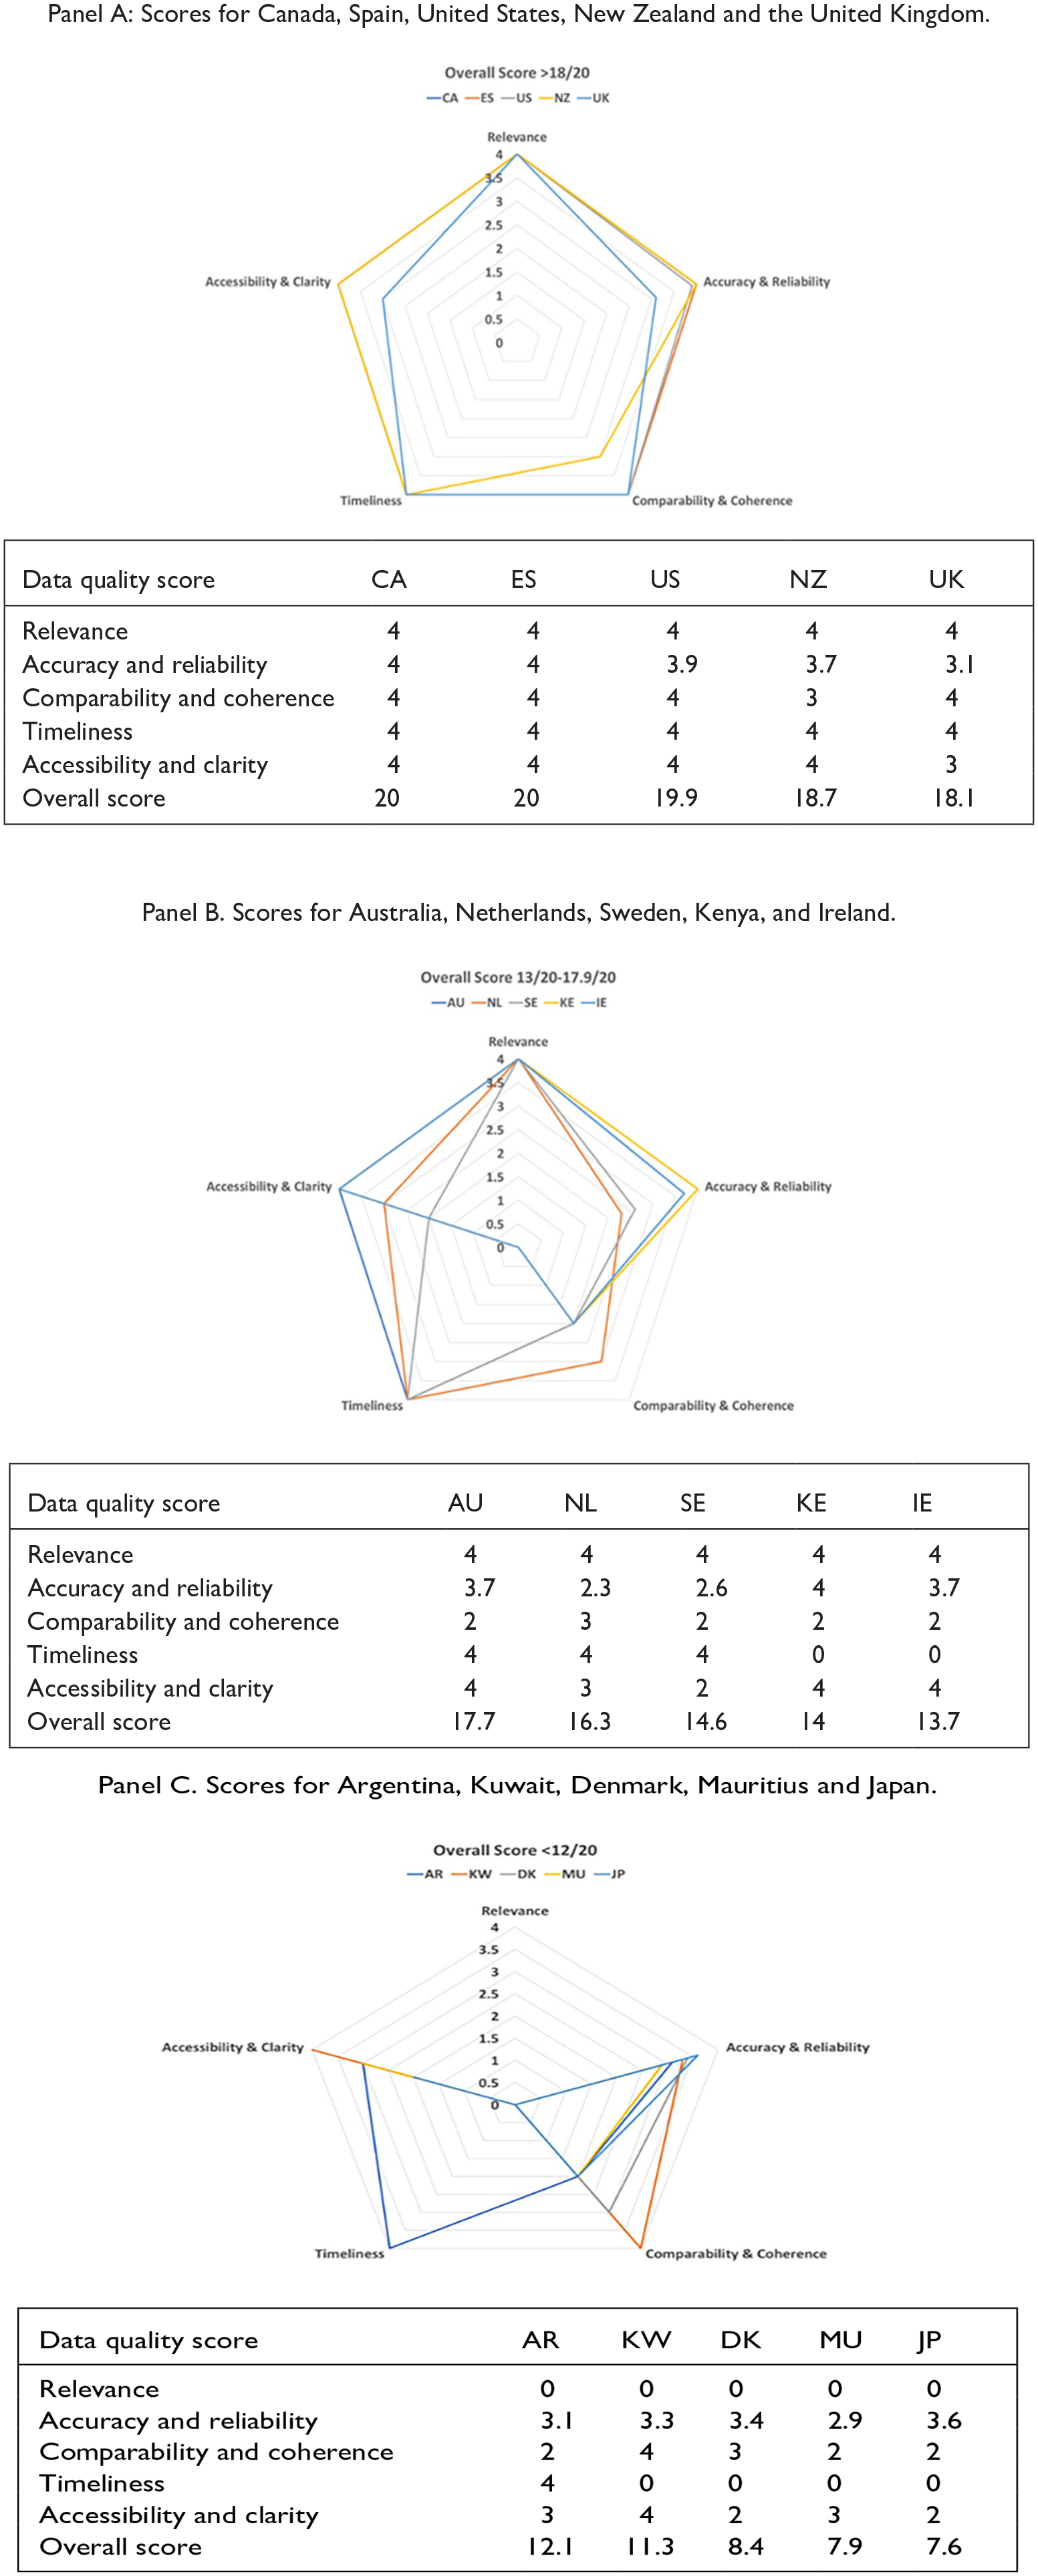
Countries with high (Panel A), moderate (Panel B) and low (Panel C) data quality scores.
This Data Quality Scoring Tool should be used carefully as some countries performing low in one dimension may be performing high in others. Thus, depending on the context for which the administrative data are being used, a country with a low or moderate overall data quality score may still provide valuable and meaningful data. For instance, as shown in Figure 2b, in the Accuracy and Reliability dimension, Kenya and Ireland performed well by scoring “4” and “3.7,” respectively. However, in the Timeliness dimension, these countries scored lower, with a score of zero. The difference in scores between dimensions shows that while these countries may have highly accurate and reliable hospital administrative data, these data may not be accessible or available to users promptly as there is no required time interval from the hospital discharge data to data release to users.
For the countries with a low data quality score in Figure 2c, it is important to highlight that they scored zero in the “Relevance” dimension, which only had one indicator (mechanism or process to identify users/stakeholders’ needs are met). Four of the five countries in this category scored zero in the “Timeliness” dimension, which also had one indicator. When DQI scores are plotted like these figures, country representatives can visualise data quality strengths and dimensions or indicators requiring improvement.
Discussion
This study tested the applicability of a set of 24 DQIs, comprising five dimensions, for the assessment of the quality of hospital administrative data via an international survey. The survey data was collected from diverse geographic countries with responses from 15 nations across 5 continents. The results demonstrated that the DQIs have a strong face validity and can be applied internationally. Using these DQIs, we developed a standardised scoring tool that classifies the quality of administrative data into three categories: low (<13), moderate (13–17.9) and high (⩾18), and can be used for data quality evaluation and international comparison of hospital administrative data.
The survey illustrated the differences and similarities in processes and standards related to hospital administrative data collection, access and comparability among 15 countries. All participating countries reported that they provide resources and training materials to coding personnel, and many also have compulsory training requirements. Consistent processes to check the correctness of data, audits and re-abstraction were in place in most of the participating countries. Administrative data elements related to admission, separation, diagnosis and patient demographics were captured by all participating countries with most allowing capturing of 15 or more diagnosis codes in a centralised repository accessible for secondary uses. Also, most countries reported to be using a standardised ICD version across the country and had historical changes to coding standards documented. Interestingly, more than half of the participating countries reported that differences among jurisdictions across a country were not documented. Combining all these important components, among others, and constructing a scoring tool that quantifies the quality of data is a novel way to standardise hospital data quality measurement. With equal weights assigned to each dimension, the scoring tool ensures that the quality of data is assessed uniformly across all dimensions.
Although the dimensions included in our proposed tool have similarities to other frameworks, a major strength of this tool is its broad coverage of concepts and applicability to assess administrative health data quality at an international scale. The DQI tool is an easy-to-use tool for diverse users including researchers, government bodies and policy makers. For countries yet to develop coding systems and standard processes for hospital administrative data collection, this tool stipulates the important dimensions and indicators for capturing high-quality data. As well, for countries keen on improving the quality of data, the DQIs present an actionable set of indicators to achieve this goal. The utility and potential for the DQIs for measuring health system performance are discussed in the previous study (Otero-Varela et al., 2024). Evaluating a country’s data strengths and weaknesses will allow countries to pinpoint certain issues within their own data collection practices and explore how to make their health data internationally comparable.
Our proposed scoring tool has the potential to be of value to OECD’s HCQI initiative that evaluates healthcare quality and patient safety across the nations using administrative data. For instance, some of the indicators used by OECD are “avoidable mortality due to cardiovascular disease and stroke,” and “avoidable hospital admissions due to conditions such as asthma and COPD.” OECD’s recent report alludes to variations in data classification systems and registration practices across countries impacting data comparability (OECD, 2023). Use of the HADQ tool to understand the existing variations in quality of hospital data can highlight the underlying factors impacting outcomes of such global or comparative studies. Previously, countries with better data quality were inadvertently deemed to have lower patient safety compared to countries with poor data quality, so assessing data quality in a standardised manner will mitigate the risk of compromising such research findings (Drosler et al., 2007). A comprehensive list of 105 potential root causes leading to hospital administrative data quality (HADQ) problems has been developed by Carvalho et al. (2021). Based on the user’s needs, our DQI tool could be used either as a standalone tool or in combination with the assessment of 105 potential root causes for a more extensive data quality assessment.
Our study also had limitations that are important to note. First, the results only report the applicability of the DQIs across 15 nations that participated in the survey. It is possible that countries that do not currently have coding systems or infrastructure in place did not participate in the survey. Second, as just one representative from each country completed the survey, the responses provided, though best to their knowledge, may still be subjective, especially for the “Relevance” dimension and may vary from stakeholder to stakeholder. This can be mitigated by having multiple representatives from different organisations involved in hospital administrative data collection or developing data collection standards complete the survey to accurately assess the data quality. We also note that one of the representatives who completed the survey only had two years of experience and responded as “I don’t know” or “unsure” to several questions, resulting in a lower score for the country. Therefore, the scores presented in this paper may need to be validated by individual countries. This study focused on testing the tool at an international country level, however, collecting surveys at a regional level is also important due to differences in standard policies and procedures leading to variations in data quality at regional level. As this tool is increasingly used by more and more countries to inform the administrative data collection guidelines, it could evolve in the future where more indicators are added to further enhance the comparability of collected data across the world. Finally, the survey was only administered in English language. Providing the survey in more languages may help scale the reach and inclusion of a wider range of countries.
Conclusion
In conclusion, we propose a well-tested tool with strong face validity that can be applied confidently by international organisations, governments and researchers to evaluate and compare HADQ using the same standard across the countries. Measuring the quality of administrative health data promotes improved data collection practices and strengthens the quality of research findings using ICD data, and our research is a preliminary step in this direction. Future work will focus on developing concrete recommendations for countries looking to improve their data quality as well as external validation of the data quality assessment tool.
Footnotes
Declaration of conflicting interests
The author(s) declared no potential conflicts of interest with respect to the research, authorship and/or publication of this article.
Funding
The author(s) disclosed receipt of the following financial support for the research, authorship and/or publication of this article: This work was funded by the CIHR Foundation Grant.